. 2022 May 29;23(11):6090.
doi: 10.3390/ijms23116090.

Neu3 Sialidase Activates the RISK Cardioprotective Signaling Pathway during Ischemia and Reperfusion Injury (IRI)

Affiliations

Neu3 Sialidase Activates the RISK Cardioprotective Signaling Pathway during Ischemia and Reperfusion Injury (IRI)

Marco Piccoli et al. Int J Mol Sci. .

Abstract

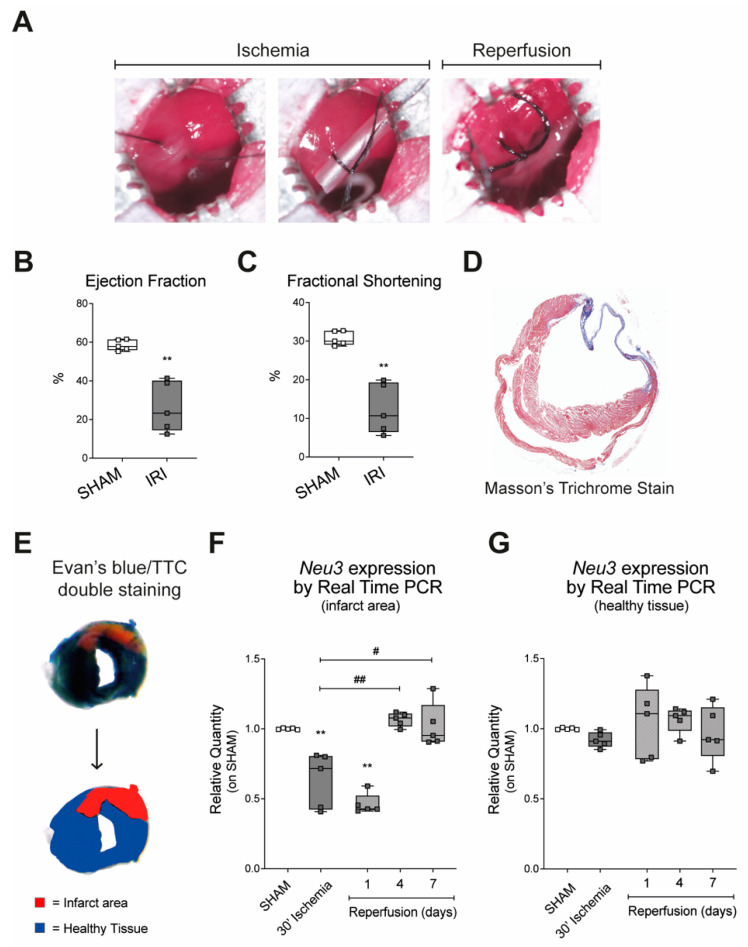
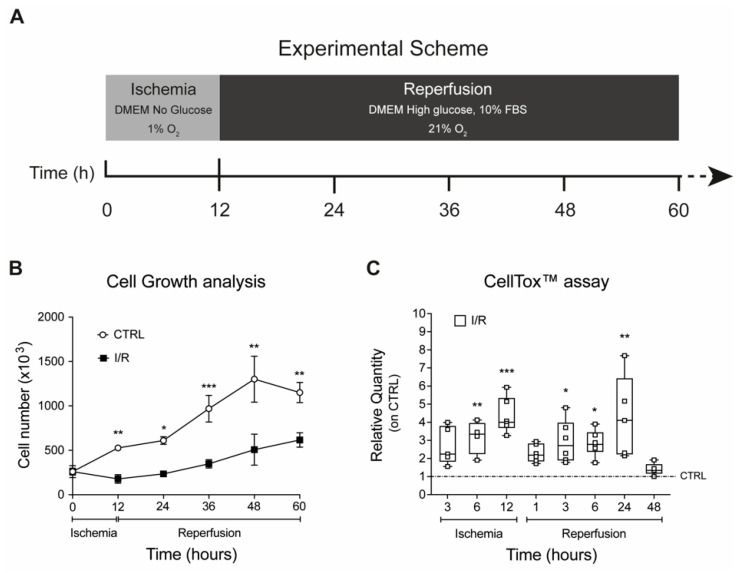
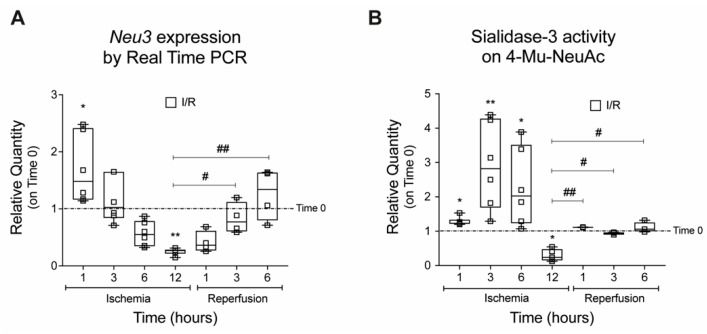
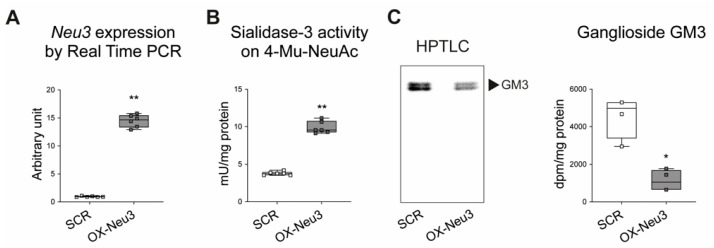
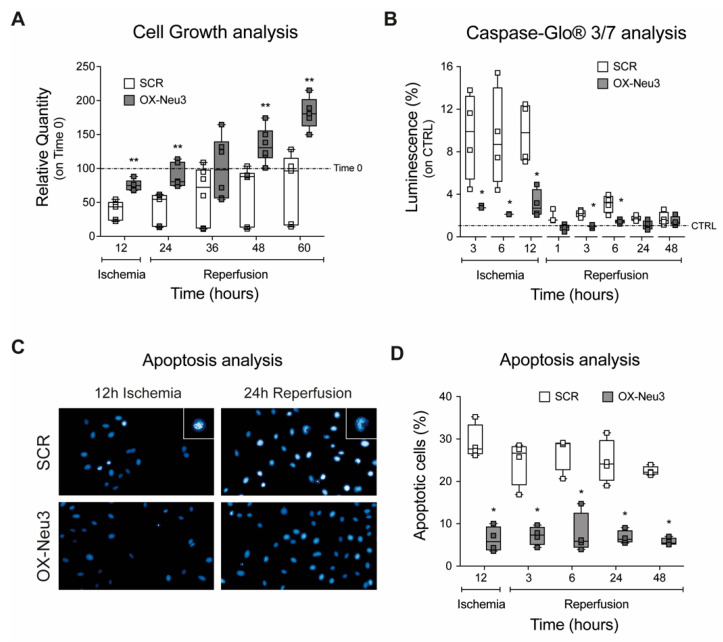
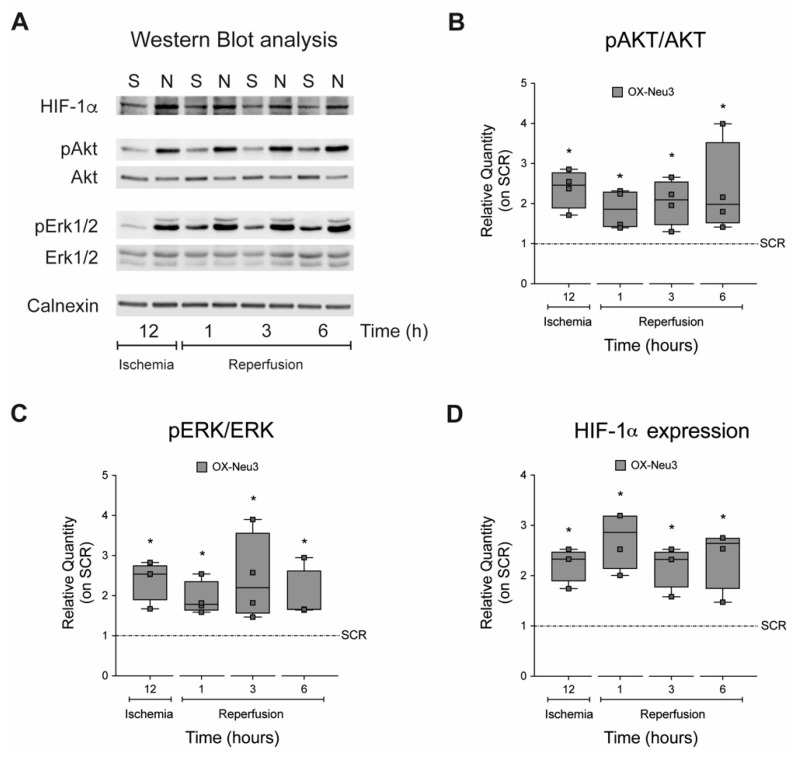
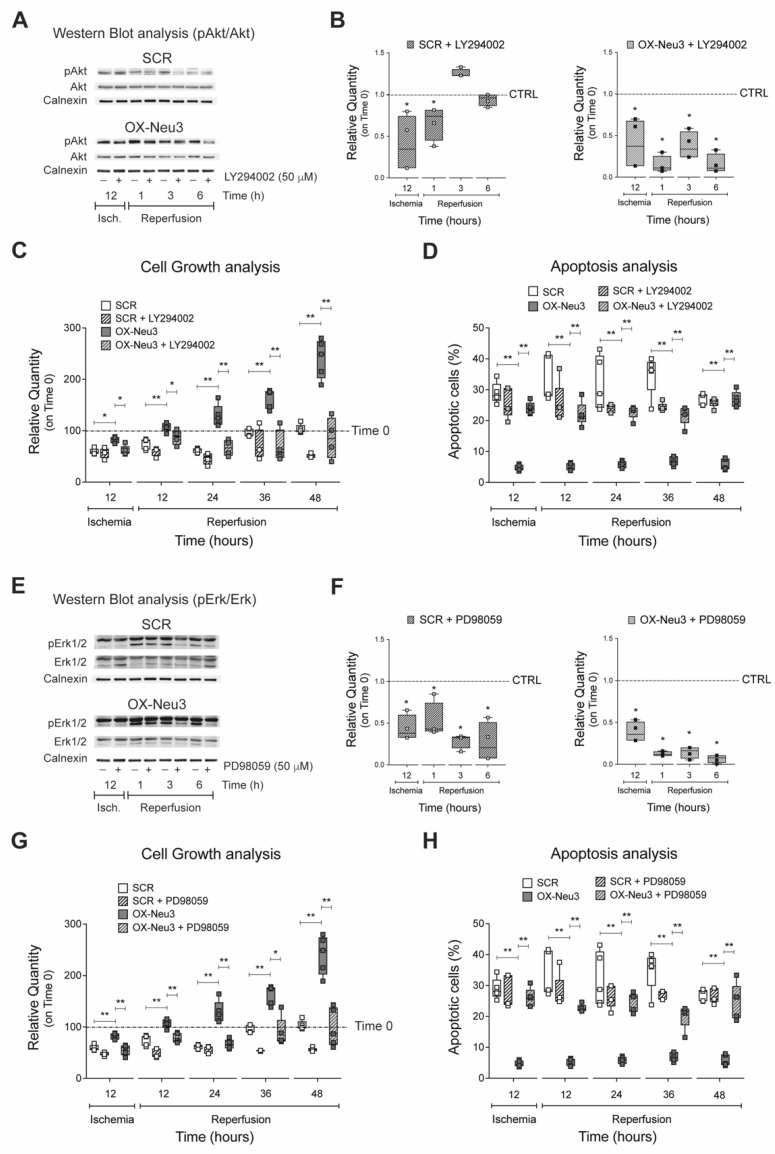
Coronary reperfusion strategies are life-saving approaches to restore blood flow to cardiac tissue after acute myocardial infarction (AMI). However, the sudden restoration of normal blood flow leads to ischemia and reperfusion injury (IRI), which results in cardiomyoblast death, irreversible tissue degeneration, and heart failure. The molecular mechanism of IRI is not fully understood, and there are no effective cardioprotective strategies to prevent it. In this study, we show that activation of sialidase-3, a glycohydrolytic enzyme that cleaves sialic acid residues from glycoconjugates, is cardioprotective by triggering RISK pro-survival signaling pathways. We found that overexpression of Neu3 significantly increased cardiomyoblast resistance to IRI through activation of HIF-1α and Akt/Erk signaling pathways. This raises the possibility of using Sialidase-3 activation as a cardioprotective reperfusion strategy after myocardial infarction.

Keywords: Neu3; cardioprotective strategies; gangliosides; ischemia and reperfusion injury; myocardial infarction; sialidase-3.


Conflict of interest statement

The authors declare that the research was conducted in the absence of any commercial or financial relationships that could be construed as a potential conflict of interest.

Figures

Figure 1
Figure 1
Effects of ischemia and reperfusion exposure on the expression of sialidase Neu3. (A) Ischemia and reperfusion injury in vivo model obtained by temporary ligation of the left anterior descending coronary vessel; (B,C) cardiac function was assessed by echocardiography. Ejection fraction (B) and fractional shortening (C) are shown as percentages, in comparison between sham and animals subjected to IRI. (D) Morphological cardiac analysis to assess fibrotic scarring with Masson’s trichrome staining; (E) Evan’s blue/TTC double staining schematic representation; (F) sialidase Neu3 expression in the infarcted area measured by Real Time PCR (G) sialidase Neu3 expression in healthy cardiac tissue measured by Real Time PCR. Data are expressed as relative amounts compared with sham animals. Each square in the graphs represent a single animal. Statistical significance was determined by the nonparametric Kruskal-Wallis test.; ** p < 0.01. The # symbol indicates the statistical significance as compared to 30′ ischemia: # p < 0.05; ## p < 0.01.
Figure 2
Figure 2
Effects on cell proliferation and cytotoxicity in an in vitro model of IRI. (A) Schematic representation of in vitro model of IRI; effects of IRI on H9c2 in terms of proliferation (B) and cytotoxicity (C). Each square in the graphs represent an experimental replicate. In the legend: CTRL represents H9c2 cells maintained in normoxic culture conditions; I/R represents H9c2 cells exposed to ischemia and reperfusion. Statistical significance was determined by the nonparametric Kruskal-Wallis test. * p < 0.05; ** p < 0.01; *** p < 0.001.
Figure 3
Figure 3
Effects of ischemia and reperfusion on Neu3 expression and Sialidase-3 activity. (A) Expression of sialidase Neu3 measured by real time PCR; (B) enzymatic activity of sialidase-3 measured on the synthetic substrate 4-Mu-NeuAc. Data are expressed as relative quantities compared with H9c2 not exposed to IRI and collected at the beginning of the experiments (Time 0 dashed line). Each square in the graphs represent an experimental replicate. Statistical significance was determined by the nonparametric Kruskal-Wallis test. * p < 0.05; ** p < 0.01. The # symbol indicates the statistical significance as compared to 30′ ischemia. # p < 0.05; ## p < 0.01.
Figure 4
Figure 4
Sialidase-3 overexpression in H9c2 cardiomyoblasts. (A) Expression of sialidase Neu3 measured by Real Time PCR; (B) enzymatic activity of sialidase-3 measured on the synthetic substrate 4-Mu-NeuAc; (C) analysis of ganglioside GM3 by labeling with [3-3H]-sphingosine. Left panel (C): radiochromatographic image of HPTLC separation of gangliosides contained in the aqueous phase. Right panel (C): GM3 quantification expressed as dpm/mg protein. Each square in the graphs represent an experimental replicate. Statistical significance was determined by the nonparametric Mann-Whitney test. * p < 0.05; ** p < 0.01.
Figure 5
Figure 5
Effects of Neu3 overexpression in H9c2 cells exposed to IRI. (A) Cell growth analysis. Data are expressed as relative quantity (%) as compared to both SCR or OX-Neu3 cells at the beginning of IRI treatment (Time 0 dashed line) (B) caspase 3/7 activation analysis through the Caspase-Glo® 3/7 assay. Data are expressed as fold change as compared to both SCR or OX-Neu3 cells maintained in standard culture conditions and not exposed to IRI, used as controls (CTRL dashed line); (C) apoptotic nuclei staining by Hoechst 33,342; White squares represent apoptotic cells magnification; (D) apoptosis level analysis expressed as percentage of apoptotic nuclei per total nuclei. Each square in the graphs represent an experimental replicate. Statistical significance was determined by the nonparametric Kruskal-Wallis test by comparing OX-Neu3 cells to SCR cells at any time point analyzed. * p < 0.05; ** p < 0.01.
Figure 6
Figure 6
Effects of sialidase Neu3 overexpression on the RISK pathway activation and HIF-α expression. Activation of the RISK pathway and expression of HIF-1α in scramble and OX-Neu3 cells exposed to IRI were evaluated by Western Blot. (A) Western Blot of HIF-1α; phospho-Akt (Thr308) and total Akt; phospho-Erk1/2 (Thr202/Tyr204) and total Erk1/2; Calnexin; (B) ratio between phospho-Akt (Thr308) and total Akt; (C) ratio between phosho-Erk1/2 (Thr202/Tyr204) and total Erk1/2; (D) HIF-1α expression level. Calnexin was used as a housekeeper to normalize protein expression levels. “S” is the abbreviation for SCR cells; “N” is the abbreviation for OX-Neu3 cells. Data are expressed as relative amounts compared with scramble cells, used as internal control for each time point analyzed (SCR dashed line). Each square in the graphs represent an experimental replicate. Statistical significance was determined by the nonparametric Kruskal-Wallis test by comparing OX-Neu3 cells to SCR cells at any time point analyzed. * p < 0.05.
Figure 7
Figure 7
Effects of sialidase-3 inhibition on activation of the RISK pathway. Activation of Akt and Erk1/2 in OX-Neu3 H9c2 treated with LR332 (arbitrary name given to the non-commercially available sialidase3 inhibitor synthesized by our group) was examined by WB. (A) WB analysis of phospho-Akt (Thr308) and total-Akt (upper panel); ratio between phospho-Akt (Thr308) and total-Akt (lower panel); (B) WB analysis of phospho-Erk1/2 (Thr202/Tyr204) and total-Erk1/2 (upper panel); ratio between phospho-Erk1/2 (Thr202/Tyr204) and total-Erk1/2 (lower panel). Data are expressed as relative amounts compared with LR332 untreated OX-Neu3 cells exposed to IRI in vitro (CTRL dashed line). Each square in the graphs represent an experimental replicate. Statistical significance was determined by the nonparametric Kruskal-Wallis test. * p < 0.05; ** p < 0.01.
Figure 8
Figure 8
Effects of the RISK pathway inhibition on the sialidase-3 mediated cardioprotective effects. (A) WB analysis of phospho-Akt (Thr308) and total-Akt in scramble and OX-Neu3 cells treated with LY294002. Calnexin was used as a housekeeper to normalize protein expression; (B) ratio between phospho-Akt (Thr308) and total-Akt. The levels of Akt activation, at each time point analyzed, have been expressed as relative quantity using either LY294002-untreated SCR or OX-Neu3 cells exposed to IRI in vitro as internal reference control (CTRL dashed line); (C) analysis of cell growth of scramble and OX-Neu3 cells treated with LY294002 and exposed to IRI. Data are expressed as relative quantity (%) compared to either SCR or OX-Neu3 cells at the beginning of IRI exposure (Time 0 dashed line); (D) analysis of apoptosis level of scramble and OX-Neu3 cells treated with LY294002 and exposed to IRI. Results are expressed as percentage of apoptotic nuclei per total nuclei; (E) WB analysis of phospho-Erk1/2 (Thr202/Tyr204) and total Erk1/2 in both scramble and OX-Neu3 cells treated with PD98059. Calnexin was used as a housekeeper to normalize protein expression; (F) ratio between phospho-Erk1/2 (Thr202/Tyr204) and total Erk1/2. The levels of Erk1/2 activation, at each time point analyzed, have been expressed as relative quantity using either PD98059-untreated SCR or OX-Neu3 cells exposed to IRI in vitro as internal reference control (CTRL dashed line); (G) cell growth analysis of scramble and OX-Neu3 cells treated with PD98059 and exposed to IRI. Data are expressed as relative quantity (%) compared to either SCR or OX-Neu3 cells at the beginning of IRI exposure (Time 0 dashed line); (H) apoptosis analysis of scramble and OX-Neu3 cells treated with PD98059 and exposed to IRI. Results are expressed as percentage of apoptotic nuclei per total nuclei. Each square in the graphs represent an experimental replicate. Statistical significance was determined by the nonparametric Kruskal-Wallis test. * p < 0.05; ** p < 0.01.

Similar articles

Cited by

References

    1. Li Y., Huo C., Pan T., Li L., Jin X., Lin X., Chen J., Zhang J., Guo Z., Xu J., et al. Systematic review regulatory principles of non-coding RNAs in cardiovascular diseases. Brief Bioinform. 2019;20:66–76. doi: 10.1093/bib/bbx095. - DOI - PubMed
    1. Virani S.S., Alonso A., Benjamin E.J., Bittencourt M.S., Callaway C.W., Carson A.P., Chamberlain A.M., Chang A.R., Cheng S., Delling F.N., et al. Heart Disease and Stroke Statistics-2020 Update: A Report From the American Heart Association. Circulation. 2020;141:e139–e596. doi: 10.1161/CIR.0000000000000757. - DOI - PubMed
    1. Benjamin E.J., Blaha M.J., Chiuve S.E., Cushman M., Das S.R., Deo R., de Ferranti S.D., Floyd J., Fornage M., Gillespie C., et al. Heart Disease and Stroke Statistics-2017 Update: A Report From the American Heart Association. Circulation. 2017;135:e146–e603. doi: 10.1161/CIR.0000000000000485. - DOI - PMC - PubMed
    1. Reddy K., Khaliq A., Henning R.J. Recent advances in the diagnosis and treatment of acute myocardial infarction. World J. Cardiol. 2015;7:243–276. doi: 10.4330/wjc.v7.i5.243. - DOI - PMC - PubMed
    1. Roule V., Ardouin P., Blanchart K., Lemaitre A., Wain-Hobson J., Legallois D., Alexandre J., Sabatier R., Milliez P., Beygui F. Prehospital fibrinolysis versus primary percutaneous coronary intervention in ST-elevation myocardial infarction: A systematic review and meta-analysis of randomized controlled trials. Crit. Care. 2016;20:359. doi: 10.1186/s13054-016-1530-z. - DOI - PMC - PubMed