. 2022 May 30;23(11):6124.
doi: 10.3390/ijms23116124.

Dissecting the Molecular Regulation of Natural Variation in Growth and Senescence of Two Eutrema salsugineum Ecotypes

Affiliations

Dissecting the Molecular Regulation of Natural Variation in Growth and Senescence of Two Eutrema salsugineum Ecotypes

Fanhua Wang et al. Int J Mol Sci. .

Abstract

Salt cress (Eutrema salsugineum, aka Thellungiella salsuginea) is an extremophile and a close relative of Arabidopsis thaliana. To understand the mechanism of selection of complex traits under natural variation, we analyzed the physiological and proteomic differences between Shandong (SD) and Xinjiang (XJ) ecotypes. The SD ecotype has dark green leaves, short and flat leaves, and more conspicuous taproots, and the XJ ecotype had greater biomass and showed clear signs of senescence or leaf shedding with age. After 2-DE separation and ESI-MS/MS identification, between 25 and 28 differentially expressed protein spots were identified in shoots and roots, respectively. The proteins identified in shoots are mainly involved in cellular metabolic processes, stress responses, responses to abiotic stimuli, and aging responses, while those identified in roots are mainly involved in small-molecule metabolic processes, oxidation-reduction processes, and responses to abiotic stimuli. Our data revealed the evolutionary differences at the protein level between these two ecotypes. Namely, in the evolution of salt tolerance, the SD ecotype highly expressed some stress-related proteins to structurally adapt to the high salt environment in the Yellow River Delta, whereas the XJ ecotype utilizes the specialized energy metabolism to support this evolution of the short-lived xerophytes in the Xinjiang region.

Keywords: Eutrema salsugineum; growth; molecular regulation; natural variation; salt tolerance; senescence.


Conflict of interest statement

The authors declare no conflict of interest.

Figures

Figure 1
Figure 1
Growth and morphological analysis of SD and XJ plants cultured in a hydroponic system for 6 weeks. (A,B) Growth status of SD and XJ plants. (C) Comparison of leaf inclination angles of SD and XJ plants after 6 weeks of hydroponics. (DF) The primary root length, fresh weight (FW), and dry weight (DW) of two Eutrema were examined. (G) Leaf inclination angle measurements were made between the central axis and the penultimate leaf of two Eutrema. (H) Concentration of IAA in shoots. Data were expressed as means ± SD and t-test was used for statistical analysis. (* p < 0.05, ** p < 0.01 and *** p < 0.001). All experiments were tripled, and each experiment contained at least 9 plants.
Figure 2
Figure 2
Senescence analysis of SD and XJ plants cultured in a hydroponic system for 6 weeks. (A) The growth state of the shoots. (B) Comparison of SD and XJ plants with 9th–14th leaves. Bars = 1 cm. (C) Total chlorophyll content in leaves of SD and XJ plants. (D) Leaf area values for SD and XJ plants. (E) The concentration of CK in SD and XJ shoots. Concentrations of CK in SD and XJ. (F) Expression of SAG12 and SAG113 in leaves of two ecotypes. Data are presented as means ± SD and t-test was used for statistical analysis. (** p < 0.01 and *** p < 0.001).
Figure 3
Figure 3
The 2-DE profiles of SD and XJ Eutrema proteins under normal hydroponic conditions for 6 weeks. The marked spots were identified by ESI-MS/MS. (A) 2-DE protein gel was from SD Eutrema shoots. (B) 2-DE protein gel was from XJ Eutrema shoots. (C) 2-DE protein gel extracted from SD Eutrema root. (D) 2-DE protein gel extracted from XJ Eutrema root.
Figure 4
Figure 4
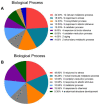
Functional annotation of different proteins under normal hydroponic conditions. (A) Biological processes of proteins identified in shoots. (B) Biological processes of proteins identified in roots.
Figure 5
Figure 5
Expression patterns of representative differentially expressed proteins in shoots from two Eutrema ecotypes under normal hydroponic conditions. (A) Quantitative analysis of differentially expressed protein (DEPs) species spots related to cellular metabolic processes. (B) Quantification of DEPs spots related to stress responses. (C) Changes in the expression of the ACO4 protein spot in the shoot. (D) ACO concentrations in SD and XJ shoots. Statistical analysis was performed on the normalized volume percentage (% Vol) of protein spots in 3 replicate biological samples using the mean ± SD method and statistical calculations were performed using the t-test. (** p < 0.01 and *** p < 0.001). The abbreviations for Figure 5 were: SS, shoot of SD ecotype; XS, shoot of XJ ecotype; KARI, ketoacid reductase isomerase; GSH2, glutathione synthetase; iPGAM1, 2,3-bisphosphoglycerate-independent phosphoglycerate mutase 1; iPGAM1−1, spot SS4; iPGAM1−2, spot SS5; APS1, ATP sulfurylase 1; PCAP1, plasma membrane-associated cation-binding protein 1; PCAP1−1, spot SS6; PCAP1−2, spot SS7; PCAP1−3, spot SS8; PR5, pathogenesis-related protein 5; CHI, endochitinase; BG1, glucan endo−1, 3-beta-glucosidase; Cpn 20, 20 kDa chaperonin; ACO4, 1-aminocyclopropane-1-carboxylate oxidase 4.
Figure 6
Figure 6
Expression patterns of some root protein spots on the 2-DE map. Marked points are differentially expressed proteins. (A) 2,3-bisphosphoglycerate-independent phosphoglycerate mutase 1 (iPGAM1) (spots SR5, 6 and 7, spots XR7, 2 and 3). (B) pyruvate dehydrogenase E1 component subunit beta-1 (MAB1) (spots SR16, XR9). (C) monodehydroascorbate reductase 2 (MDAR2) (spots SR8, XR8). (D) glutathione S-transferase F10 (GST PHI10) (spots SR10, XR10) and 20 kDa chaperonin (Chaperonin 20, Cpn20) (spots SR11, XR11). (E) paraxanthine methyltransferase 1 (PXMT1) (spots SR15, XR15) and (F) jacalin-related lectin 34 protein (JRL34) (spots SR1, 2, 3, and spots XR4). The abbreviations for Figure 6 were: SR, root of SD ecotype; XR, root of XJ ecotype.
Figure 7
Figure 7
Relative transcript levels in two Eutrema plants under normal hydroponic conditions for 6 weeks. (A) Differentially expressed genes in shoots. (B) Differentially expressed genes in roots. Data are presented as mean ± SD obtained from 3 biological replicates. t-test was used to analyze the changes in the gene expression (* p < 0.05, ** p < 0.01, and *** p < 0.001). The abbreviations for Figure 7 were: PR5, pathogenesis-related protein 5; CHI, endochitinase; ACO4, 1-aminocyclopropane-1-carboxylate oxidase 4; AGD2, LL-diaminopimelate aminotransferase; GSH2, glutathione synthetase; PCAP1, plasma membrane-associated cation-binding protein 1; BG1, glucan endo-1,3-beta-glucosidase; KARI, ketoacid reductase isomerase; ADH1, alcohol dehydrogenase class-P; PXMT1, paraxanthine methyltransferase 1; CI76, NADH dehydrogenase [ubiquinone] iron-sulfur protein 1; MMSDH, methylmalonate-semialdehyde dehydrogenase; FQR1, NAD(P)H dehydrogenase (quinone); MDAR2, monodehydroascorbate reductase 2; GST PHI10, glutathione S-transferase F10; Cpn20, 20 kDa chaperonin; MAB1, pyruvate dehydrogenase E1 component subunit beta-1.

Similar articles

References

    1. Bressan R.A., Zhang C., Zhang H., Hasegawa P.M., Bohnert H.J., Zhu J.-K. Learning from the Arabidopsis experience. Plant Physiol. 2001;127:1354–1360. doi: 10.1104/pp.010752. - DOI - PMC - PubMed
    1. Inan G., Zhang Q., Li P., Wang Z., Cao Z., Zhang H., Zhang C., Quist T.M., Goodwin S.M., Zhu J., et al. Salt cress. A halophyte and cryophyte Arabidopsis relative model system and its applicability to molecular genetic analyses of growth and development of extremophiles. Plant Physiol. 2004;135:1718–1737. doi: 10.1104/pp.104.041723. - DOI - PMC - PubMed
    1. Taji T., Seki M., Satou M., Sakurai T., Kobayashi M., Ishiyama K., Narusaka Y., Narusaka M., Zhu J.K., Shinozaki K. Comparative genomics in salt tolerance between Arabidopsis and Arabidopsis-related halophyte salt cress using Arabidopsis microarray. Plant Physiol. 2004;135:1697–1709. doi: 10.1104/pp.104.039909. - DOI - PMC - PubMed
    1. Gong Q., Li P., Ma S., Indu Rupassara S., Bohnert H.J. Salinity stress adaptation competence in the extremophile Thellungiella halophila in comparison with its relative Arabidopsis thaliana. Plant J. 2005;44:826–839. doi: 10.1111/j.1365-313X.2005.02587.x. - DOI - PubMed
    1. Li P., Mane S.P., Sioson A.A., Robinet C.V., Heath L.S., Bohnert H.J., Grene R. Effects of chronic ozone exposure on gene expression in Arabidopsis thaliana ecotypes and in Thellungiella halophila. Plant Cell Environ. 2006;29:854–868. doi: 10.1111/j.1365-3040.2005.01465.x. - DOI - PubMed

LinkOut - more resources