. 2022 May 30;23(11):6142.
doi: 10.3390/ijms23116142.

Maternal Prenatal Inflammation Increases Brain Damage Susceptibility of Lipopolysaccharide in Adult Rat Offspring via COX-2/PGD-2/DPs Pathway Activation

Affiliations

Maternal Prenatal Inflammation Increases Brain Damage Susceptibility of Lipopolysaccharide in Adult Rat Offspring via COX-2/PGD-2/DPs Pathway Activation

Jiahua Zhang et al. Int J Mol Sci. .

Abstract

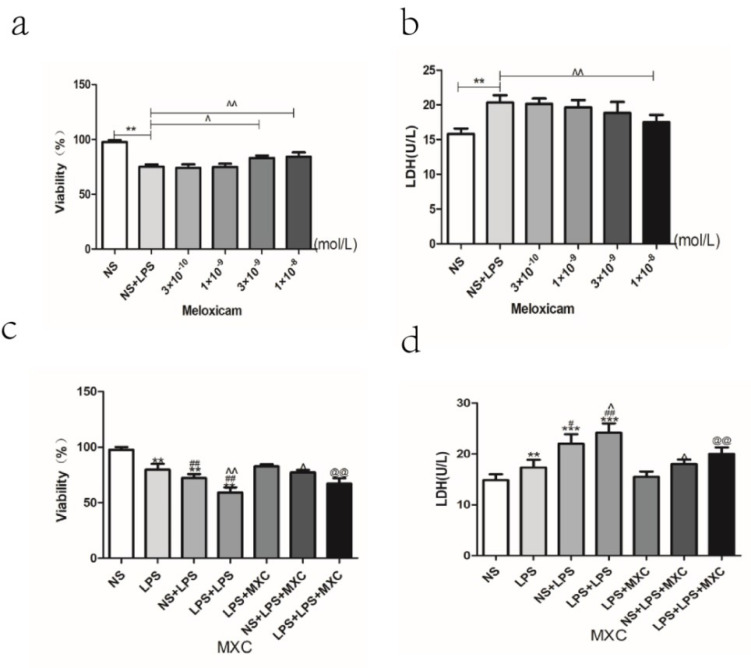
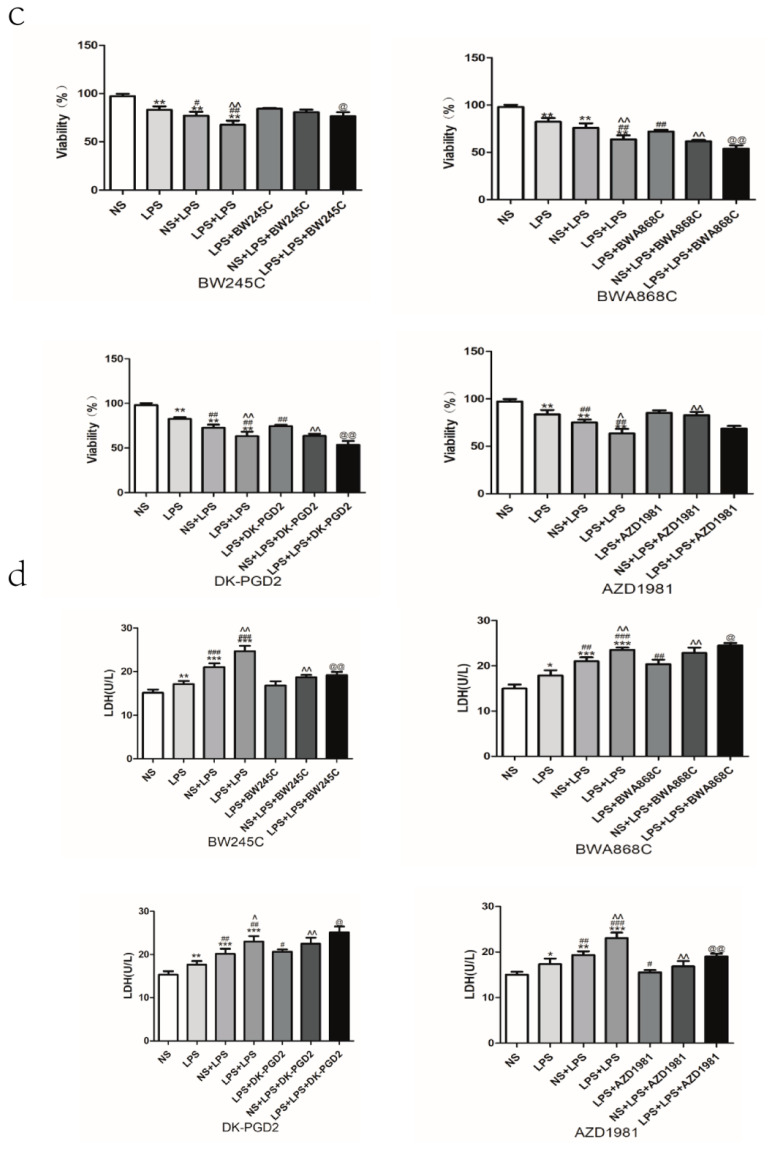
A growing body of research suggests that inflammatory insult contributes to the etiology of central nervous system diseases, such as depression, Alzheimer's disease, and so forth. However, the effect of prenatal systemic inflammation exposure on offspring brain development and cerebral susceptibility to inflammatory insult remains unknown. In this study, we utilized the prenatal inflammatory insult model in vivo and the neuronal damage model in vitro. The results obtained show that prenatal maternal inflammation exacerbates LPS-induced memory impairment, neuronal necrosis, brain inflammatory response, and significantly increases protein expressions of COX-2, DP2, APP, and Aβ, while obviously decreasing that of DP1 and the exploratory behaviors of offspring rats. Meloxicam significantly inhibited memory impairment, neuronal necrosis, oxidative stress, and inflammatory response, and down-regulated the expressions of APP, Aβ, COX-2, and DP2, whereas significantly increased exploring behaviors and the expression of DP1 in vivo. Collectively, these findings suggested that maternal inflammation could cause offspring suffering from inflammatory and behavioral disorders and increase the susceptibility of offspring to cerebral pathological factors, accompanied by COX-2/PGD-2/DPs pathway activation, which could be ameliorated significantly by COX-2 inhibitor meloxicam treatment.

Keywords: DPs; central nervous system inflammation; cyclooxygenase-2; lipopolysaccharide; prenatal maternal inflammation.


Conflict of interest statement

The authors declare no conflict of interest.

Figures

Figure 1
Figure 1
Effect of MXC on learning cognitive function in LPS-treated offspring from prenatal inflammation exposure: (a) Comparison of the mean escape latencies to find the hidden platform at days 1–5. Escape latencies were significantly increased in LPS + CSF, NS + LPS, and LPS + LPS groups compared with NS + CSF group. Compared with NS + LPS group, LPS + LPS group animals spent more time in finding. (b) Comparison of the mean in the number of crosses in the MWM at day 5. Passing times in target quadrant were significantly decreased in LPS + CSF, NS + LPS, and LPS + LPS groups compared with NS + CSF group. Data are mean ± SEM, n = 9–10. (* p < 0.05, ** p < 0.01 vs. NS + CSF group; # p < 0.05 vs. LPS + CSF group; ^ p < 0.05). (c) Comparison of each group to find the trajectory of the hidden platform.
Figure 2
Figure 2
Effect of MXC on the exploratory behavior and spontaneous locomotor activity in LPS-treated offspring after prenatal inflammation exposure: (a) rearing behavior, (b) horizontal movement (times), (c) grooming episodes, and (d) amount of defecation during the 5 min trial period. (e) Effect of MXC on the spontaneous motor activity in LPS-treated offspring from prenatal inflammation exposure. Data are mean ± SEM, n = 9–10. (* p < 0.05, ** p < 0.01, *** p < 0.001 vs. NS + CSF group; # p < 0.05, ## p < 0.01 vs. LPS + CSF group; ^ p < 0.05 vs. NS + LPS group; @ p < 0.05, @@ p < 0.01 vs. LPS + LPS group).
Figure 3
Figure 3
Effect of MXC on hippocampal and cortical histopathology in LPS-treated offspring from prenatal inflammation exposure: (a) Representative images of HE staining in cortex fields from NS + CSF, LPS + CSF, NS + CSF, LPS + CSF, LPS + CSF + MXC, NS + CSF + MXC, LPS + CSF + MXC groups; quantitative analysis of neuronal counts in the seven groups. Note decreased neuronal counts and enhanced neuronal damage in LPS + LPS group compared with NS + LPS group. (b) Representative images of HE staining in hippocampus fields from NS + CSF, LPS + CSF, NS + CSF, LPS + CSF, LPS + CSF + MXC, NS + CSF + MXC, LPS + CSF + MXC groups; quantitative analysis of neuronal counts in the seven groups. Note reduced neuronal counts and increased neuronal damage in LPS + LPS group compared with NS + LPS group. Data are mean ± SEM, n = 4. (** p < 0.01, *** p < 0.001 vs. NS + CSF group; # p < 0.05, ## p < 0.01 vs. LPS + CSF group; ^^ p < 0.01 vs. NS + LPS group; @ p < 0.05 vs. LPS + LPS group).
Figure 4
Figure 4
Effect of MXC on the levels of inflammatory factors and oxidative stress in LPS-treated offspring from prenatal inflammation exposure: (a) Effect of MXC on the levels of PGD-2, TNF-α, IL-1β, and IL-6 in LPS-treated offspring from prenatal inflammation exposure. Different protein expressions levels were determined through ELISA kits. (b) Effect of MXC on the MDA levels in LPS-treated offspring after prenatal inflammation exposure. (c) Effect of MXC on the SOD activity in LPS-treated offspring after prenatal inflammation exposure (right). Data are mean ± SEM, n = 4. (* p < 0.05, ** p < 0.01, *** p < 0.001 vs. NS + CSF group; # p < 0.05, ## p < 0.01 vs. LPS + CSF group; ^ p < 0.05, ^^ p < 0.01, ^^^ p < 0.001 vs. NS + LPS group; @ p < 0.05, @@ p < 0.01 vs. LPS + LPS group).
Figure 5
Figure 5
Western blot analysis of the relative protein contents in the cortex and hippocampus: (a) Western blot analysis of the relative protein contents in the cortex. (b) The expressions of APP, Aβ, COX-2, DP2, and DP1 were detected by Western blotting using specific antibodies in the cortex of rats. Protein contents were plotted for NS + CSF, LPS + CSF, NS + LPS, LPS + LPS, LPS + CSF + MXC, NS + LPS + MXC, and LPS + LPS + MXC. For APP, Aβ, COX-2, DP2, and DP1 proteins, the relative optical density was normalized to β-actin. Each result of the NS group is normalized to 1. (c) Western blot analysis of the relative protein contents in the hippocampus. (d) The expressions of APP, Aβ, COX-2, DP2, and DP1 were detected by Western blotting using specific antibodies in the hippocampus of rats. Protein contents were plotted for the NS + CSF, LPS + CSF, NS + LPS, LPS + LPS, LPS + CSF + MXC, NS + LPS + MXC, and LPS + LPS + MXC groups. For APP, Aβ, COX-2, DP2, and DP1 proteins, the relative optical density was normalized to β-actin. Each result of the NS group is normalized to 1. Data are mean ± SEM, n = 4. (* p < 0.05, ** p < 0.01, *** p < 0.001 vs. NS + CSF group; # p < 0.05, ## p < 0.01 vs. LPS + CSF group; ^ p < 0.05, ^^ p < 0.01 vs. NS + LPS group; @ p < 0.05, @@ p < 0.01 vs. LPS + LPS group).
Figure 6
Figure 6
(a) Primary cultured and identification of neurons. (b,c) The effect of LPS on primary neurons. With the incremental concentration of LPS (12/24 h), the severe damage has been caused, and we also chose 1 ug/mL for the establishment of the damage model. (d) The change of LDH leakage rate intervened with LPS. (e) Meloxicam safety assessment. (f) BW245C safety assessment. (g) BWA868C safety assessment. (h) DK-PGD2 safety assessment. (i) AZD1981 safety assessment. Data is mean ± SEM, n = 6. (* p < 0.05, ** p < 0.01 vs. NS group).
Figure 7
Figure 7
Effect of MXC on the neuron viability and the LDH leakage rate in LPS-treated primary cultured neurons of offspring from prenatal inflammation exposure: (a) Effect of MXC on the survival rate in LPS-treated neurons. (b) Effect of MXC on the LDH leakage rate in LPS-treated neurons. (c) Effect of MXC on the survival rate of LPS-treated primary neurons of offspring from prenatal inflammation exposure. (d) Effect of MXC on the LDH leakage rate in LPS-treated primary neurons of offspring from prenatal inflammation exposure. Data are mean ± SEM, n = 6. (** p < 0.01, *** p < 0.001 vs. NS group; # p < 0.05, ## p < 0.01 vs. LPS group; ^ p < 0.05, ^^ p < 0.01 vs. NS + LPS group; @@ p < 0.01 vs. LPS + LPS group).
Figure 8
Figure 8
Effect of MXC on inflammatory response protein expressions and oxidative stress in LPS-treated primary neurons of offspring from prenatal inflammation exposure: (a) The levels of IL-1β, IL-6, PGD-2, and TNF-α in the primary cultured neurons (n = 6). (b,c) Western blots analysis of the relative protein contents in the primary cultured neurons. (b) The expression of APP, Aβ, COX-2, DP2, and DP1 was detected by Western blotting using specific antibodies in the primary neurons of rats; protein contents were plotted for NS + CSF, LPS + CSF, NS + LPS, LPS + LPS, LPS + CSF. MXC, NS + LPS + MXC, LPS + LPS + MXC. (c) The relative optical density was normalized to β-actin; Each result of the NS group is normalized to 1. (d,e) Effect of MXC on the levels of MDA and the activity of SOD in LPS-treated primary neurons of offspring after inflammation during pregnancy. (d) and the levels of MDA. (e) The activity of SOD. Data are mean ± SEM, n = 4. (* p < 0.05, ** p < 0.01, *** p < 0.001 vs. NS group, # p < 0.05, ## p < 0.01 vs. LPS group, ^ p < 0.05, ^^ p < 0.01 vs. NS + LPS group, @ p < 0.05, @@ p < 0.01 vs. LPS + LPS group).
Figure 9
Figure 9
Effect of DP agonist or antagonist on the neuron viability and the LDH leakage in LPS-treated primary neurons of offspring from prenatal inflammation exposure: (a) Effect of DP agonists and antagonists on the changes of neuronal viability caused by LPS detected by the method of MTT. (b) The change of the LDH leakage rate intervened with the DP agonists and antagonists. (c) Change of neuronal viability intervened with the DP agonists and antagonists in each group. (d) The change of LDH leakage rate intervened with the DP agonists and antagonists in each group. Data are mean ± SEM, n = 6. (* p < 0.05, ** p < 0.01, *** p < 0.001 vs. NS group, # p < 0.05, ## p < 0.01, ### p < 0.001 vs. LPS group, ^ p < 0.05, ^^ p < 0.01 vs. NS + LPS group, @ p < 0.05, @@ p < 0.01 vs. LPS + LPS group).
Figure 9
Figure 9
Effect of DP agonist or antagonist on the neuron viability and the LDH leakage in LPS-treated primary neurons of offspring from prenatal inflammation exposure: (a) Effect of DP agonists and antagonists on the changes of neuronal viability caused by LPS detected by the method of MTT. (b) The change of the LDH leakage rate intervened with the DP agonists and antagonists. (c) Change of neuronal viability intervened with the DP agonists and antagonists in each group. (d) The change of LDH leakage rate intervened with the DP agonists and antagonists in each group. Data are mean ± SEM, n = 6. (* p < 0.05, ** p < 0.01, *** p < 0.001 vs. NS group, # p < 0.05, ## p < 0.01, ### p < 0.001 vs. LPS group, ^ p < 0.05, ^^ p < 0.01 vs. NS + LPS group, @ p < 0.05, @@ p < 0.01 vs. LPS + LPS group).
Figure 10
Figure 10
Determination of apoptosis cells with flow cytometry.

Similar articles

Cited by

References

    1. Sanchez P.E., Zhu L., Verret L., Vossel K.A., Orr A.G., Cirrito J.R., Devidze N., Ho K., Yu G.-Q., Palop J.J., et al. Levetiracetam suppresses neuronal network dysfunction and reverses synaptic and cognitive deficits in an Alzheimer’s disease model. Proc. Natl. Acad. Sci. USA. 2012;109:E2895–E2903. doi: 10.1073/pnas.1121081109. - DOI - PMC - PubMed
    1. Lee J.W., Lee Y.K., Yuk D.Y., Choi D.Y., Ban S.B., Oh K.W., Hong J.T. Neuro-inflammation induced by lipopolysaccharide causes cognitive impairment through enhancement of beta-amyloid generation. J. Neuroinflamm. 2008;5:37. doi: 10.1186/1742-2094-5-37. - DOI - PMC - PubMed
    1. Doens D., Fernández P.L. Microglia receptors and their implications in the response to amyloid β for Alzheimer’s disease pathogenesis. J. Neuroinflamm. 2014;11:48. doi: 10.1186/1742-2094-11-48. - DOI - PMC - PubMed
    1. Oprica M., Hjorth E., Spulber S., Popescu B.O., Ankarcrona M., Winblad B., Schultzberg M. Studies on brain volume, Alzheimer-related proteins and cytokines in mice with chronic overexpression of IL-1 receptor antagonist. J. Cell. Mol. Med. 2007;11:810–825. doi: 10.1111/j.1582-4934.2007.00074.x. - DOI - PMC - PubMed
    1. Lambert J.C., Heath S., Even G., Campion D., Sleegers K., Hiltunen M., Combarros O., Zelenika D., Bullido M.J., Tavernier B., et al. Genome-wide association study identifies variants at CLU and CR1 associated with Alzheimer’s disease. Nat. Genet. 2009;41:1094–1099. doi: 10.1038/ng.439. - DOI - PubMed