. 2022 May 31;23(11):6169.
doi: 10.3390/ijms23116169.

Social Isolation Stress Modulates Pregnancy Outcomes and the Inflammatory Profile of Rat Uterus

Affiliations

Social Isolation Stress Modulates Pregnancy Outcomes and the Inflammatory Profile of Rat Uterus

Nayara A Lopes et al. Int J Mol Sci. .

Abstract

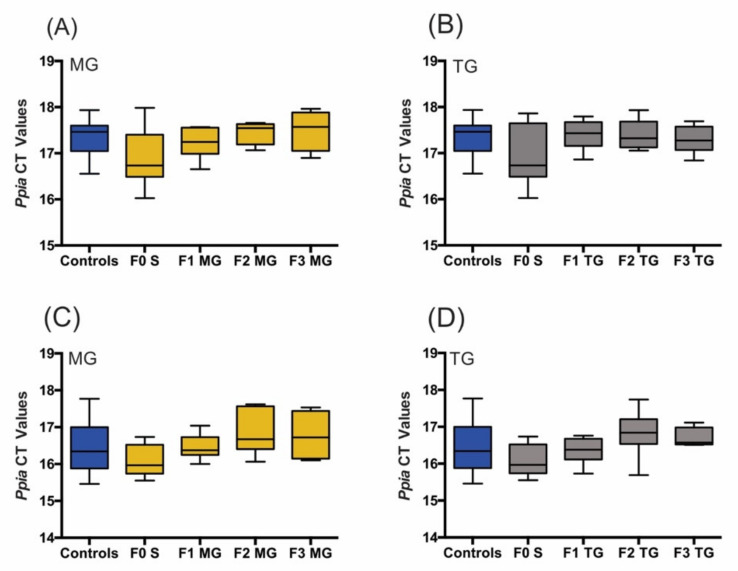
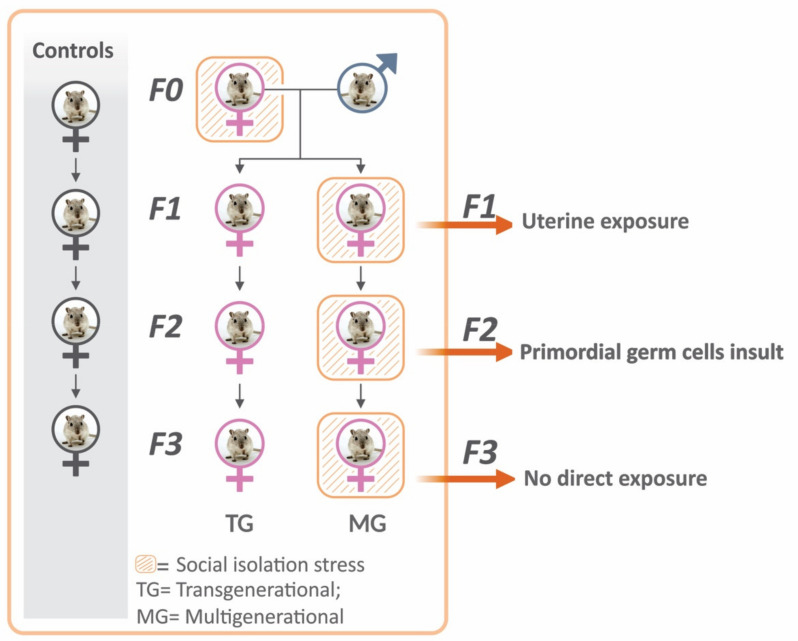
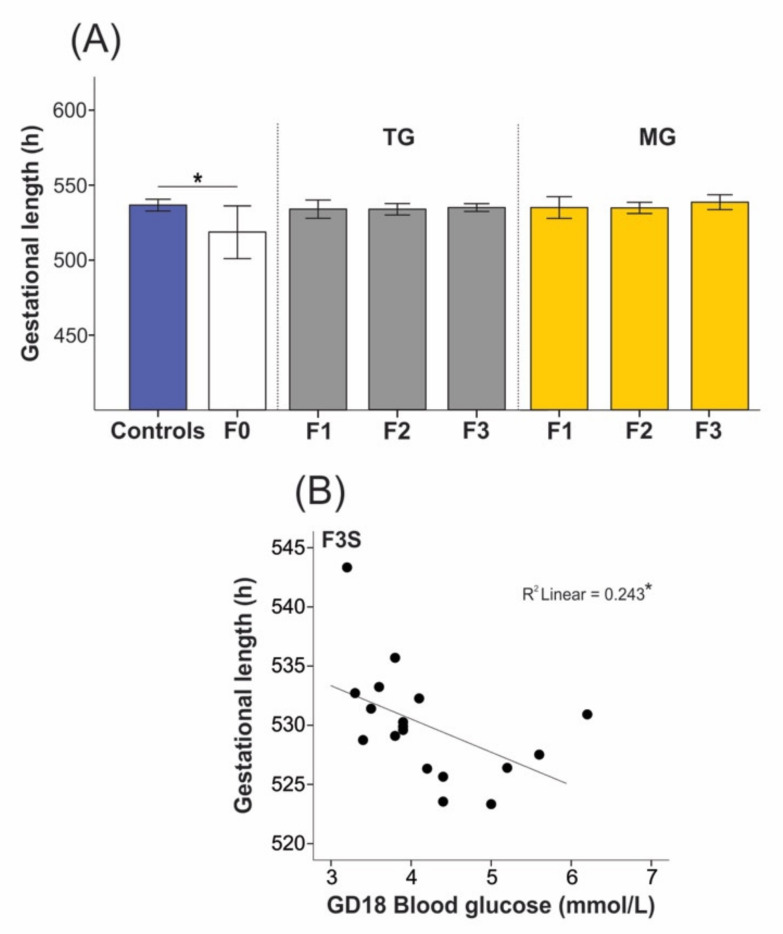
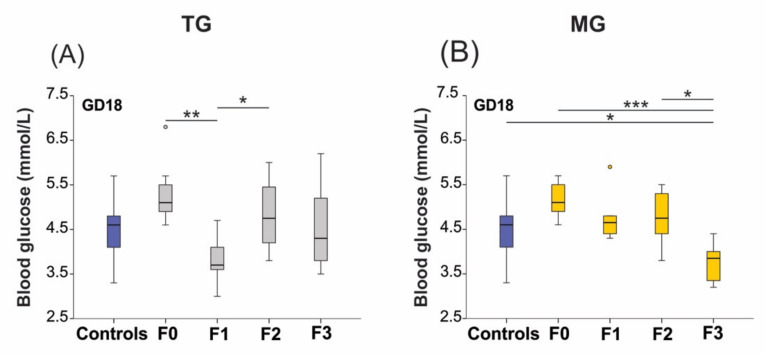
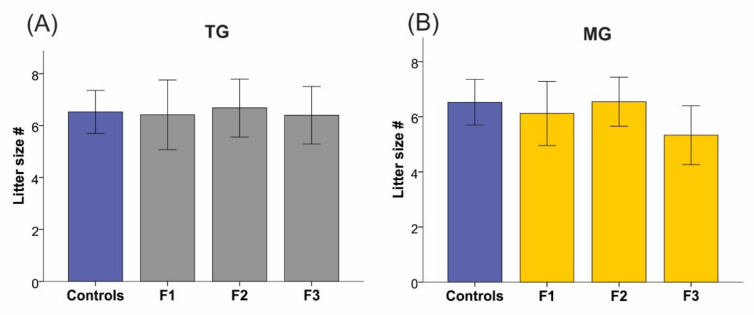
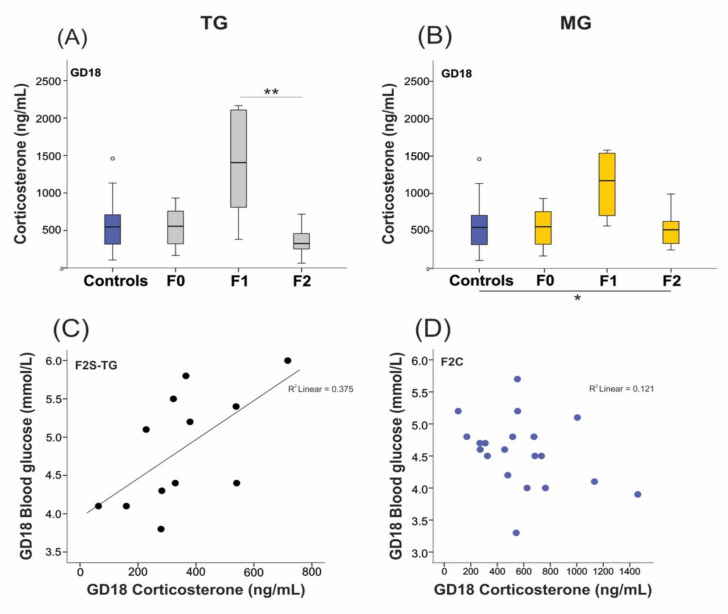
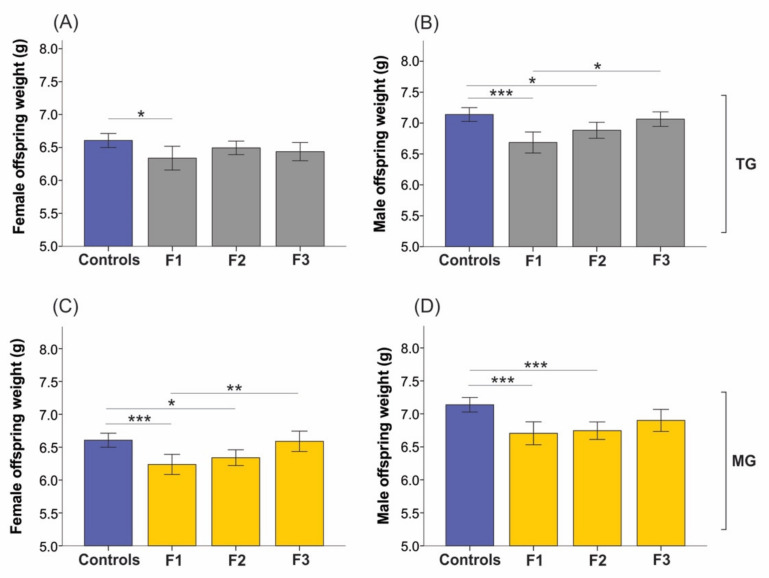
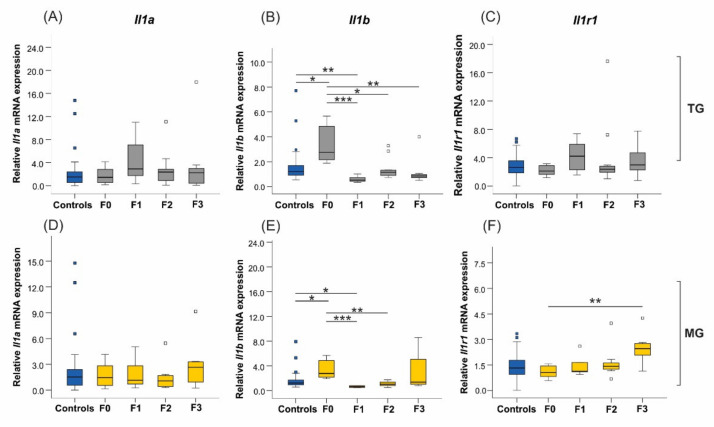
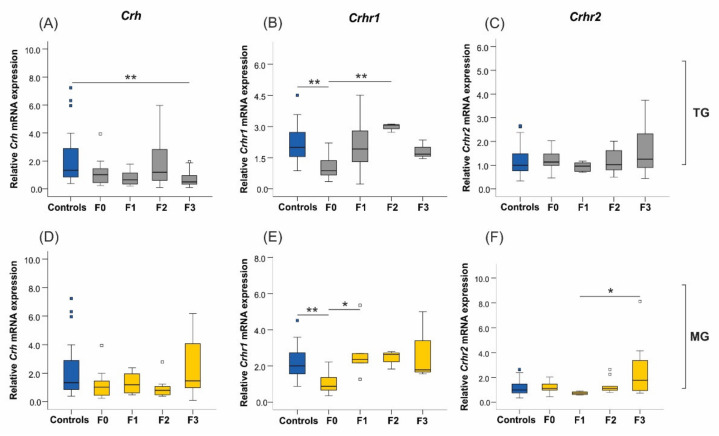
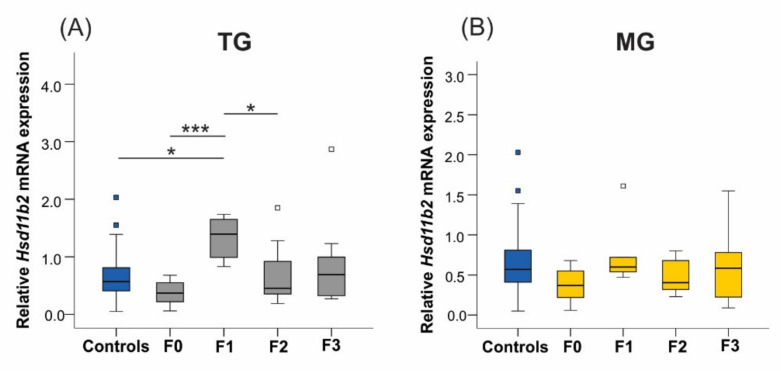
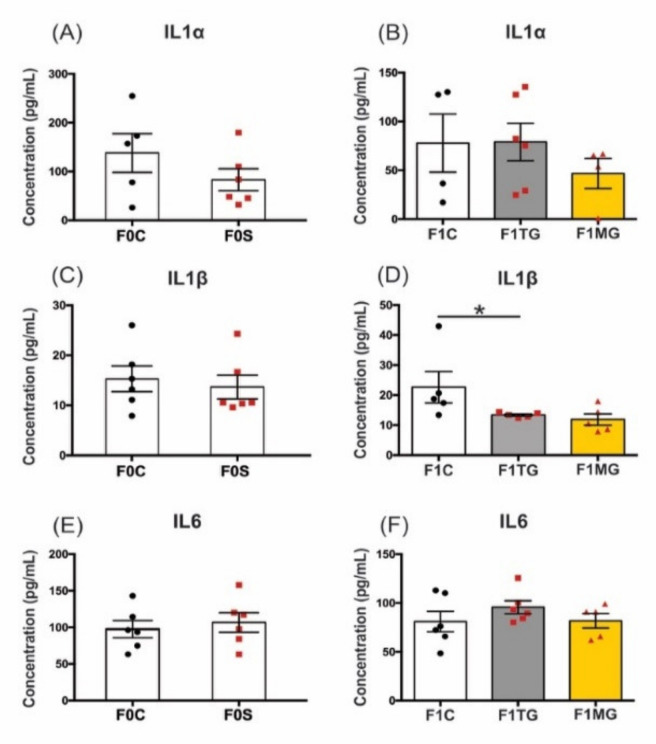
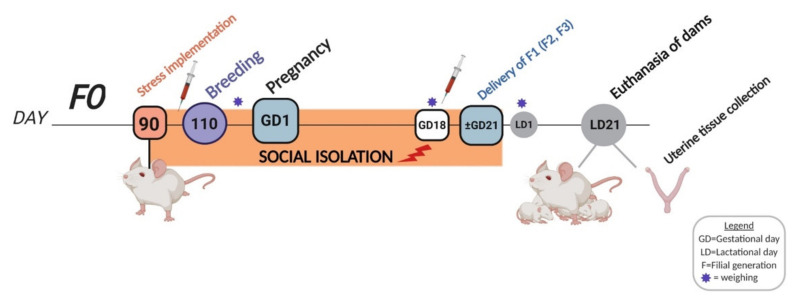
Prenatal stressors have been linked to adverse pregnancy outcomes; including preterm birth (PTB). Recent work demonstrates that social isolation in mothers represents a silent stressor contributing to PTB risk. Here; we investigate the association of inflammatory and stress markers with PTB risk in Long-Evans rats exposed to social isolation stress (SIS) during preconception and pregnancy across four generations (F0-F3). Gestational length; blood glucose; corticosterone levels; and maternal and offspring weights were assessed in two SIS paradigms: transgenerational (TG) and multigenerational (MG) exposure. Maternal uterine tissues were collected 21 days after the dams gave birth. Exposure to SIS reduced pregnancy lengths in the parental generation and neonatal birth weights in the F1 and F2 generations. Interleukin (IL)-1β (Il1b) mRNA levels increased in F0 animals but decreased in the offspring of both stress lineages. Protein levels of IL-1β decreased in the TG lineage. Corticotrophin-releasing hormone receptor 1 (Crhr1) expression decreased in SIS-exposed F0 animals and increased in the TG-F2 and MG-F1 offspring. Expression of enzyme 11-β hydroxysteroid dehydrogenase-2 (11bHSD2) was enhanced in F1 animals. These findings suggest SIS has adverse consequences on the F0 mothers; but their F1-F3 progeny may adapt to this chronic stress; thus supporting the fetal programming hypothesis.

Keywords: fetal programming; gene expression; inflammation; intrauterine growth restriction; pregnancy; prenatal stress; preterm birth; rodents; social isolation; uterus.


Conflict of interest statement

The authors declare no conflict of interest.

Figures

Figure A1
Figure A1
Expression levels of Ppia (CT values). No differences were found between generations and stress protocols (TG and MG) using ordinary one-way ANOVA. (A,B) Batch 1; (C,D) Batch 2. N numbers: Controls n = 20–31; F0 n = 8–10; F1 n = 5–8, F2 + F3 n = 4–12. Mean ± SEM.
Figure 1
Figure 1
Social isolation stress design. Flow chart illustrating the SIS experimental design. F0 rats were subjected to SIS, and their filial generation F1 was split into TG and MG groups. In the TG group, stress was only implemented in the parental F0 generation, while each parental and offspring generation was exposed in the MG group. F0–F3 generations of non-stressed rats served as controls. In the TG lineage, exposing the gestating female F0 generation to SIS implies that only the F1 fetuses experience direct uterine exposure to stress, and the F2 generation’s exposure to stress is through their mother’s primordial germ cells (F1 generation’s germ cells). Therefore, the F3 generation of the TG lineage is the first unexposed generation, considered a true transgenerational inheritance. In the MG lineage, all generations of offspring experience both direct and cumulative uterine exposure to stress through the maternal primordial germ cells. TG = transgenerational; MG = multigenerational; F = filial generation.
Figure 2
Figure 2
Social isolation stress significantly reduced gestational length of the F0 dams but did not impact the offspring’s pregnancy duration. (A) Gestational length recordings demonstrated shorter gestation in the parental generation F0, while no changes were seen in the TG or MG offspring. (B) For the F3 generation animals of both TG and MG groups, higher blood glucose levels were associated with shorter gestation in F3 stressed animals on gestational day (GD)18. Asterisks indicate significance: * p < 0.05. Controls n = 20–28; F0 n = 10–11; F1 n = 6–8, F2 n = 10–12; F3 n = 8–11. Mean ± SEM. Independent t-test was used to assess gestational length between controls and F0 animals, while Kruskal–Wallis was used to evaluate differences in pregnancy duration between the offspring and controls. TG refers to transgenerational and MG to multigenerational stress.
Figure 3
Figure 3
Blood glucose levels decreased on GD18 in the offspring of animals exposed to social isolation prenatal stress. (A) Blood glucose levels significantly decreased in F1 animals of the TG group (A) and the F3 generation of the MG group (B) on GD18. Asterisks indicate significance: * p < 0.05; ** p < 0.01; *** p < 0.001. Controls n = 20–28; F0 n = 10–11; F1 n = 6–8, F2 n = 10–12; F3 n = 8–11. Box plots mid-lines indicate medians, whiskers indicate min-max values, and boxes indicate interquartile ranges.
Figure 4
Figure 4
Litter sizes remained unchanged. Litter sizes of dams exposed to SIS did not change in the TG (A) and MG (B) groups. Controls n = 18; F1 n = 6–8, F2 n = 11; F3 n = 9–10. Mean ± SEM.
Figure 5
Figure 5
Elevated plasma corticosterone (CORT) levels in F1 animals of TG and MG stress groups. CORT levels were significantly elevated in the F1 dams of the TG (A) and MG (B) groups on GD18 but returned to baseline levels in the F2 generation. (C) Higher CORT levels on GD18 were associated with increased blood glucose levels in the F2 generation of the TG group. (D) No correlation was found between CORT and glucose levels in F2 controls. Asterisks indicate significance: * p < 0.05; ** p < 0.01. Controls n = 20–28; F0 n = 10–11; F1 n = 6–8, F2 n = 10–12. Box plots mid-lines indicate medians, whiskers indicate min-max values, and boxes indicate interquartile ranges.
Figure 6
Figure 6
The birth weights of F1 females and males from both SIS lineages were significantly decreased. Birth weights of F1 female (A) and F1 and F2 male (B) neonates significantly decreased in the TG stress group. (B) Yet, F3 TG-stressed males were heavier than F1 male pups. (C) Females from the MG group displayed significantly reduced weight on postnatal day (P)1 in the F1 and F2 generations, while F3 females were heavier than F1 stressed animals. (D) F1 and F2 MG–stressed males were significantly lighter than controls on P1. Asterisks indicate significance: * p < 0.05; ** p < 0.01; *** p < 0.001. Mean ± SEM. Controls n = 115–121; F1 n = 37–50, F2 n = 68–79; F3 n = 47–65 neonates.
Figure 7
Figure 7
The uterine expression of the Il1b proinflammatory cytokine and the Il1r1 receptor was significantly altered across generations in TG and MG stressed animals. Results from TG and MG groups will be presented alongside each other to compare the effects of stress between the two cohorts. (A,D) Expression levels of Il1a were unaffected in both TG and MG groups. (B) The abundance of Il1b doubled in the F0 generation and decreased significantly in F1–F3 offspring. Similarly, (E) MG-stressed rats presented similar Il1b uterine mRNA expression patterns as the TG dams, with significantly increased expression in F0 and a drop in the F1 and F2 generations. The Il1r1 receptor was significantly upregulated in the F3 uteri of the MG group (F), while its expression was unaffected in all generations of the TG group (C). Cyclophilin A (Ppia) was our reference gene. Asterisks indicate significance: * p < 0.05; ** p < 0.01; *** p < 0.001. Controls n = 20–31; F0 n = 8–10; F1 n = 5–8, F2 + F3 n = 4–12. Box plots mid-lines indicate medians, whiskers indicate min-max values, and boxes indicate interquartile ranges.
Figure 8
Figure 8
The uterine expression of Crh and Crhr2 reacted differently in TG and MG lineages, while Crhr1 expression patterns were similar. (A) The mRNA expression of Crh was significantly reduced in the F3 generation of the TG group, (D) yet, no changes were observed in the MG lineage. (B) The Crhr1 expression significantly decreased in F0 animals while its abundance tripled in the TG F2 generation. (E) The same pattern was observed in the MG lineage, where uterine expression of Crhr1 was significantly downregulated in the F0 generation but doubled in the F1 offspring (C). The expression of Crhr2 was unchanged in the TG lineage, while (F) it significantly increased in the F3 animals exposed to cumulative MG stress. Asterisks indicate significance. * p < 0.05; ** p < 0.01. Controls n = 20–31; F0 n = 8–10; F1 n = 5–8, F2 + F3 n = 4–12. Box plots mid-lines indicate medians, whiskers indicate min-max values, and boxes indicate interquartile ranges.
Figure 9
Figure 9
The uterine expression of Hsd11b2 significantly increased in the F1 generation of the TG lineage. (A) The abundance of Hsd11b2 tripled in the daughters’ uteri. (B) Expression levels of Hsd11b2 were unaltered when exposed to MG SIS. Asterisks indicate significance: * p < 0.05; *** p < 0.001. Controls n = 20–31; F0 n = 8–10; F1 n = 5–8, F2 + F3 n = 4–12. Box plots mid-lines indicate medians, whiskers indicate min-max values, and boxes indicate interquartile ranges.
Figure 10
Figure 10
Decreased uterine IL-1β protein concentrations in F1 generation of SIS-exposed dams. (A,B) The levels of IL1α protein were unaltered in F0 and F1 uteri, although they showed a tendency to decrease in the F1 dams of the MG lineage. (C) The IL-1β protein levels in F0 uteri were unchanged, (D) but they significantly decreased in the TG lineage compared to F1 controls. In the MG lineage, IL-1β protein also showed a tendency to decrease its levels but did not reach statistical significance. (E,F) Concentrations of IL-6 were unchanged in both generations and treatment groups. Data are presented as concentration (pg/mL), mean ± SEM. The F0 tissue homogenates were analyzed by independent t-test, whereas F1s were analyzed by ordinary one-way ANOVA with Tukey post-hoc test. Statistical significance: * p < 0.05, n = 4–6.
Figure 11
Figure 11
Social isolation stress timeline illustrating the experimental design and tissue collection. Female rats were exposed to SIS during preconception (days 90–110) and pregnancy (GD1–~21). Syringes depict blood draws once at baseline (between days 90–105) and on GD18, while asterisks illustrate weight measurements. Dams were sacrificed at the weaning of their offspring (LD21) when uterine tissues were collected. GD = gestational day; LD= lactational day; F= filial generation. Created with BioRender.com (accessed on 12 May 2022).

References

    1. Petraglia F., Imperatore A., Challis J.R. Neuroendocrine mechanisms in pregnancy and parturition. Endocr. Rev. 2010;31:783–816. doi: 10.1210/er.2009-0019. - DOI - PubMed
    1. Schumacher A., Costa S.D., Zenclussen A.C. Endocrine factors modulating immune responses in pregnancy. Front. Immunol. 2014;5:196. doi: 10.3389/fimmu.2014.00196. - DOI - PMC - PubMed
    1. Coussons-Read M.E. Effects of prenatal stress on pregnancy and human development: Mechanisms and pathways. Obstet. Med. 2013;6:52–57. doi: 10.1177/1753495x12473751. - DOI - PMC - PubMed
    1. McGowan P.O., Matthews S.G. Prenatal Stress, Glucocorticoids, and Developmental Programming of the Stress Response. Endocrinology. 2018;159:69–82. doi: 10.1210/en.2017-00896. - DOI - PubMed
    1. Entringer S., Kumsta R., Nelson E.L., Hellhammer D.H., Wadhwa P.D., Wüst S. Influence of prenatal psychosocial stress on cytokine production in adult women. Dev. Psychobiol. 2008;50:579–587. doi: 10.1002/dev.20316. - DOI - PMC - PubMed

LinkOut - more resources