Function of Graphene Oxide as the "Nanoquencher" for Hg2+ Detection Using an Exonuclease I-Assisted Biosensor
- PMID: 35683005
- PMCID: PMC9180964
- DOI: 10.3390/ijms23116326
Function of Graphene Oxide as the "Nanoquencher" for Hg2+ Detection Using an Exonuclease I-Assisted Biosensor
Abstract
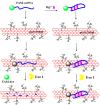
Graphene oxide is well known for its excellent fluorescence quenching ability. In this study, positively charged graphene oxide (pGO25000) was developed as a fluorescence quencher that is water-soluble and synthesized by grafting polyetherimide onto graphene oxide nanosheets by a carbodiimide reaction. Compared to graphene oxide, the fluorescence quenching ability of pGO25000 is significantly improved by the increase in the affinity between pGO25000 and the DNA strand, which is introduced by the additional electrostatic interaction. The FAM-labeled single-stranded DNA probe can be almost completely quenched at concentrations of pGO25000 as low as 0.1 μg/mL. A simple and novel FAM-labeled single-stranded DNA sensor was designed for Hg2+ detection to take advantage of exonuclease I-triggered single-stranded DNA hydrolysis, and pGO25000 acted as a fluorescence quencher. The FAM-labeled single-stranded DNA probe is present as a hairpin structure by the formation of T-Hg2+-T when Hg2+ is present, and no fluorescence is observed. It is digested by exonuclease I without Hg2+, and fluorescence is recovered. The fluorescence intensity of the proposed biosensor was positively correlated with the Hg2+ concentration in the range of 0-250 nM (R2 = 0.9955), with a seasonable limit of detection (3σ) cal. 3.93 nM. It was successfully applied to real samples of pond water for Hg2+ detection, obtaining a recovery rate from 99.6% to 101.1%.
Keywords: T–Hg2+–T; exonuclease I; fluorescence quencher; hairpin structure; positively charged graphene oxide (pGO).
Conflict of interest statement
The authors declare no conflict of interest.
Figures


Similar articles
-
Fluorometric determination of mercury(II) via a graphene oxide-based assay using exonuclease III-assisted signal amplification and thymidine-Hg(II)-thymidine interaction.Mikrochim Acta. 2019 Mar 5;186(4):216. doi: 10.1007/s00604-019-3332-x. Mikrochim Acta. 2019. PMID: 30838468
-
Ultrasensitive fluorometric biosensor based on Ti3C2 MXenes with Hg2+-triggered exonuclease III-assisted recycling amplification.Analyst. 2021 Apr 26;146(8):2664-2669. doi: 10.1039/d1an00178g. Analyst. 2021. PMID: 33662087
-
Polydopamine nanotube mediated fluorescent biosensor for Hg(ii) determination through exonuclease III-assisted signal amplification.Analyst. 2018 May 29;143(11):2623-2631. doi: 10.1039/c8an00377g. Analyst. 2018. PMID: 29748683
-
Graphene oxide-based amplified fluorescent biosensor for Hg(2+) detection through hybridization chain reactions.Anal Chem. 2014 Mar 18;86(6):3209-15. doi: 10.1021/ac500192r. Epub 2014 Mar 5. Anal Chem. 2014. PMID: 24564628
-
Mercury (II) sensing using a simple turn-on fluorescent graphene oxide based aptasensor in serum and water samples.Spectrochim Acta A Mol Biomol Spectrosc. 2024 May 15;313:124057. doi: 10.1016/j.saa.2024.124057. Epub 2024 Feb 22. Spectrochim Acta A Mol Biomol Spectrosc. 2024. PMID: 38457872
Cited by
-
Recent Advances in the Application of Bionanosensors for the Analysis of Heavy Metals in Aquatic Environments.Molecules. 2023 Dec 20;29(1):34. doi: 10.3390/molecules29010034. Molecules. 2023. PMID: 38202619 Free PMC article. Review.
-
Fluorescence 'turn-on' sensing of glial fibrillary acidic protein using graphene oxide-quenched copper nanoclusters.Mikrochim Acta. 2025 Mar 26;192(4):260. doi: 10.1007/s00604-025-07103-2. Mikrochim Acta. 2025. PMID: 40140017
-
Carbon-Based Nanomaterials 3.0.Int J Mol Sci. 2022 Aug 18;23(16):9321. doi: 10.3390/ijms23169321. Int J Mol Sci. 2022. PMID: 36012582 Free PMC article.
-
DNA Sensors for the Detection of Mercury Ions.Biosensors (Basel). 2025 Apr 29;15(5):275. doi: 10.3390/bios15050275. Biosensors (Basel). 2025. PMID: 40422014 Free PMC article. Review.
References
-
- Duan J.L., Zhan J.H. Recent developments on nanomaterials-based optical sensors for Hg2+ detection. Sci. China-Mater. 2015;58:223–240. doi: 10.1007/s40843-015-0031-8. - DOI
-
- Covaci E., Senila M., Tanaselia C., Angyus S.B., Ponta M., Darvasi E., Frentiu M., Frentiu T. A highly sensitive eco-scale method for mercury determination in water and food using photochemical vapor generation and miniaturized instrumentation for capacitively coupled plasma microtorch optical emission spectrometry. J. Anal. At. Spectrom. 2018;33:799–808. doi: 10.1039/C8JA00054A. - DOI
-
- Baika L.M., Dos Santos E.J., Herrmann A.B., Grassi M.T. Simultaneous determination of As, Hg, Sb, and Se in mineral fertilizers using ultrasonic extraction and CVG-ICP OES. Anal. Methods. 2016;8:8362–8367. doi: 10.1039/C6AY02687G. - DOI
MeSH terms
Substances
Grants and funding
LinkOut - more resources
Full Text Sources
Medical

