

Objective Methods of 5-Aminolevulinic Acid-Based Endoscopic Photodynamic Diagnosis Using Artificial Intelligence for Identification of Gastric Tumors
- PMID: 35683417
- PMCID: PMC9181250
- DOI: 10.3390/jcm11113030
Objective Methods of 5-Aminolevulinic Acid-Based Endoscopic Photodynamic Diagnosis Using Artificial Intelligence for Identification of Gastric Tumors
Abstract
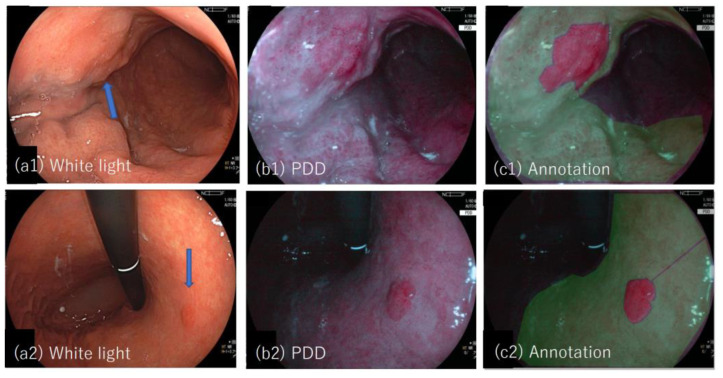
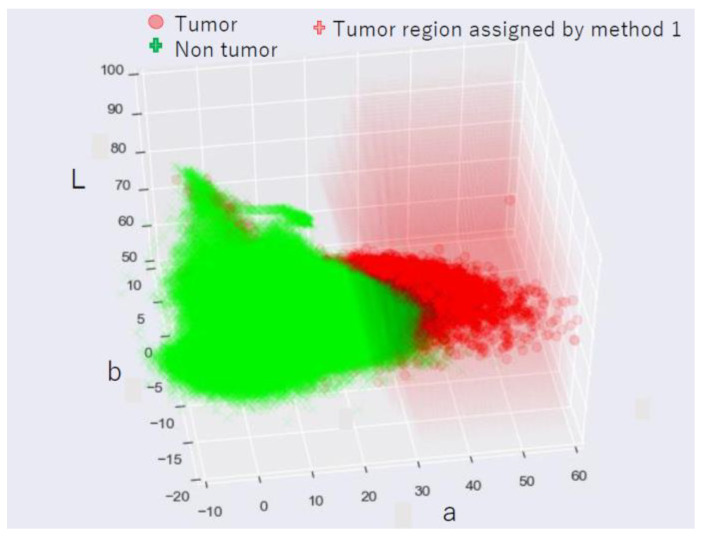
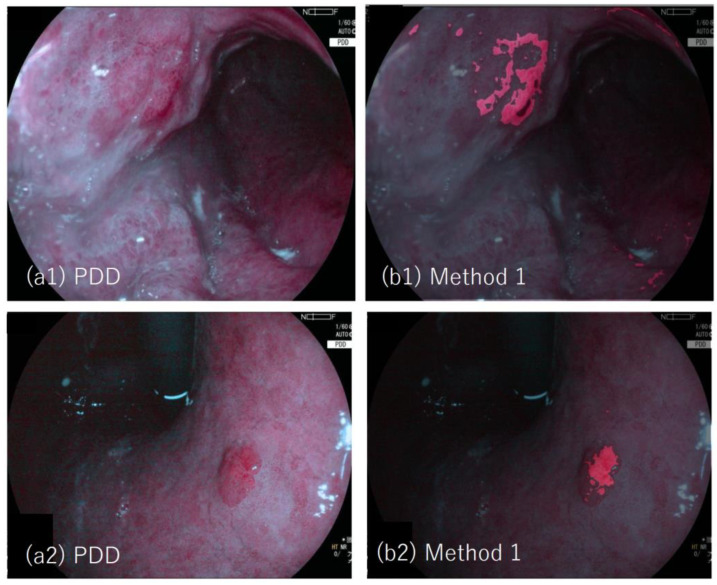
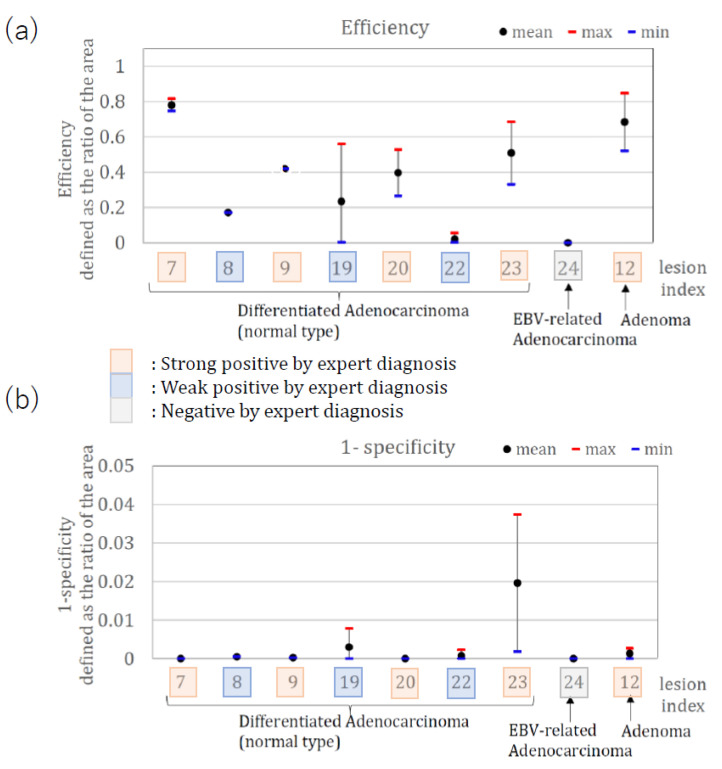
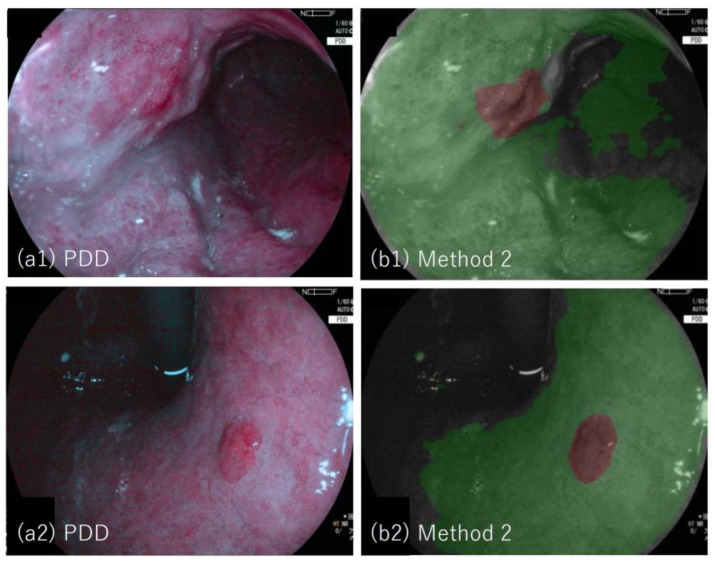
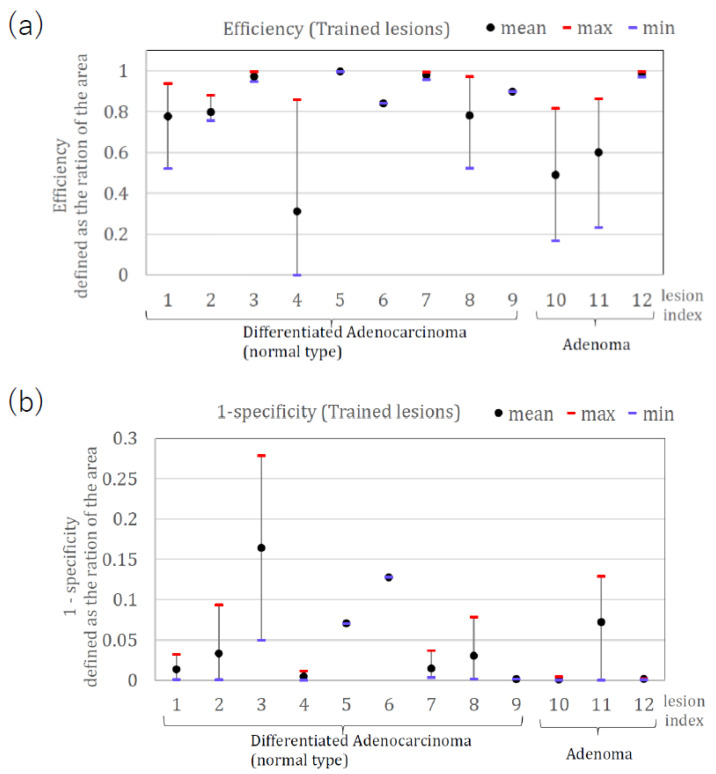
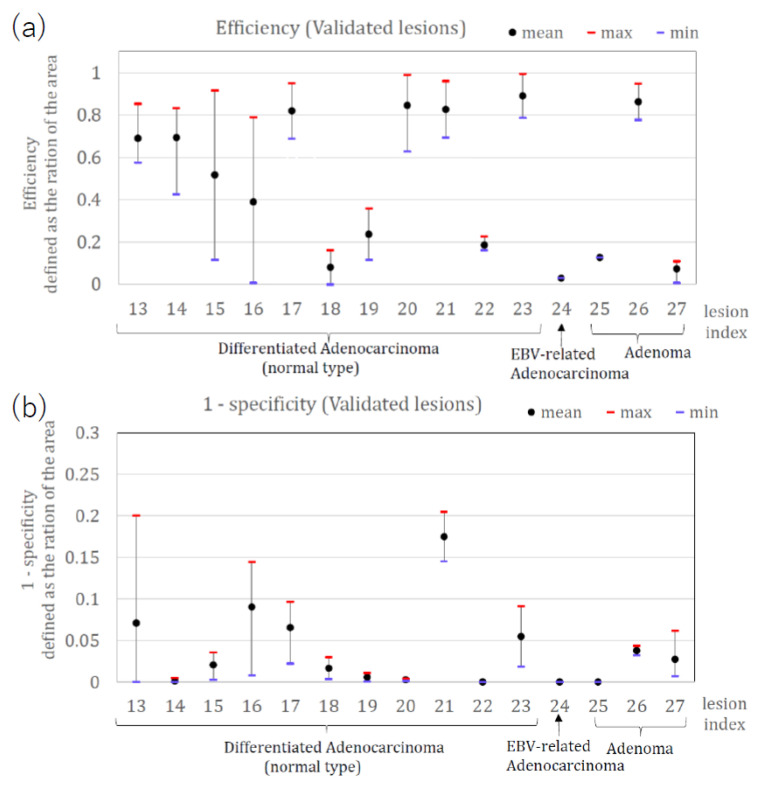
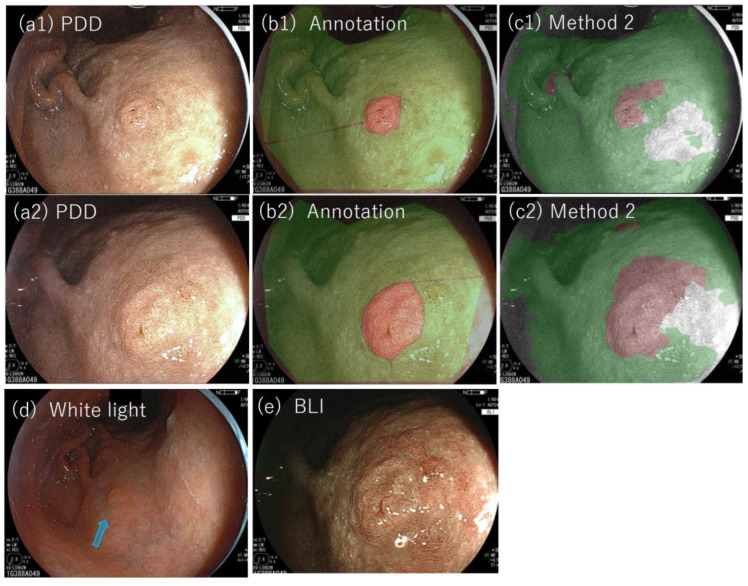
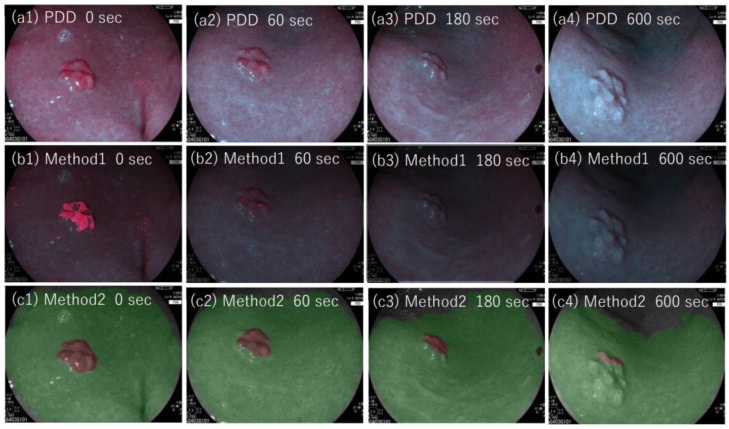
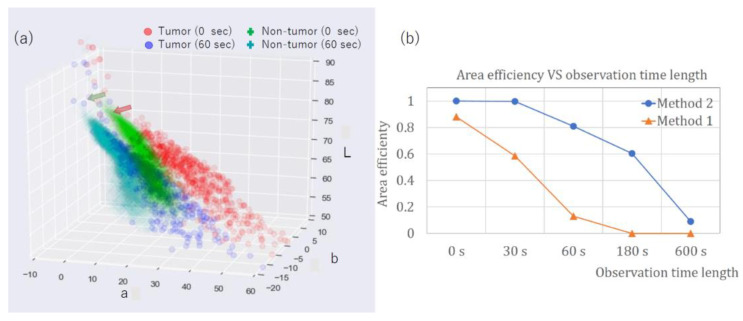
Positive diagnoses of gastric tumors from photodynamic diagnosis (PDD) images after the administration of 5-aminolevulinic acid are subjectively identified by expert endoscopists. Objective methods of tumor identification are needed to reduce potential misidentifications. We developed two methods to identify gastric tumors from PDD images. Method one was applied to segmented regions in the PDD endoscopic image to determine the region in LAB color space to be attributed to tumors using a multi-layer neural network. Method two aimed to diagnose tumors and determine regions in the PDD endoscopic image attributed to tumors using the convoluted neural network method. The efficiencies of diagnosing tumors were 77.8% (7/9) and 93.3% (14/15) for method one and method two, respectively. The efficiencies of determining tumor region defined as the ratio of the area were 35.7% (0.0-78.0) and 48.5% (3.0-89.1) for method one and method two, respectively. False-positive rates defined as the ratio of the area were 0.3% (0.0-2.0) and 3.8% (0.0-17.4) for method one and method two, respectively. Objective methods of determining tumor region in 5-aminolevulinic acid-based endoscopic PDD were developed by identifying regions in LAB color space attributed to tumors or by applying a method of convoluted neural network.
Keywords: 5-aminolevulinic acid; LAB color space; neural network; photodynamic diagnosis.
Conflict of interest statement
Isomoto, H. is a guest editor of the JCM special issue of “Latest Advances in Endoscopic Imaging and Therapy”. Other authors declare no conflict of interest.
Figures
Similar articles
-
Objective tumor distinction in 5-aminolevulinic acid-based endoscopic photodynamic diagnosis, using a spectrometer with a liquid crystal tunable filter.Ann Transl Med. 2020 Mar;8(5):178. doi: 10.21037/atm.2020.01.108. Ann Transl Med. 2020. PMID: 32309325 Free PMC article.
-
In vivo fluorescence navigation of gastric and upper gastrointestinal tumors by 5-aminolevulinic acid mediated photodynamic diagnosis with a laser-equipped video image endoscope.Photodiagnosis Photodyn Ther. 2015 Jun;12(2):201-8. doi: 10.1016/j.pdpdt.2015.03.006. Epub 2015 Mar 31. Photodiagnosis Photodyn Ther. 2015. PMID: 25840141
-
Preliminary study of photodynamic diagnosis using 5-aminolevulinic acid in gastric and colorectal tumors.World J Gastroenterol. 2015 Jun 7;21(21):6706-12. doi: 10.3748/wjg.v21.i21.6706. World J Gastroenterol. 2015. PMID: 26074709 Free PMC article.
-
Evolution of photodynamic medicine based on fluorescence image-guided diagnosis using indocyanine green and 5-aminolevulinic acid.Surg Today. 2020 Aug;50(8):821-831. doi: 10.1007/s00595-019-01851-4. Epub 2019 Jul 25. Surg Today. 2020. PMID: 31346808 Review.
-
Critical role of ABCG2 in ALA-photodynamic diagnosis and therapy of human brain tumor.Adv Cancer Res. 2015;125:197-216. doi: 10.1016/bs.acr.2014.11.008. Epub 2015 Jan 8. Adv Cancer Res. 2015. PMID: 25640271 Review.
References
-
- Yagi K., Nakamura A., Sekine A., Umezu H. Magnifying endoscopy with narrow band imaging for early differentiated gastric adenocarcinoma. Dig. Endosc. 2008;20:115–122. doi: 10.1111/j.1443-1661.2008.00788.x. - DOI
-
- Kaise M., Kato M., Urashima M., Arai Y., Kaneyama H., Kanzazawa Y., Yonezawa J., Yoshida Y., Yoshimura N., Yamasaki T., et al. Magnifying endoscopy combined with narrow-band imaging for differential diagnosis of superficial depressed gastric lesions. Endoscopy. 2009;41:310–315. doi: 10.1055/s-0028-1119639. - DOI - PubMed
LinkOut - more resources
Full Text Sources
Miscellaneous
