

Effects of Higher Normal Blood Pressure on Brain Are Detectable before Middle-Age and Differ by Sex
- PMID: 35683516
- PMCID: PMC9181456
- DOI: 10.3390/jcm11113127
Effects of Higher Normal Blood Pressure on Brain Are Detectable before Middle-Age and Differ by Sex
Abstract
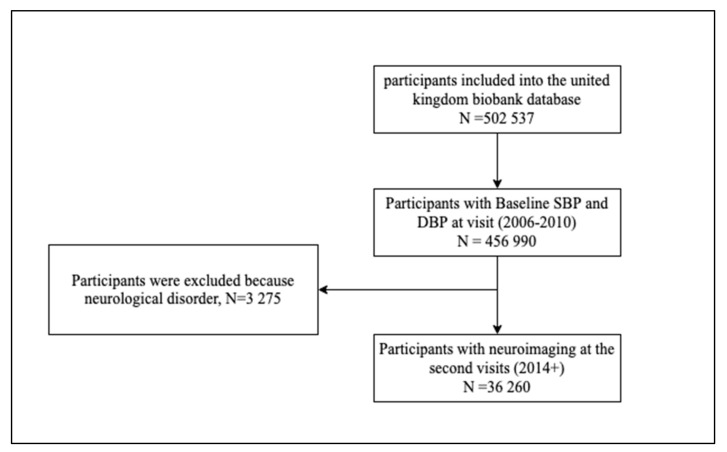
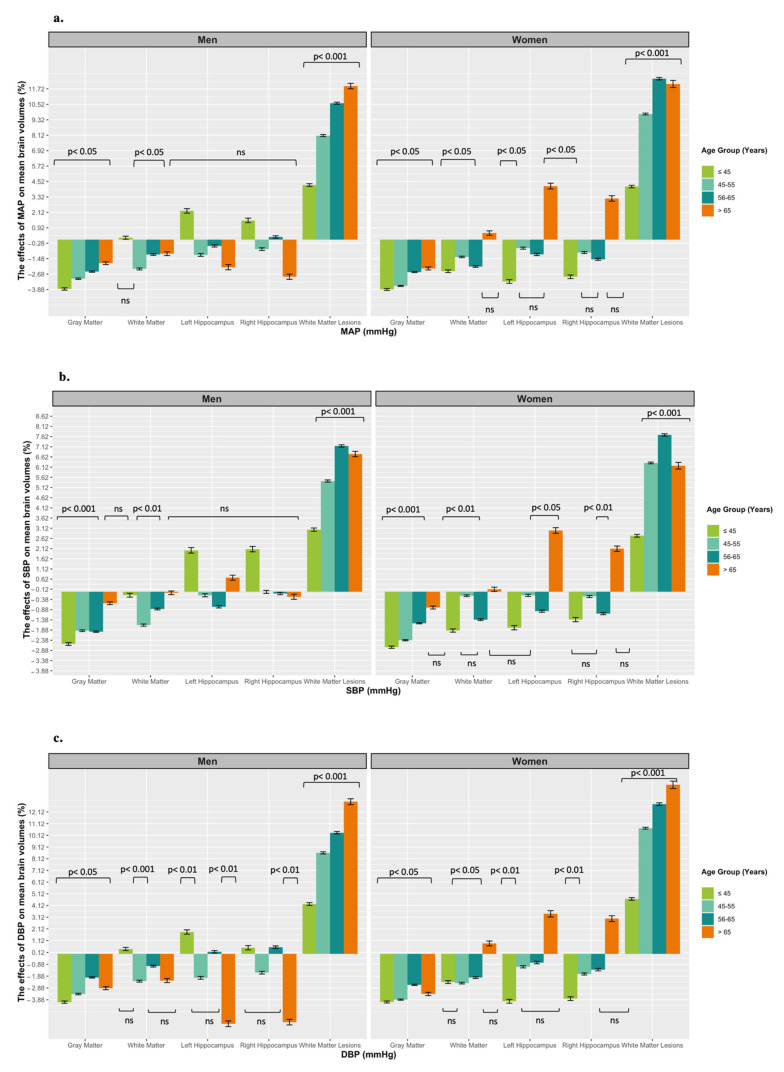
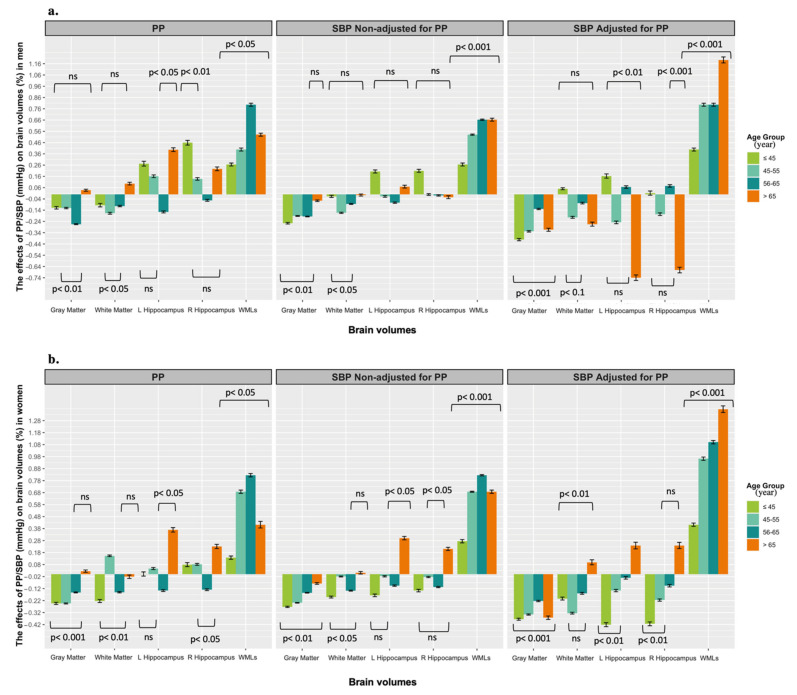
Background: To quantify the association between blood pressure (BP) across its full range, brain volumes and white matter lesions (WMLs) while investigating the effects of age, sex, body mass index (BMI), and antihypertensive medication. Methods: UK Biobank participants (n = 36,260) aged (40−70) years were included and stratified by sex and four age groups (age ≤ 45, 46−55, 56−65 and > 65 years). Multi-level regression analyses were used to assess the association between mean arterial pressure (MAP), systolic BP (SBP), diastolic BP (DBP), and brain volumes segmented using the FreeSufer software (gray matter volume [GMV], white matter volume [WMV], left [LHCV] and right hippocampal volume [RHCV]) and WMLs. Interaction effects between body mass index (BMI), antihypertensive medication and BP in predicting brain volumes and WMLs were also investigated. Results: Every 10 mmHg higher DBP was associated with lower brain volumes (GMV: −0.19%−−0.40%) [SE = 47.7−62.4]; WMV: −0.20−−0.23% [SE = 34.66−53.03]; LHCV: −0.40−−0.59% [SE = 0.44−0.57]; RHCV: −0.17−−0.57% [SE = 0.32−0.95]) across all age groups. A similar pattern was detected in both sexes, although it was weaker in men. Every 10 mmHg higher MAP was associated with larger WMLs across all age groups but peaked >65 years (1.19−1.23% [SE = 0.002]). Both lower BMI and anti-hypertensive medication appeared to afford a protective effect. Conclusion: Higher BP is associated with worse cerebral health across the full BP range from middle adulthood and into old age.
Keywords: age; blood pressure; neuroimaging; sex.
Conflict of interest statement
The authors declare no conflict of interest.
Figures
Similar articles
-
Dietary magnesium intake is related to larger brain volumes and lower white matter lesions with notable sex differences.Eur J Nutr. 2023 Aug;62(5):2039-2051. doi: 10.1007/s00394-023-03123-x. Epub 2023 Mar 10. Eur J Nutr. 2023. PMID: 36899275 Free PMC article.
-
Major risk factors for the appearance of white-matter lesions on MRI in hypertensive patients with controlled blood pressure.Vasc Health Risk Manag. 2012;8:169-76. doi: 10.2147/VHRM.S30507. Epub 2012 Mar 14. Vasc Health Risk Manag. 2012. PMID: 22454561 Free PMC article.
-
Higher Blood Pressure is Associated with Greater White Matter Lesions and Brain Atrophy: A Systematic Review with Meta-Analysis.J Clin Med. 2021 Feb 7;10(4):637. doi: 10.3390/jcm10040637. J Clin Med. 2021. PMID: 33562359 Free PMC article. Review.
-
Association of Early Adulthood 25-Year Blood Pressure Trajectories With Cerebral Lesions and Brain Structure in Midlife.JAMA Netw Open. 2022 Mar 1;5(3):e221175. doi: 10.1001/jamanetworkopen.2022.1175. JAMA Netw Open. 2022. PMID: 35267035 Free PMC article.
-
Effect of alcohol on blood pressure.Cochrane Database Syst Rev. 2020 Jul 1;7(7):CD012787. doi: 10.1002/14651858.CD012787.pub2. Cochrane Database Syst Rev. 2020. PMID: 32609894 Free PMC article.
Cited by
-
Amyloid-β aggregates activate peripheral monocytes in mild cognitive impairment.Nat Commun. 2024 Feb 9;15(1):1224. doi: 10.1038/s41467-024-45627-y. Nat Commun. 2024. PMID: 38336934 Free PMC article.
-
Association between dietary magnesium intake, inflammation, and neurodegeneration.Eur J Nutr. 2024 Aug;63(5):1807-1818. doi: 10.1007/s00394-024-03383-1. Epub 2024 Apr 10. Eur J Nutr. 2024. PMID: 38597977 Free PMC article.
-
Cognitive Function Is Associated with the Genetically Determined Efficiency of DNA Repair Mechanisms.Genes (Basel). 2024 Jan 24;15(2):153. doi: 10.3390/genes15020153. Genes (Basel). 2024. PMID: 38397143 Free PMC article.
-
Risk factors and cognitive correlates of white matter hyperintensities in ethnically diverse populations without dementia: The COSMIC consortium.Alzheimers Dement (Amst). 2024 Mar 13;16(1):e12567. doi: 10.1002/dad2.12567. eCollection 2024 Jan-Mar. Alzheimers Dement (Amst). 2024. PMID: 38487075 Free PMC article.
-
Improving sleep regularity and timing to prevent cognitive decline in older women: in search of evidence for efficacy and sufficiency.Sleep. 2025 Jun 13;48(6):zsaf072. doi: 10.1093/sleep/zsaf072. Sleep. 2025. PMID: 40103220 No abstract available.
References
-
- Population Reference Bureau 2018 World Population Data Sheet with Focus on Changing Age Structures. In PRB Project 2.3 Billion More People Living on Earth by 2050. [(accessed on 25 April 2020)]. Available online: www.worldpopdata.org.
-
- Williamson W., Lewandowski A.J., Forkert N.D., Griffanti L., Okell T.W., Betts J., Boardman H., Siepmann T., McKean D., Huckstep O., et al. Association of Cardiovascular Risk Factors with MRI Indices of Cerebrovascular Structure and Function and White Matter Hyperintensities in Young Adults. JAMA. 2018;320:e665–e673. doi: 10.1001/jama.2018.11498. - DOI - PMC - PubMed
-
- Newman A.B., Fitzpatrick A.L., Lopez O., Jackson S., Lyketsos C., Jagust W., Ives D., DeKosky S.T., Kuller L.H. Dementia and Alzheimer’s disease incidence in relationship to cardiovascular disease in the cardiovascular health study cohort. J. Am. Geriatr. Soc. 2005;53:e1101–e1107. doi: 10.1111/j.1532-5415.2005.53360.x. - DOI - PubMed
Grants and funding
LinkOut - more resources
Full Text Sources
