

Raman, TEM, EELS, and Magnetic Studies of a Magnetically Reduced Graphene Oxide Nanohybrid following Exposure to Daphnia magna Biomarkers
- PMID: 35683661
- PMCID: PMC9182540
- DOI: 10.3390/nano12111805
Raman, TEM, EELS, and Magnetic Studies of a Magnetically Reduced Graphene Oxide Nanohybrid following Exposure to Daphnia magna Biomarkers
Abstract
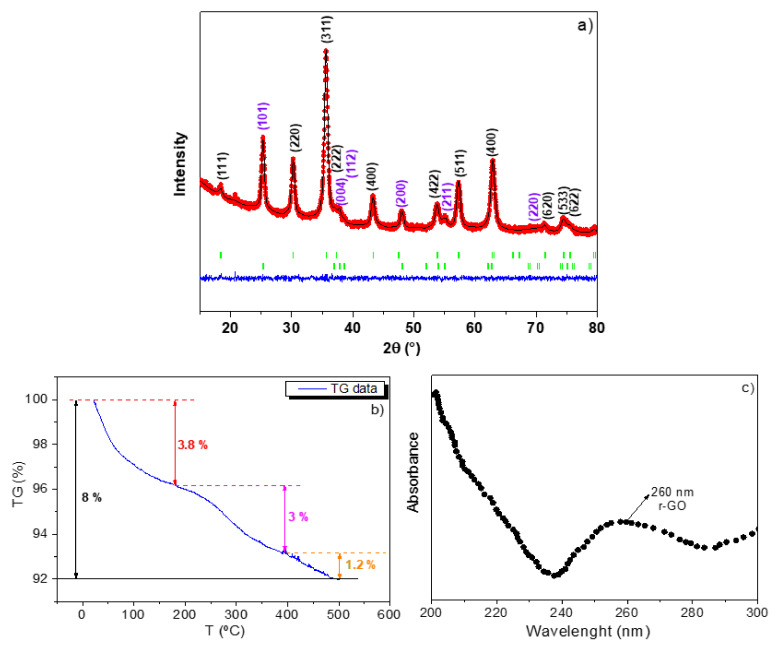
A ternary nanocomposite made of nanomaghemite, nanoanatase, and graphene oxide has been successfully synthesized using an inorganic coprecipitation approach, and it has been systematically investigated by X-ray diffraction, transmission electron microscopy, and different spectrocopic techniques (electron energy loss, µ-Raman, and 57Fe Mössbauer) after interaction with an effluent containing Daphnia magna individuals. Specifically, the influence of the nanocomposite over the Daphnia magna carapace, administered in two doses (0.5 mg mL-1 and 1 mg mL-1), has been characterized using µ-Raman spectroscopy before and after laser burning protocols, producing information about the physicochemical interaction with the biomarker. The thermal stability of the nanocomposite was found to be equal to 500 °C, where the nanoanatase and the nanomaghemite phases have respectively conserved their structural identities. The magnetic properties of the nanomaghemite have also been kept unchanged even after the high-temperature experiments and exposure to Daphnia magna. In particular, the size, texture, and structural and morphological properties of the ternary nanocomposite have not shown any significant physicochemical modifications after magnetic decantation recuperation. A significant result is that the graphene oxide reduction was kept even after the ecotoxicological assays. These sets of observations are based on the fact that while the UV-Vis spectrum has confirmed the graphene oxide reduction with a localized peak at 260 nm, the 300-K and 15-K 57Fe Mössbauer spectra have only revealed the presence of stoichiometric maghemite, i.e., the two well-defined static magnetic sextets often found in the bulk ferrimagnetic counterpart phase. The Mössbauer results have also agreed with the trivalent-like valence state of Fe ions, as also suggested by electron energy loss spectroscopy data. Thus, the ternary nanocomposite does not substantially affect the Daphnia magna, and it can be easily recovered using an ordinary magnetic decantation protocol due to the ferrimagnetic-like character of the nanomaghemite phase. Consequently, it shows remarkable physicochemical properties for further reuse, such as cleaning by polluted effluents, at least where Daphnia magna species are present.
Keywords: Daphnia magna biomarkers; lethal dose; nanohybrid recoverage; post-exposure characterization.
Conflict of interest statement
The authors declare no conflict of interest.
Figures


Similar articles
-
Synthesis and Characterization of Maghemite Nanoparticles Functionalized with Poly(Sodium 4-Styrene Sulfonate) Saloplastic and Its Acute Ecotoxicological Impact on the Cladoceran Daphnia magna.Polymers (Basel). 2024 Jun 3;16(11):1581. doi: 10.3390/polym16111581. Polymers (Basel). 2024. PMID: 38891527 Free PMC article.
-
Ecotoxicological Properties of Pure and Phosphorus-Containing Graphene Oxide Bidimensional Sheets in Daphnia magna.Toxics. 2024 Mar 29;12(4):252. doi: 10.3390/toxics12040252. Toxics. 2024. PMID: 38668475 Free PMC article.
-
X-ray and electron microscopy studies on the biodistribution and biomodification of iron oxide nanoparticles in Daphnia magna.Colloids Surf B Biointerfaces. 2014 Oct 1;122:384-389. doi: 10.1016/j.colsurfb.2014.07.016. Epub 2014 Jul 21. Colloids Surf B Biointerfaces. 2014. PMID: 25086306
-
Progress toward Room-Temperature Synthesis and Functionalization of Iron-Oxide Nanoparticles.Int J Mol Sci. 2022 Jul 27;23(15):8279. doi: 10.3390/ijms23158279. Int J Mol Sci. 2022. PMID: 35955414 Free PMC article.
-
Transmission Electron Microscopy and Scanning Transmission X-Ray Microscopy Studies on the Bioaccumulation and Tissue Level Absorption of TiO2 Nanoparticles in Daphnia magna.J Nanosci Nanotechnol. 2015 Jun;15(6):4229-38. doi: 10.1166/jnn.2015.9695. J Nanosci Nanotechnol. 2015. PMID: 26369034
Cited by
-
Ecotoxicological Properties of Titanium Dioxide Nanomorphologies in Daphnia magna.Nanomaterials (Basel). 2023 Mar 3;13(5):927. doi: 10.3390/nano13050927. Nanomaterials (Basel). 2023. PMID: 36903805 Free PMC article.
-
Cytotoxicity and Genotoxicity Effects of a Magnetic Zeolite Composite in Daphnia magna (Straus, 1820).Int J Mol Sci. 2024 Jul 9;25(14):7542. doi: 10.3390/ijms25147542. Int J Mol Sci. 2024. PMID: 39062785 Free PMC article.
References
-
- OECD . Test Guideline No. 211: Daphnia Magna Reproduction Test. Organisation for Economic Co-Operation and Development; Paris, France: 2012.
Grants and funding
LinkOut - more resources
Full Text Sources
