

Mixed Milk Feeding: A New Approach to Describe Feeding Patterns in the First Year of Life Based on Individual Participant Data from Two Randomised Controlled Trials
- PMID: 35683990
- PMCID: PMC9182968
- DOI: 10.3390/nu14112190
Mixed Milk Feeding: A New Approach to Describe Feeding Patterns in the First Year of Life Based on Individual Participant Data from Two Randomised Controlled Trials
Abstract
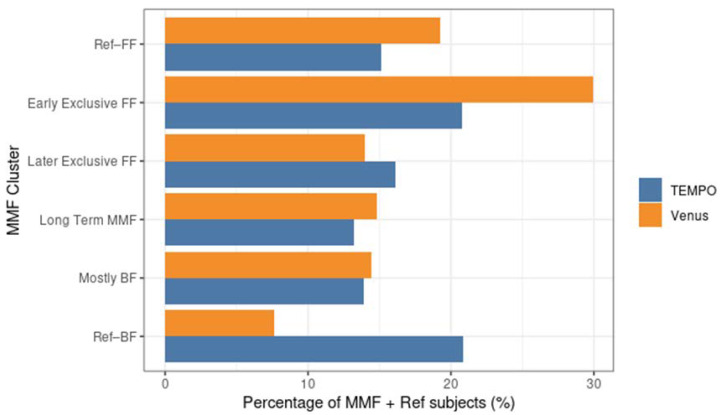
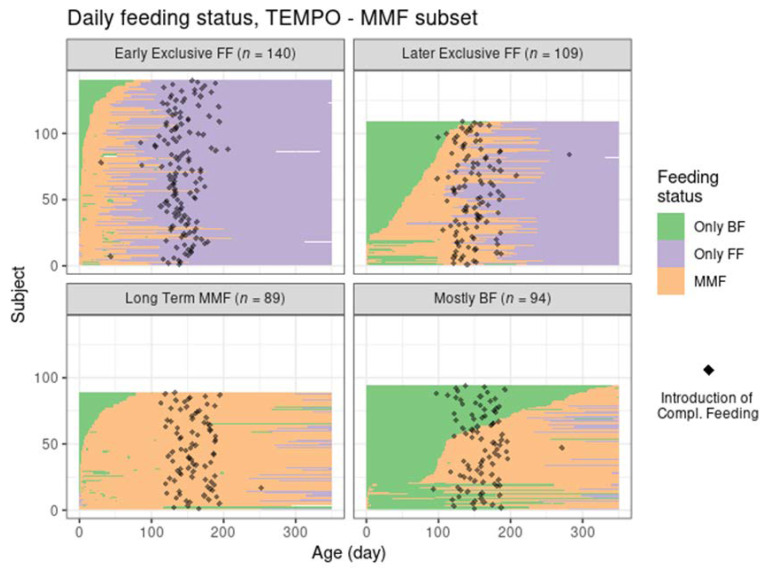
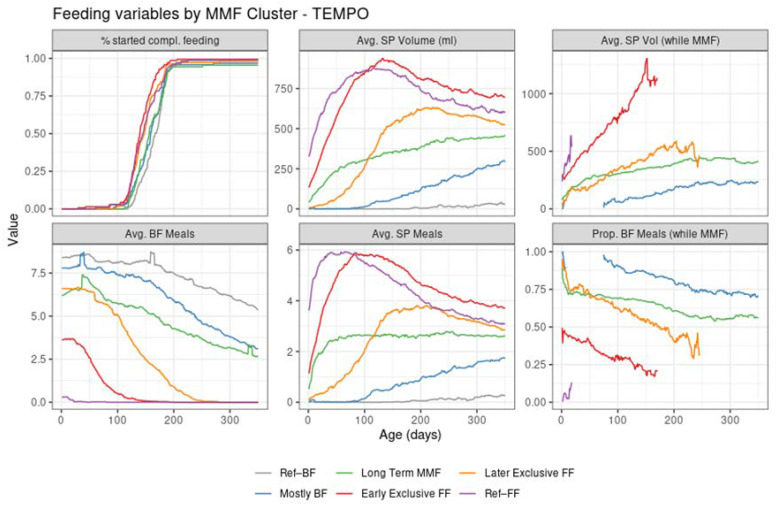
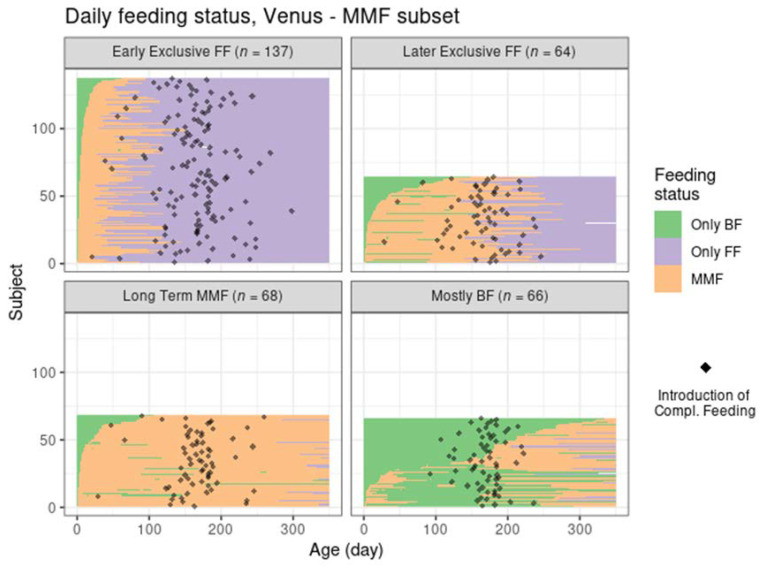
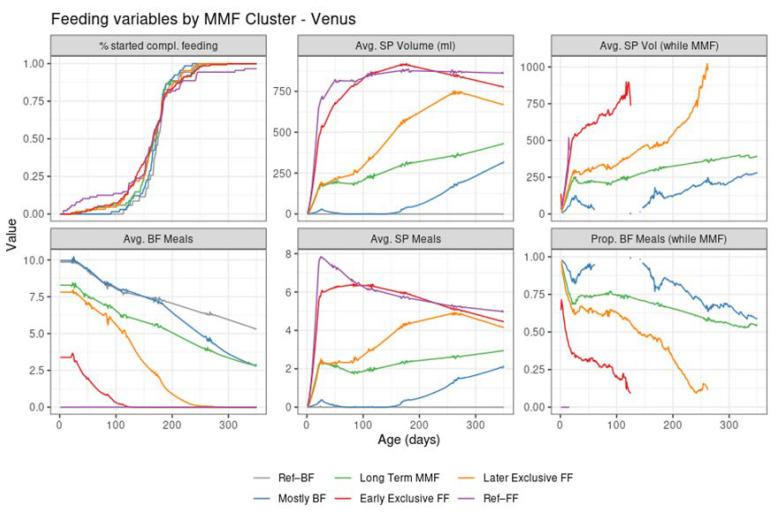
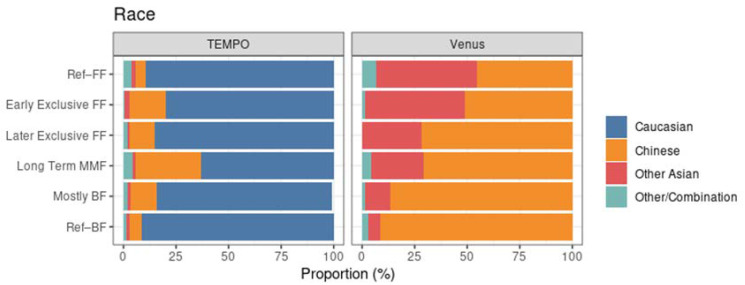
'Mixed Milk Feeding' (MMF), whereby infants are fed with both breastmilk and infant formula during the same period, is a common feeding practice. Despite its high prevalence, knowledge regarding MMF practices and their association with (health) outcomes is limited, potentially because MMF behaviours are highly variable and difficult to standardise longitudinally. In this paper, we applied a statistical clustering algorithm on individual infant feeding data collected over the first year of life from two clinical trials: 'TEMPO' (n = 855) and 'Venus' (n = 539); these studies were conducted in different years and world regions. In TEMPO, more than half of infants were MMF. Four distinct MMF clusters were identified: early exclusive formula feeding (32%), later exclusive formula feeding (25%), long-term MMF (21%), and mostly breastfeeding (22%). The same method applied to 'Venus' resulted in comparable clusters, building trust in the robustness of the cluster approach. These results demonstrate that distinct MMF patterns can be identified, which may be applicable to diverse populations. These insights could support the design of future research studying the impact of infant feeding patterns on health outcomes. To standardise this in future research, it is important to establish a unified definition of MMF.
Keywords: breastfeeding; formula feeding; infant; k-means clustering; mixed milk feeding.
Conflict of interest statement
N.G.P. reports personal fees for advisory and/or speaker services from Novartis, Nutricia, HAL, MENARINI/FAES FARMA, SANOFI, MYLAN/MEDA, BIOMAY, AstraZeneca, GSK, MSD, ASIT BIOTECH, Boehringer Ingelheim and Capicare. T.A.B. and L.F.v.d.M. are employees of Danone Nutricia Research. L.J.M. reports investigator led research grants, Speaker, Steering Committee, Advisory Board and Expenses fees paid to Newcastle University from Danone Nutricia and Sanofi Pharmaceuticals. Y.V. has participated as a clinical investigator, and/or advisory board member, and/or consultant, and/or speaker for Abbott Nutrition, Ausnutria, Biogaia, By Heart, CHR Hansen, Danone, ELSE Nutrition, Friesland Campina, Nestle Health Science, Nestle Nutrition Institute, Nutricia, Mead Johnson Nutrition, Pileje, United Pharmaceuticals (Novalac), Yakult, and Wyeth. None of the other authors have declared a conflict of interest.
Figures
Similar articles
-
Why do mothers mix milk feed their infants? Results from a systematic review.Nutr Rev. 2024 Oct 1;82(10):1355-1371. doi: 10.1093/nutrit/nuad134. Nutr Rev. 2024. PMID: 38041551 Free PMC article.
-
Mixed milk feeding: a systematic review and meta-analysis of its prevalence and drivers.Nutr Rev. 2020 Nov 1;78(11):914-927. doi: 10.1093/nutrit/nuaa016. Nutr Rev. 2020. PMID: 32357372
-
Nutrition, growth, and allergic diseases among very preterm infants after hospital discharge.Dan Med J. 2013 Feb;60(2):B4588. Dan Med J. 2013. PMID: 23461996 Review.
-
Improved general health status in an unselected infant population following an allergen reduced dietary intervention programme. The ZUFF-study-programme. Part I: Study design and 6-month nutritional behaviour.Eur J Nutr. 2000 Jun;39(3):89-102. doi: 10.1007/s003940070024. Eur J Nutr. 2000. PMID: 10918990 Clinical Trial.
-
Breastfeeding by HIV-1-infected women and outcome in their infants: a cohort study from Durban, South Africa.AIDS. 1997 Nov;11(13):1627-33. doi: 10.1097/00002030-199713000-00012. AIDS. 1997. PMID: 9365768
Cited by
-
Why do mothers mix milk feed their infants? Results from a systematic review.Nutr Rev. 2024 Oct 1;82(10):1355-1371. doi: 10.1093/nutrit/nuad134. Nutr Rev. 2024. PMID: 38041551 Free PMC article.
References
-
- World Health Organization; Geneva, Switzerland: [(accessed on 30 April 2022)]. Indicators for Assessing Infant and Young Child Feeding Practices: Definitions and Measurement Methods. Available online: https://www.who.int/publications/i/item/9789240018389.
-
- Neves P.A.R., Vaz J.S., Maia F.S., Baker P., Gatica-Domínguez G., Piwoz E., Rollins N., Victora C.G. Rates and time trends in the consumption of breastmilk, formula, and animal milk by children younger than 2 years from 2000 to 2019: Analysis of 113 countries. Lancet Child Adolesc. Health. 2021;5:619–630. doi: 10.1016/S2352-4642(21)00163-2. - DOI - PMC - PubMed
MeSH terms
LinkOut - more resources
Full Text Sources
Medical
