. 2022 Jun 6;11(11):1520.
doi: 10.3390/plants11111520.

Respiratory and Photosynthetic Responses of Antarctic Vascular Plants Are Differentially Affected by CO2 Enrichment and Nocturnal Warming

Affiliations

Respiratory and Photosynthetic Responses of Antarctic Vascular Plants Are Differentially Affected by CO2 Enrichment and Nocturnal Warming

Carolina Sanhueza et al. Plants (Basel). .

Abstract

Projected rises in atmospheric CO2 concentration and minimum night-time temperatures may have important effects on plant carbon metabolism altering the carbon balance of the only two vascular plant species in the Antarctic Peninsula. We assessed the effect of nocturnal warming (8/5 °C vs. 8/8 °C day/night) and CO2 concentrations (400 ppm and 750 ppm) on gas exchange, non-structural carbohydrates, two respiratory-related enzymes, and mitochondrial size and number in two species of vascular plants. In Colobanthus quitensis, light-saturated photosynthesis measured at 400 ppm was reduced when plants were grown in the elevated CO2 or in the nocturnal warming treatments. Growth in elevated CO2 reduced stomatal conductance but nocturnal warming did not. The short-term sensitivity of respiration, relative protein abundance, and mitochondrial traits were not responsive to either treatment in this species. Moreover, some acclimation to nocturnal warming at ambient CO2 was observed. Altogether, these responses in C. quitensis led to an increase in the respiration-assimilation ratio in plants grown in elevated CO2. The response of Deschampsia antarctica to the experimental treatments was quite distinct. Photosynthesis was not affected by either treatment; however, respiration acclimated to temperature in the elevated CO2 treatment. The observed short-term changes in thermal sensitivity indicate type I acclimation of respiration. Growth in elevated CO2 and nocturnal warming resulted in a reduction in mitochondrial numbers and an increase in mitochondrial size in D. antarctica. Overall, our results suggest that with climate change D. antarctica could be more successful than C. quitensis, due to its ability to make metabolic adjustments to maintain its carbon balance.

Keywords: Antarctic plant species; atmospheric CO2 concentration; foliar carbon balance; nocturnal warming; photosynthesis; respiration.


Conflict of interest statement

The authors declare no conflict of interest.

Figures

Figure 1
Figure 1
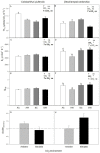
Net CO2 assimilation rate measured at saturating light and 400 ppm of CO2 (Asat), stomatal conductance (gs) and foliar leaf carbon balance (R/A) for C. quitensis (A,C,E) and D. antarctica (B,D,F). Treatments correspond to AC (ambient CO2, control thermoperiod; white bar empty), AW (ambient CO2, warming thermoperiod; white bar hashed), EC (elevated CO2, control thermoperiod; grey bar), and EW (elevated CO2, warming thermoperiod; grey bar hashed). Values are means ± SEM (n = 5). For each graph, the effect of thermoperiod (T), CO2 environment (CO2), and the interaction of thermoperiod and CO2 (T x CO2), ns indicates no significance difference, * indicates p ≤ 0.05, ** indicates p ≤ 0.01, and *** indicates p ≤ 0.001. The factor with the largest effect size is indicated in bold.
Figure 2
Figure 2
Sensitivity parameters of dark respiration calculated using the Arrhenius equation for both Antarctic species. R10 is respiration at 10°C, E0 is a modelled parameter related to the energy of activation, and Q10 denotes the relative change in respiration with a 10°C change for C. quitensis (A,C,E) and D. antarctica (B,D,F). Treatments correspond to AC (ambient CO2, control thermoperiod; white bar empty), AW (ambient CO2, warming thermoperiod; white bar hashed), EC (elevated CO2, control thermoperiod; grey bar), and EW (elevated CO2, warming thermoperiod; grey bar hashed). The acclimation degree was calculated as Acclimset-temp = Rcontrol/Rwarming at ambient and elevated CO2 for C. quitensis (G) and D. antarctica (H). Values are means ± SEM (n = 5). For each graph, the effect of thermoperiod (T), CO2 environment (CO2), and the interaction of thermoperiod and CO2 (T x CO2), ns indicates no significance difference, * indicates p ≤ 0.05, ** indicates p ≤ 0.01, and *** indicates p ≤ 0.001. The factor with the largest effect size is indicated in bold.
Figure 3
Figure 3
Total soluble sugars (TSS) and starch for C. quitensis (A,C) and D. antarctica (B,D). Treatments correspond to AC (ambient CO2, control thermoperiod; white bar empty), AW (ambient CO2, warming thermoperiod; white bar hashed), EC (elevated CO2, control thermoperiod; grey bar), and EW (elevated CO2, warming thermoperiod; grey bar hashed). Values are means ± SEM (n = 5). For each graph, the effect of thermoperiod (T), CO2 environment (CO2), and the interaction of thermoperiod and CO2 (T x CO2), with ns indicates no significance difference, * indicates p ≤ 0.05, ** indicates p ≤ 0.01, and *** indicates p ≤ 0.001. The factor with the largest effect size is indicated in bold.
Figure 4
Figure 4
Relative abundance of phosphoenol pyruvate carboxylase (PEPc) and cytochrome oxidase (COX-II) proteins for C. quitensis (A,C) and D. antarctica (B,D). Treatments correspond to AC (ambient CO2, control thermoperiod; white bar empty), AW (ambient CO2, warming thermoperiod; white bar hashed), EC (elevated CO2, control thermoperiod; grey bar), and EW (elevated CO2, warming thermoperiod; grey bar hashed). Values are means ± SEM (n = 5). For each graph, the effect of thermoperiod (T), CO2 environment (CO2), and the interaction of thermoperiod and CO2 (T x CO2), with ns indicates no significance difference, * indicates p ≤ 0.05, ** indicates p ≤ 0.01, and *** indicates p ≤ 0.001. The factor with the largest effect size is indicated in bold.
Figure 5
Figure 5
Leaf mitochondria structural changes in number, and size of mitochondria in a determined area of 171.8 µm2 and their correlation for C. quitensis (A,C,E) and D. antarctica (B,D,F) grown at AC (ambient CO2, control thermoperiod; white bar empty), AW (ambient CO2, warming thermoperiod; white bar hashed), EC (elevated CO2, control thermoperiod; grey bar), and EW (elevated CO2, warming thermoperiod; grey bar hashed). Values are means ± SEM (n = 5). For each graph, the effect of thermoperiod (T), CO2 environment (CO2), and the interaction of thermoperiod and CO2 (T x CO2), with ns indicates no significance difference, * indicates p ≤ 0.05, ** indicates p ≤ 0.01, and *** indicates p ≤ 0.001. The factor with the largest effect size is indicated in bold.
Figure 6
Figure 6
Mitochondria (M; red arrows), chloroplasts (Chl), and starch granules (Sg) from leaf mesophyll of C. quitensis exposed to AC (ambient CO2, control thermoperiod; (A), AW (ambient CO2, warming thermoperiod; (B), EC (elevated CO2, control thermoperiod; (C), and EW (elevated CO2, warming thermoperiod; (D) Microscope magnification = 6000X.
Figure 7
Figure 7
Mitochondria (M; red arrows), chloroplasts (Chl), and starch granules (Sg) from leaf mesophyll of D. antarctica exposed to AC (ambient CO2, control thermoperiod; (A), AW (ambient CO2, warming thermoperiod; (B), EC (elevated CO2, control thermoperiod; (C), and EW (elevated CO2, warming thermoperiod; (D). Microscope magnification = 11,500X.

Similar articles

Cited by

References

    1. Ciais P., Sabine C., Bala G., Bopp L., Brovkin V., Canadell J., Chhabra A., DeFries R., Galloaway J., Heimann M., et al. Carbon and other biogeochemical cycles. In: Tignor M., Allen S.K., Boschung J., Nauels A., Xia Y., Bex V., Midgley P.M., editors. Climate Change 2013: The Physical Science Basis. Contribution of Working Group I to the Fifth Assessment Report of the Intergovernamental Panel on Climate Change. Cambridge University Press; Cambridge, UK: New York, NY, USA: 2013. pp. 465–570.
    1. Keeling R.F., Powell F.L., Shaffer G., Robbins P.A., Simonson T.S. Impacts of Changes in Atmospheric O2 on Human Physiology. Is There a Basis for Concern? Front. Plant Physiol. 2021;12:48. doi: 10.3389/fphys.2021.571137. - DOI - PMC - PubMed
    1. IPCC . Summary for Policymakers. In: Masson-Delmotte V., Zhai P., Pörtner H.O., Roberts D., Skea J., Shukla P.R., Pirani A., Moufouma-Okia W., Péan C., Pidcock R.S., et al., editors. Global Warming of 1.5 °C. IPCC; Geneva, Switzerland: 2018.
    1. Bracegirdle T.J., Barrand N.E., Kusahara K., Wainer I. Predicting Antarctic climate using climate models. [(accessed on 6 September 2020)];Antarct. Environ. Portal. 2016 Available online: http://nora.nerc.ac.uk/id/eprint/513739.
    1. IPCC . Technical Summary. In: Solomon S., Qin D., Manning M., Chen Z., Marquis M., Averyt K.B., Tignor M., Miller H.L., editors. Climate Change 2007: The Physical Science Basis. Contribution of Working Group I to the Fourth Assessment Report of the Intergovernmental Panel on Climate Change. Cambridge University Press; Cambridge, UK: New York, NY, USA: 2017.

LinkOut - more resources