

Temporal Trends in Tobacco Product Use Among US Middle and High School Students: National Youth Tobacco Survey, 2011-2020
- PMID: 35684996
- PMCID: PMC10240886
- DOI: 10.1177/00333549221103812
Temporal Trends in Tobacco Product Use Among US Middle and High School Students: National Youth Tobacco Survey, 2011-2020
Abstract
Objectives: Despite significant declines in cigarette smoking during the past decade, other tobacco products gained popularity among middle and high school students. This study examined temporal trends in exclusive and concurrent use of tobacco products among middle and high school students in the United States from 2011 through 2020.
Methods: We used multiple annual datasets from the National Youth Tobacco Survey from 2011 through 2020 (N = 193 350) to examine trends of current (past 30 days) exclusive, dual, and poly use of tobacco products (ie, cigarettes, electronic cigarettes [e-cigarettes], cigars, hookahs, and smokeless tobacco). We used joinpoint regression models to calculate log-linear trends in annual percentage change (APC).
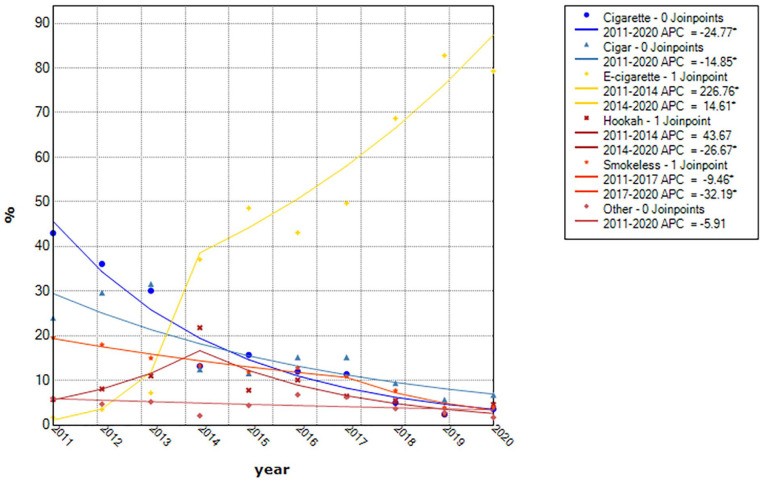
Results: During 2011-2020, exclusive use of any tobacco product decreased significantly, except for e-cigarettes, which increased significantly at an APC of 226.8% during 2011-2014 and 14.6% during 2014-2020. This increase was more pronounced among high school students (APC = 336.6% [2011-2014] and 15.7% [2014-2020]) than among middle school students (APC = 10.4% [2014-2020]) and among male students (APC = 252.8% [2011-2014] and 14.8% [2014-2020]) than among female students (APC = 13.6% [2014-2020]). During 2011-2020, we also found upward trends in dual use of e-cigarettes and cigarettes (APC = 17.3%). Poly use of e-cigarettes, cigarettes, and any other tobacco products increased significantly at an APC of 57.1% during 2011-2014.
Conclusions: The emergence of new tobacco products such as e-cigarettes in the US market has shifted the landscape of tobacco use among adolescents in the last decade toward poly product use, in which e-cigarettes are a prominent component. Our findings underscore the increasing complexity of tobacco use among adolescents in the United States and the need for strong policies and regulations adapted to evolving trends in cigarette and noncigarette tobacco products.
Keywords: tobacco; trends; youth.
Conflict of interest statement
The authors declared no potential conflicts of interest with respect to the research, authorship, and/or publication of this article.
Figures


Similar articles
-
Trends of Single, Dual, and Polytobacco Use Among School-Based Students in the United States: An Analysis of the National Youth Tobacco Survey.Am J Health Promot. 2023 Nov;37(8):1078-1090. doi: 10.1177/08901171231191557. Epub 2023 Jul 26. Am J Health Promot. 2023. PMID: 37495509
-
Tobacco Product Use and Associated Factors Among Middle and High School Students - National Youth Tobacco Survey, United States, 2021.MMWR Surveill Summ. 2022 Mar 11;71(5):1-29. doi: 10.15585/mmwr.ss7105a1. MMWR Surveill Summ. 2022. PMID: 35271557 Free PMC article.
-
Trends in Tobacco Use Among Adolescents by Grade, Sex, and Race, 1991-2019.JAMA Netw Open. 2020 Dec 1;3(12):e2027465. doi: 10.1001/jamanetworkopen.2020.27465. JAMA Netw Open. 2020. PMID: 33263760 Free PMC article.
-
An Analysis of Nicotine Pouch Use by Middle School and High School Students Surveyed by the National Youth Tobacco Survey in 2021 and a Review of the Literature.J Prim Care Community Health. 2023 Jan-Dec;14:21501319231169994. doi: 10.1177/21501319231169994. J Prim Care Community Health. 2023. PMID: 37128171 Free PMC article. Review.
-
Global Trends and Emerging Frontiers in Smoking and Smokeless Tobacco Research: A Bibliometric Analysis over the Past Decade.Healthcare (Basel). 2025 May 23;13(11):1224. doi: 10.3390/healthcare13111224. Healthcare (Basel). 2025. PMID: 40508838 Free PMC article. Review.
Cited by
-
Chemical Analysis and Flavor Distribution of Electronic Cigarettes in Australian Schools.Nicotine Tob Res. 2025 May 22;27(6):997-1005. doi: 10.1093/ntr/ntae262. Nicotine Tob Res. 2025. PMID: 39531255 Free PMC article.
-
The effects of electronic nicotine vapor on voluntary alcohol consumption in female and male C57BL/6 J mice.Drug Alcohol Depend. 2022 Dec 1;241:109676. doi: 10.1016/j.drugalcdep.2022.109676. Epub 2022 Oct 26. Drug Alcohol Depend. 2022. PMID: 36343590 Free PMC article.
-
E-Cigarette Use Among US Adults in the 2021 Behavioral Risk Factor Surveillance System Survey.JAMA Netw Open. 2023 Nov 1;6(11):e2340859. doi: 10.1001/jamanetworkopen.2023.40859. JAMA Netw Open. 2023. PMID: 37921768 Free PMC article.
-
Poly-tobacco use and mental health in South Korean adolescents.Tob Induc Dis. 2024 May 22;22. doi: 10.18332/tid/187077. eCollection 2024. Tob Induc Dis. 2024. PMID: 38779296 Free PMC article.
-
Prevalence and correlates of flavored novel oral nicotine product use among a national sample of youth.Addict Behav. 2024 May;152:107982. doi: 10.1016/j.addbeh.2024.107982. Epub 2024 Feb 10. Addict Behav. 2024. PMID: 38359494 Free PMC article.
References
-
- Centers for Disease Control and Prevention. National Youth Tobacco Survey (NYTS). Published 2020. Accessed May 10, 2021. https://www.cdc.gov/tobacco/data_statistics/%0Asurveys/nyts/index.htm
MeSH terms
LinkOut - more resources
Full Text Sources
Medical
Miscellaneous
