

Metabolomic studies in the inborn error of metabolism alkaptonuria reveal new biotransformations in tyrosine metabolism
- PMID: 35685462
- PMCID: PMC9170613
- DOI: 10.1016/j.gendis.2021.02.007
Metabolomic studies in the inborn error of metabolism alkaptonuria reveal new biotransformations in tyrosine metabolism
Abstract
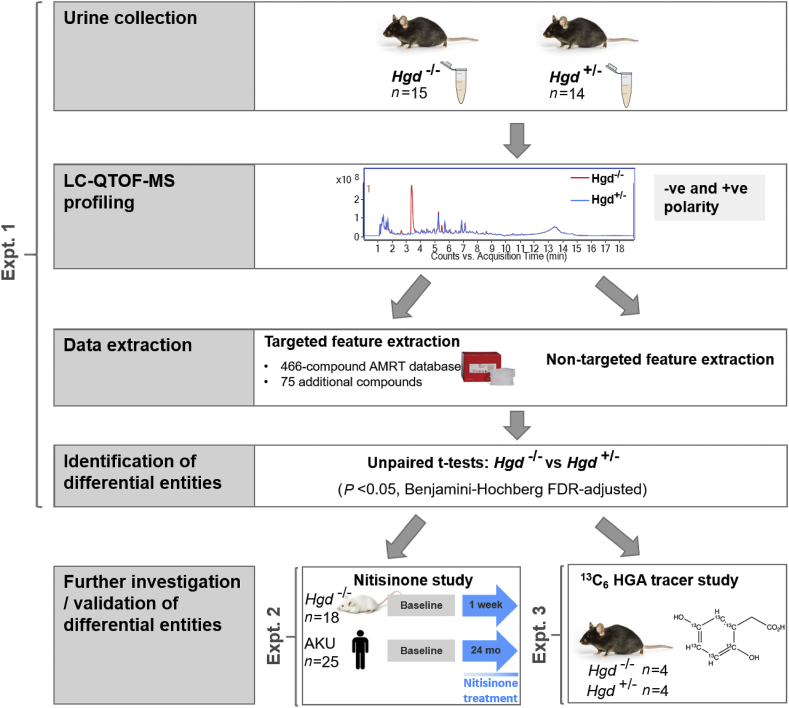
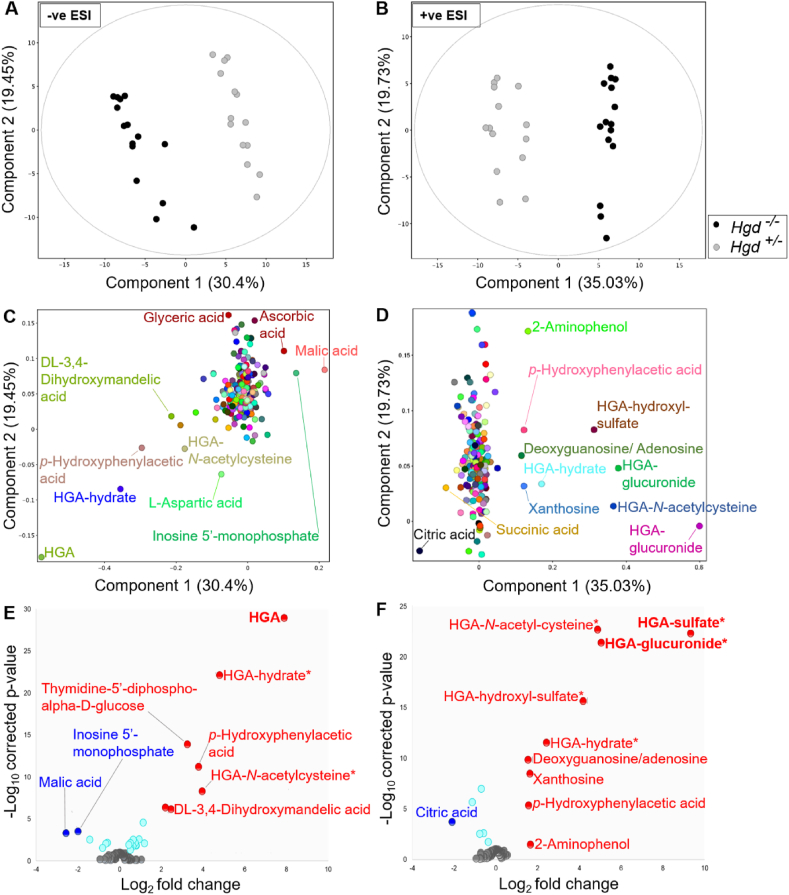
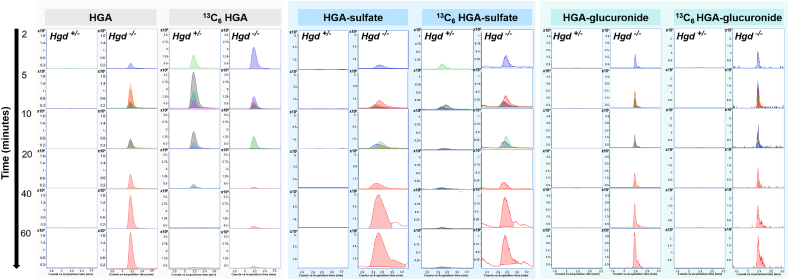
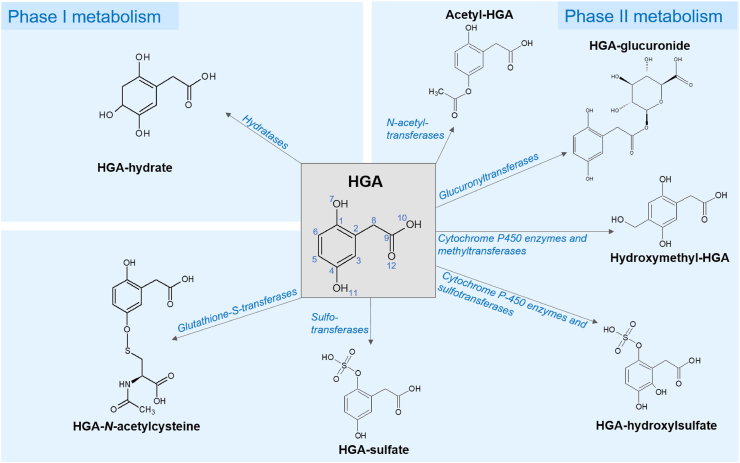
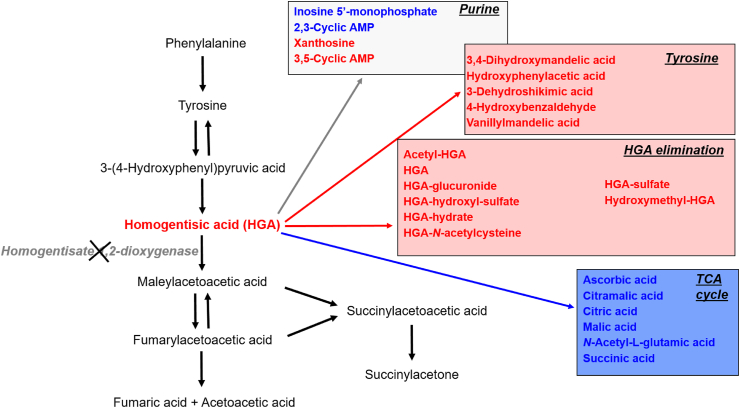
Alkaptonuria (AKU) is an inherited disorder of tyrosine metabolism caused by lack of active enzyme homogentisate 1,2-dioxygenase (HGD). The primary consequence of HGD deficiency is increased circulating homogentisic acid (HGA), the main agent in the pathology of AKU disease. Here we report the first metabolomic analysis of AKU homozygous Hgd knockout (Hgd -/-) mice to model the wider metabolic effects of Hgd deletion and the implication for AKU in humans. Untargeted metabolic profiling was performed on urine from Hgd -/- AKU (n = 15) and Hgd +/- non-AKU control (n = 14) mice by liquid chromatography high-resolution time-of-flight mass spectrometry (Experiment 1). The metabolites showing alteration in Hgd -/- were further investigated in AKU mice (n = 18) and patients from the UK National AKU Centre (n = 25) at baseline and after treatment with the HGA-lowering agent nitisinone (Experiment 2). A metabolic flux experiment was carried out after administration of 13C-labelled HGA to Hgd -/-(n = 4) and Hgd +/-(n = 4) mice (Experiment 3) to confirm direct association with HGA. Hgd -/- mice showed the expected increase in HGA, together with unexpected alterations in tyrosine, purine and TCA-cycle pathways. Metabolites with the greatest abundance increases in Hgd -/- were HGA and previously unreported sulfate and glucuronide HGA conjugates, these were decreased in mice and patients on nitisinone and shown to be products from HGA by the 13C-labelled HGA tracer. Our findings reveal that increased HGA in AKU undergoes further metabolism by mainly phase II biotransformations. The data advance our understanding of overall tyrosine metabolism, demonstrating how specific metabolic conditions can elucidate hitherto undiscovered pathways in biochemistry and metabolism.
Keywords: AKU, alkaptonuria; AMRT, accurate mass/retention time; Alkaptonuria; Biotransformation; CV, coefficient of variation; FC, fold change; FDR, false-discovery rate; HGA, homogentisic acid; HGD, homogentisate 1,2-dioxygenase; HPPD, hydroxyphenylpyruvic acid dioxygenase; LC-QTOF-MS, liquid chromatography quadrupole time-of-flight mass spectrometry; MS/MS, tandem mass spectrometry; MSC, Molecular Structure Correlator; Metabolism; Metabolomics; Mice; PCA, principal component analysis; QC, quality control; RT, retention time.
© 2021 Chongqing Medical University. Production and hosting by Elsevier B.V.
Figures
Similar articles
-
Ochronotic osteoarthropathy in a mouse model of alkaptonuria, and its inhibition by nitisinone.Ann Rheum Dis. 2014 Jan;73(1):284-9. doi: 10.1136/annrheumdis-2012-202878. Epub 2013 Mar 19. Ann Rheum Dis. 2014. PMID: 23511227
-
A Comprehensive LC-QTOF-MS Metabolic Phenotyping Strategy: Application to Alkaptonuria.Clin Chem. 2019 Apr;65(4):530-539. doi: 10.1373/clinchem.2018.295345. Epub 2019 Feb 19. Clin Chem. 2019. PMID: 30782595
-
A novel mutation in the homogentisate 1,2 dioxygenase gene identified in Chinese Hani pediatric patients with Alkaptonuria.Clin Chim Acta. 2022 Jul 1;532:164-171. doi: 10.1016/j.cca.2022.04.998. Epub 2022 May 10. Clin Chim Acta. 2022. PMID: 35550814
-
Alkaptonuria: a very rare metabolic disorder.Indian J Biochem Biophys. 2013 Oct;50(5):339-44. Indian J Biochem Biophys. 2013. PMID: 24772955 Review.
-
Development of an Effective Therapy for Alkaptonuria - Lessons for Osteoarthritis.Rheumatol Immunol Res. 2021 Sep 28;2(2):79-85. doi: 10.2478/rir-2021-0011. eCollection 2021 Jun. Rheumatol Immunol Res. 2021. PMID: 36465977 Free PMC article. Review.
Cited by
-
A narrative review of metabolomics in the era of "-omics": integration into clinical practice for inborn errors of metabolism.Transl Pediatr. 2022 Oct;11(10):1704-1716. doi: 10.21037/tp-22-105. Transl Pediatr. 2022. PMID: 36345452 Free PMC article. Review.
-
Untargeted NMR Metabolomics Reveals Alternative Biomarkers and Pathways in Alkaptonuria.Int J Mol Sci. 2022 Dec 13;23(24):15805. doi: 10.3390/ijms232415805. Int J Mol Sci. 2022. PMID: 36555443 Free PMC article.
-
Understanding Inborn Errors of Metabolism through Metabolomics.Metabolites. 2022 Apr 27;12(5):398. doi: 10.3390/metabo12050398. Metabolites. 2022. PMID: 35629902 Free PMC article. Review.
-
Electronic structure and molecular properties of nitisinone and mesotrione in water.J Mol Model. 2023 Nov 13;29(12):370. doi: 10.1007/s00894-023-05780-5. J Mol Model. 2023. PMID: 37953387 Free PMC article.
-
Metabolic landscape and pathogenic insights: a comprehensive analysis of high ovarian response in infertile women undergoing in vitro fertilization.J Ovarian Res. 2024 May 17;17(1):105. doi: 10.1186/s13048-024-01411-6. J Ovarian Res. 2024. PMID: 38760835 Free PMC article.
References
-
- Zatkova A. An update on molecular genetics of Alkaptonuria (AKU) J Inherit Metab Dis. 2011;34(6):1127–1136. - PubMed
-
- Ranganath L.R., Jarvis J.C., Gallagher J.A. Recent advances in management of alkaptonuria (invited review; best practice article) J Clin Pathol. 2013;66(5):367–373. - PubMed
-
- Helliwell T.R., Gallagher J.A., Ranganath L. Alkaptonuria - a review of surgical and autopsy pathology. Histopathology. 2008;53(5):503–512. - PubMed
-
- Taylor A.M., Boyde A., Wilson P.J.M., et al. The role of calcified cartilage and subchondral bone in the initiation and progression of ochronotic arthropathy in alkaptonuria. Arthritis Rheum. 2011;63(12):3887–3896. - PubMed
Associated data
LinkOut - more resources
Full Text Sources
