

Brain Activity in Different Brain Areas of Patients With Dry Eye During the Female Climacteric Period According to Voxel-Based Morphometry
- PMID: 35685738
- PMCID: PMC9171137
- DOI: 10.3389/fneur.2022.879444
Brain Activity in Different Brain Areas of Patients With Dry Eye During the Female Climacteric Period According to Voxel-Based Morphometry
Abstract
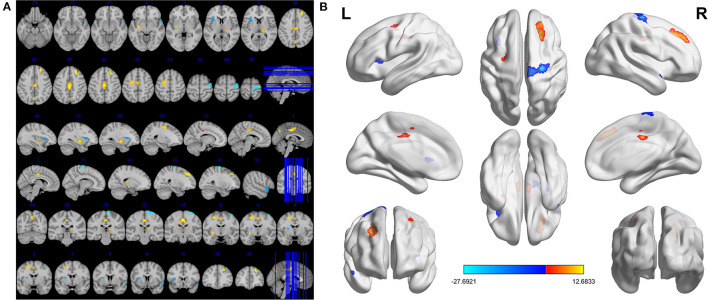
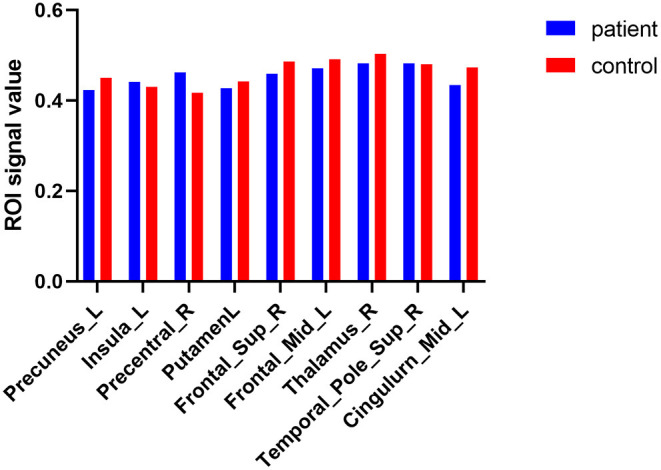
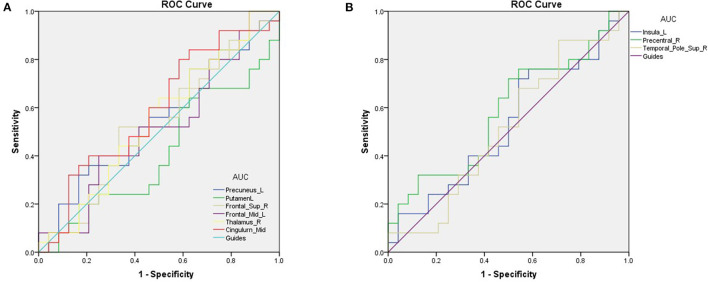
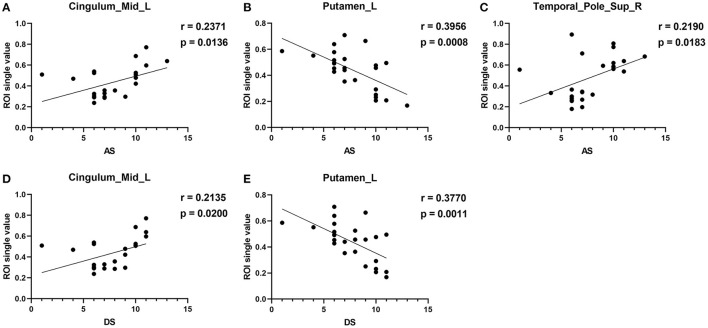
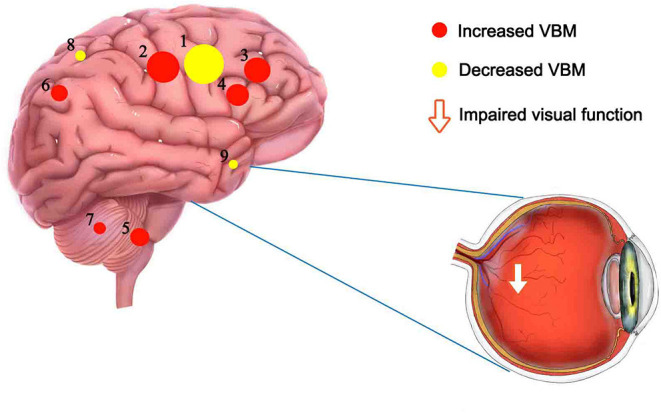
We aim to investigate potential morphological alterations of the brain in female climacteric patients with dry eye (DE) and their relationship to behavioral performances. Twenty-five female patients with DE disease during the female climacteric period and 25 age and education-matched healthy controls (HCs) underwent magnetic resonance imaging. Imaging data were analyzed using voxel-based morphometry (VBM) to identify group differences in DE patients and HCs. Compared with HCs, patients with DE during the female climacteric period had significantly decreased VBM in the Putamen_L, Thalamus_R, Precuneus_L, Frontal_Sup_R, Cingulum_Mid_L, and Frontal_Mid_L. There was increased VBM in the Temporal_Pole_Sup_R, Precentral_R and Insula_L. Receiver operating characteristic curve analysis indicated that the VBM method has clear potential for diagnosis of DE patients during the climacteric period. Correlation analysis found a negative correlation between the VBM values of the Putamen_L and the anxiety score (AS) and depression score (DS), a positive correlation was found between VBM values of the Temporal_Pole_Sup_R and AS. Moreover, VBM values in the Cingulum_Mid_L were positively correlated with AS and DS. These results revealed abnormal spontaneous activity in the brain regions of patients with DE during the climacteric period, which may indicate underlying pathological mechanisms. These results may help to advance clinical treatments.
Keywords: climacteric period; dry eye disease; gray matter density; magnetic resonance imaging; voxel-based morphometry.
Copyright © 2022 Hu, Zhang, Kang, Pan, Ge, Li, Yang, Pei and Shao.
Conflict of interest statement
The authors declare that the research was conducted in the absence of any commercial or financial relationships that could be construed as a potential conflict of interest.
Figures
Similar articles
-
Decreased gray matter volume and increased white matter volume in patients with neovascular age-related macular degeneration: a voxel-based morphometry study.Aging (Albany NY). 2021 Oct 6;13(19):23182-23192. doi: 10.18632/aging.203610. Epub 2021 Oct 6. Aging (Albany NY). 2021. PMID: 34623972 Free PMC article.
-
Gray Matter Volume Changes in Patients With Acute Eye Pain: A Voxel-Based Morphometry Study.Transl Vis Sci Technol. 2019 Jan 2;8(1):1. doi: 10.1167/tvst.8.1.1. eCollection 2019 Jan. Transl Vis Sci Technol. 2019. PMID: 30627476 Free PMC article.
-
Brain activity in different brain areas of patients with diabetic vitreous hemorrhage according to voxel-based morphometry.Int J Ophthalmol. 2025 Feb 18;18(2):258-267. doi: 10.18240/ijo.2025.02.09. eCollection 2025. Int J Ophthalmol. 2025. PMID: 39967965 Free PMC article.
-
Gray Matter Structural and Functional Alterations in Idiopathic Blepharospasm: A Multimodal Meta-Analysis of VBM and Functional Neuroimaging Studies.Front Neurol. 2022 Jun 6;13:889714. doi: 10.3389/fneur.2022.889714. eCollection 2022. Front Neurol. 2022. PMID: 35734475 Free PMC article.
-
Meta-Analysis of Structural and Functional Brain Abnormalities in Cocaine Addiction.Front Psychiatry. 2022 Jun 24;13:927075. doi: 10.3389/fpsyt.2022.927075. eCollection 2022. Front Psychiatry. 2022. PMID: 35815007 Free PMC article.
Cited by
-
Nociplastic pain among individuals with chronic ocular surface pain: One cause for "pain without stain"?Surv Ophthalmol. 2025 May-Jun;70(3):536-543. doi: 10.1016/j.survophthal.2025.01.004. Epub 2025 Jan 13. Surv Ophthalmol. 2025. PMID: 39814104 Review.
-
Machine learning analysis reveals aberrant dynamic changes in amplitude of low-frequency fluctuations among patients with retinal detachment.Front Neurosci. 2023 Jul 20;17:1227081. doi: 10.3389/fnins.2023.1227081. eCollection 2023. Front Neurosci. 2023. PMID: 37547140 Free PMC article.
-
Regional brain function study in patients with primary Sjögren's syndrome.Arthritis Res Ther. 2025 Apr 23;27(1):93. doi: 10.1186/s13075-025-03554-3. Arthritis Res Ther. 2025. PMID: 40270048 Free PMC article.
References
LinkOut - more resources
Full Text Sources
Research Materials