A Visualized Dynamic Prediction Model for Overall Survival in Elderly Patients With Pancreatic Cancer for Smart Medical Services
- PMID: 35685764
- PMCID: PMC9171143
- DOI: 10.3389/fpubh.2022.885624
A Visualized Dynamic Prediction Model for Overall Survival in Elderly Patients With Pancreatic Cancer for Smart Medical Services
Abstract
Background: Pancreatic cancer (PC) is a highly malignant tumor of the digestive system. The number of elderly patients with PC is increasing, and older age is related to a worse prognosis. Accurate prognostication is crucial in treatment decisions made for people diagnosed with PC. However, an accurate predictive model for the prognosis of these patients is still lacking. We aimed to construct nomograms for predicting the overall survival (OS) of elderly patients with PC.
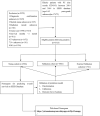
Methods: Patients with PC, older than 65 years old from 2010 to 2015 in the Surveillance, Epidemiology, and End Results database, were selected and randomly divided into training cohort (n = 4,586) and validation cohort (n = 1,966). Data of patients in 2016-2018 (n = 1,761) were used for external validation. Univariable and forward stepwise multivariable Cox analysis was used to determine the independent prognostic factors. We used significant variables in the training set to construct nomograms predicting prognosis. The performance of the models was evaluated for their discrimination and calibration power based on the concordance index (C-index), calibration curve, and the decision curve analysis (DCA).
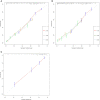
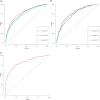
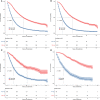
Results: Age, insurance, grade, surgery, radiation, chemotherapy, T, N, and American Joint Commission on Cancer were independent predictors for OS and thus were included in our nomogram. In the training cohort and validation cohort, the C-indices of our nomogram were 0.725 (95%CI: 0.715-0.735) and 0.711 (95%CI: 0.695-0.727), respectively. The 1-, 3-, and 5-year areas under receiver operating characteristic curves showed similar results. The calibration curves showed a high consensus between observations and predictions. In the external validation cohort, C-index (0.797, 95%CI: 0.778-0.816) and calibration curves also revealed high consistency between observations and predictions. The nomogram-related DCA curves showed better clinical utility compared to tumor-node-metastasis staging. In addition, we have developed an online prediction tool for OS.
Conclusions: A web-based prediction model for OS in elderly patients with PC was constructed and validated, which may be useful for prognostic assessment, treatment strategy selection, and follow-up management of these patients.
Keywords: SEER database; elderly patients; nomogram; online application; pancreatic cancer.
Copyright © 2022 Zhong, Liao, Peng, Cao, Liu, Liu, Qiu, Guan, Zhang, Liu and Peng.
Conflict of interest statement
The authors declare that the research was conducted in the absence of any commercial or financial relationships that could be construed as a potential conflict of interest.
Figures


Similar articles
-
A Web-Based Prediction Model for Cancer-Specific Survival of Elderly Patients With Early Hepatocellular Carcinoma: A Study Based on SEER Database.Front Public Health. 2022 Jan 13;9:789026. doi: 10.3389/fpubh.2021.789026. eCollection 2021. Front Public Health. 2022. PMID: 35096742 Free PMC article. Clinical Trial.
-
The Nomogram predicting the overall survival of patients with pancreatic cancer treated with radiotherapy: a study based on the SEER database and a Chinese cohort.Front Endocrinol (Lausanne). 2023 Oct 25;14:1266318. doi: 10.3389/fendo.2023.1266318. eCollection 2023. Front Endocrinol (Lausanne). 2023. PMID: 37955009 Free PMC article.
-
A Web-Based Prediction Model for Cancer-Specific Survival of Elderly Patients Undergoing Surgery With Prostate Cancer: A Population-Based Study.Front Public Health. 2022 Jul 12;10:935521. doi: 10.3389/fpubh.2022.935521. eCollection 2022. Front Public Health. 2022. PMID: 35903379 Free PMC article. Clinical Trial.
-
Predictors of Distant Metastasis and Prognosis in Newly Diagnosed T1 Intrahepatic Cholangiocarcinoma.Biomed Res Int. 2023 Jan 17;2023:6638755. doi: 10.1155/2023/6638755. eCollection 2023. Biomed Res Int. 2023. PMID: 36704724 Free PMC article. Review.
-
Prognostic nomograms for young breast cancer: A retrospective study based on the SEER and METABRIC databases.Cancer Innov. 2024 Oct 25;3(6):e152. doi: 10.1002/cai2.152. eCollection 2024 Dec. Cancer Innov. 2024. PMID: 39464427 Free PMC article. Review.
Cited by
-
Value of a multi-indicator model combining Elast PQ technology, blood lipids, liver function, and uric acid for early diagnosis of alcoholic fatty liver disease.Am J Transl Res. 2025 Apr 15;17(4):3050-3062. doi: 10.62347/GMGX5873. eCollection 2025. Am J Transl Res. 2025. PMID: 40385037 Free PMC article.
-
Development and external validation of a prognostic nomogram to predict survival in patients aged ≥60 years with pancreatic ductal adenocarcinoma.Transl Cancer Res. 2024 Jun 30;13(6):2751-2766. doi: 10.21037/tcr-24-5. Epub 2024 Jun 13. Transl Cancer Res. 2024. PMID: 38988930 Free PMC article.
References
-
- Ye L, Ye H, Zhou Q, Li Z, Lin Q, Tan L, et al. . A retrospective cohort study of pancreatic neuroendocrine tumors at single institution over 15 years: New proposal for low- and high-grade groups, validation of a nomogram for prognosis, and novel follow-up strategy for liver metastases. Int J Surg. (2016) 29:108–17. 10.1016/j.ijsu.2016.03.036 - DOI - PubMed
MeSH terms
LinkOut - more resources
Full Text Sources
Medical

