Review
. 2021 Feb 3;11(10):5659-5697.
doi: 10.1039/d0ra07800j. eCollection 2021 Jan 28.

Conducting polymers: a comprehensive review on recent advances in synthesis, properties and applications

Affiliations
Review

Conducting polymers: a comprehensive review on recent advances in synthesis, properties and applications

Namsheer K et al. RSC Adv. .

Erratum in

Abstract

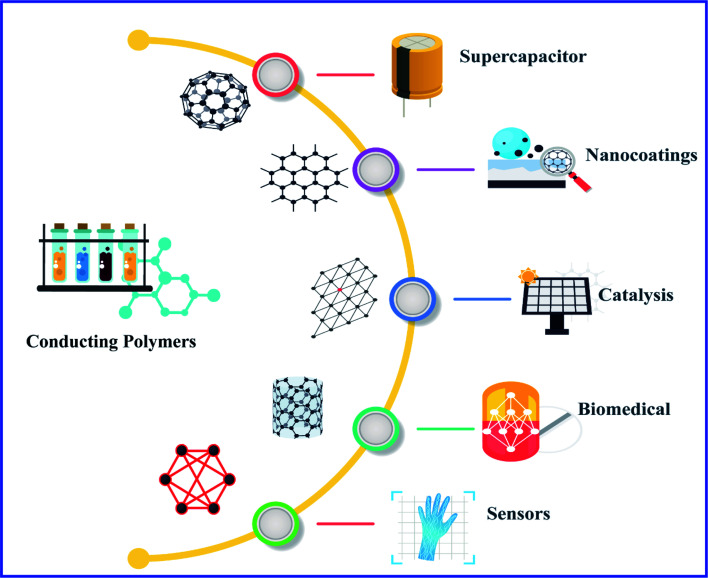
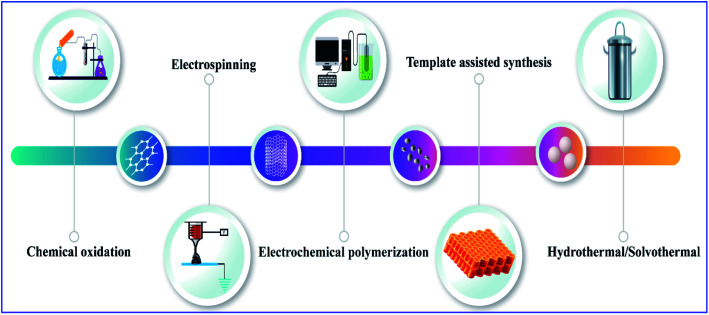
Conducting polymers are extensively studied due to their outstanding properties, including tunable electrical property, optical and high mechanical properties, easy synthesis and effortless fabrication and high environmental stability over conventional inorganic materials. Although conducting polymers have a lot of limitations in their pristine form, hybridization with other materials overcomes these limitations. The synergetic effects of conducting polymer composites give them wide applications in electrical, electronics and optoelectronic fields. An in-depth analysis of composites of conducting polymers with carbonaceous materials, metal oxides, transition metals and transition metal dichalcogenides etc. is used to study them effectively. Here in this review we seek to describe the transport models which help to explain the conduction mechanism, relevant synthesis approaches, and physical properties, including electrical, optical and mechanical properties. Recent developments in their applications in the fields of energy storage, photocatalysis, anti-corrosion coatings, biomedical applications and sensing applications are also explained. Structural properties play an important role in the performance of the composites.


Conflict of interest statement

The authors declare no conflict of interest.

Figures

Fig. 1
Fig. 1. Schematic illustration of applications of conducting polymers and their composites.
Chart 1
Chart 1. Structural illustration of different conducting polymers.
Scheme 1
Scheme 1. Formation of monosubstituted and disubstituted polyacetylene.
Fig. 2
Fig. 2. Schematic illustration of different synthesis methods for conducting polymers.
Scheme 2
Scheme 2. Synthesis of polyacetylene using a Ziegler–Natta catalyst.
Scheme 3
Scheme 3. Synthesis of polyacetylene using a Luttinger catalyst.
Chart 2
Chart 2. Structural illustration of different forms of polyaniline.
Scheme 4
Scheme 4. Synthesis of polyaniline by the chemical oxidation method.
Scheme 5
Scheme 5. Mechanism of electrochemical synthesis of polypyrrole.
Scheme 6
Scheme 6. Synthesis of poly(p-phenylene)s using a binary system (both a Lewis acid and an oxidant system).
Scheme 7
Scheme 7. Synthesis of poly(p-phenylene)s using single system (oxidant system).
Scheme 8
Scheme 8. Synthesis of poly(p-phenylene)s using a Wurtz–Fittig reaction.
Scheme 9
Scheme 9. Synthesis of poly(p-phenylene)s using an Ulman reaction.
Scheme 10
Scheme 10. Synthesis of poly(p-phenylene vinylene) by a Wittig coupling reaction.
Scheme 11
Scheme 11. Synthesis of polythiophenes by the Yomomoto route.
Scheme 12
Scheme 12. Synthesis of polythiophenes by the Lin–Dudek route.
Fig. 3
Fig. 3. The electronic band and chemical structures of polythiophene (PT) with (a) p-type doping and (b) n-type doping (DOI: 10.3390/polym9040150, Open source MDPI).
Fig. 4
Fig. 4. Electronic bands and chemical structures illustrating (a) undoped; (b) polaron; (c) bipolaron; and (d) fully doped states of polypyrrole (PPy) (DOI: 10.3390/polym9040150, Open source MDPI).
Fig. 5
Fig. 5. Energy level diagram of the molecular ionization process of poly(p-phenylene) (reprinted with permission, copyright 2004 Wiley).
Fig. 6
Fig. 6. Representation of charge density wave in polyacetylene.
Fig. 7
Fig. 7. Schematic illustration of electroluminescent mechanism of conducting polymer diodes.
Fig. 8
Fig. 8. Typical stress–strain curve of polymeric materials.
Fig. 9
Fig. 9. Schematic representation of basic properties of conducting polymer based supercapacitors.
Fig. 10
Fig. 10. [A] (a) Synthesis route for PC/PANI composite. (b) CV curves of the electrodes of PC/PANI composites, PC, and PANI at 0.05 V s−1. (c) Nyquist plots of PC/PANI composite. (d) GCD curves of PC/PANI composites with different concentrations of aniline at 1.0 A g−1. (e) Cycle stability of composites at a constant current density of 5.0 A g−1 (reprinted with permission, copyright 2018 Wiley) [B] (a–c) TEM images of GO/PANI composites at different temperatures of 120, 150 and 180 °C. (d) Specific capacitance of GNS/PANI composites at different scan rates. (e) The GCD curves with different current densities of GO/PANI composites synthesized at 120 °C. (f) Specific capacitance of GO/PANI composites at different current densities (DOI: 10.1038/srep44562, Open source Nature).
Fig. 11
Fig. 11. [A] (a) Schematic illustration of evolution of different morphologies of polypyrrole by electropolymerization. (b) Specific capacitance variation of polypyrrole nanosheets at different current density ranges. (c) Variation of the particular capacitance of nanobelts, nanobricks and nanosheets at different scan rates. (d) Change in specific capacitance of polypyrrole nanosheets with varying numbers of cycles (reprinted with permission, copyright 2012 Royal Society of Chemistry) [B] CV of (a) 1 : 1 nanocomposites of polyaniline with NRGO, MoS2, WS2 and BCN at 40 mV s−1 (b) CV of NRGO PANI composite at different scan rates. (c) Specific capacitance of 1 : 1 nanocomposites of PANI with NRGO, MoS2, WS2 and BCN at different current densities. (d) Specific capacitance of 1 : 6 PANI nanocomposites with NRGO, MoS2, WS2 and BCN at different current densities. (e) Ragone plots of 1 : 1 and 1 : 6 NRGO–PANI nanocomposites. (f) Cyclic stability of 1 : 1 nanocomposites of PANI with NRGO, MoS2, WS2 and BCN at a current density of 2 A g−1 (reprinted with permission, copyright 2014 Elsevier).
Fig. 12
Fig. 12. (a) Schematic representation of synthesis route for polyaniline/CeO2 nanoparticles. (b and c) Potentiodynamic polarization curve of control epoxy coating and conducting polymer composite pigmented coating after 1 and 15 days, respectively. (d) Salt spray test results after 20 days for epoxy coating, PANI/epoxy coating, PANI/CeO2/epoxy-0.5 coating, PANI/CeO2/epoxy-1 coating, and PANI/CeO2/epoxy-2 coating (reprinted with permission, copyright 2019 Elsevier).
Fig. 13
Fig. 13. (a and b) Nyquist and (c) Bode plots of the prepared samples. (d) Tafel polarization curves of the bare metal and the coated polypyrrole films (DOI: 10.20964/2020.03.49, open source ESG).
Fig. 14
Fig. 14. (a) Schematic illustration of the synthesis of PEDOT:PSS-G hybrids. (b) Optical photographs of pure-coating, G-coating, and PG-coating after salt spray test. The electrochemical impedance spectroscopy of (c, d) pure-coating, (e, f) G-coating and (g, h) PG-coating (DOI: 10.20964/2019.05.37, open source ESG).
Fig. 15
Fig. 15. Photocatalytic mechanism in conducting polymer composites.
Fig. 16
Fig. 16. [A] (a) Synthetic route. (b) The process of light-harvesting and energy migration in PPh framework and the energy transfer to Pd sites for catalysis. (c) UV-vis absorption of the reaction mixture with 400 mg L−1 of Cat-2 in 2 mM of p-NPh under visible light. (d, e) Conversions of p-NPh to p-APh by different photocatalysts. (f) The catalytic activity of recycling with reaction time of 150 min (reprinted with permission, copyright 2013 Royal society of chemistry) [B] (a) SEM images of g-C3N4/TiO2@PANI nanocomposite photocatalytic degradation of CR. (b) Comparative degradation study. (c) Effect of solution pH on CR degradation onto g-C3N4/TiO2@PANI nanocomposite. (d) Effect of initial CR concentration on photocatalysis by g-C3N4/TiO2@PANI nanocomposite. (e) Reusability study g-C3N4/TiO2@PANI nanocomposite (DOI: 10.1038/s41598-019-48516-3, open source Nature).
Fig. 17
Fig. 17. (a) TEM image of bare CdO nanoparticles. (b & c) SEM image of PANI homo polymer, and PANI/CdO nanocomposite. (d & f) Degradation of MB and MG under UV light irradiation by using PANI homo polymer and PANI/CdO photocatalyst. (e & g) Degradation of MB and MG under natural light irradiation by using PANI homo polymer and PANI/CdO photocatalyst. Effect of a number of runs on the degradation of dyes in the presence of PANI/CdO nanocomposite: (h) UV light irradiation of MB, (i) natural sunlight irradiation of MB, (j) UV light irradiation of MG, and (k) natural sunlight irradiation of MG. Catalyst concentration, 0.4 mg mL−1; initial concentration of dyes, 1.5 × 10⁻⁵ M (reprinted with permission, copyright 2013 American Chemical Society).
Fig. 18
Fig. 18. Schematic representation of photothermal treatment using a conducting polymer.
Fig. 19
Fig. 19. [A] (a) Schematic illustration of effect of NIR radiation on S-rGO–Fe3O4–PANI composite. (b) SEM image of S-rGO–Fe3O4–PANI. (c) Obtained maximum temperature difference values for S-rGO–Fe3O4–PANI with different concentrations at various laser power densities. (d) Heating curves for S-rGO–Fe3O4–PANI and deionized water at 2.0 W cm−2 laser power density. (e) Heating and cooling curves for S-rGO–Fe3O4–PANI at 2.0 W cm−2 laser power density. (f) −ln θt for the cooling period of S-rGO–Fe3O4–PANI after irradiation (reprinted with permission, copyright 2019 Elsevier) [B] (a) photothermal effect of pure water and PPy NPs with different concentrations upon irradiation by a 1 W cm−2 808 nm laser. In vivo photothermal therapy study using intravenously injected PPy NPs. (b) Tumour growth rates of groups after different treatments. (c) Survival curves of mice bearing 4T1 tumour after various treatments. (d) Representative photos of tumours on mice after various treatments (reprinted with permission, copyright 2012 Royal Society of Chemistry).
Fig. 20
Fig. 20. (a) AFM images of PANI-NF/AuNP surface, PANI-NF/AuNP/GSH surface, PANI-NF/AuNP/GSH/FA surface, and HeLa cells adhered on sensor surface. (b) Preparation of PANI-NF/AuNP/GSH/FA-BSA film and an impendence sensor with HeLa cells. (c) Nyquist diagrams of GCE/PANI-NF/AuNP/GSH/FA-BSA obtained with different HeLa cell concentrations (from a to i). Inset: a plot of EIS versus the logarithm of HeLa cell number (reprinted with permission, copyright 2010 Elsevier).
None
Namsheer K
None
Chandra Sekhar Rout

References

    1. Nezakati T. Seifalian A. Tan A. Seifalian A. M. Chem. Rev. 2018;118:6766–6843. doi: 10.1021/acs.chemrev.6b00275. - DOI - PubMed
    1. Heeger A. J. J. Phys. Chem. B. 2001;105:8475–8491. doi: 10.1021/jp011611w. - DOI
    1. Handbook of Conducting Polymers, ed. T. A. Skotheim, Dekker, New York, 1986, vol. 1–2
    1. Le T. H. Kim Y. Yoon H. Polymers. 2017;9:150. doi: 10.3390/polym9040150. - DOI - PMC - PubMed
    1. Organic Electroluminescent Materials and Devices, ed. S. Miyata and H. S. Nalwa, Gordon & Breach, Amsterdam, 1997