. 2022 Jul 1;149(13):dev200557.
doi: 10.1242/dev.200557. Epub 2022 Jul 8.

Dissecting mechanisms of chamber-specific cardiac differentiation and its perturbation following retinoic acid exposure

Affiliations

Dissecting mechanisms of chamber-specific cardiac differentiation and its perturbation following retinoic acid exposure

David M Gonzalez et al. Development. .

Abstract

The specification of distinct cardiac lineages occurs before chamber formation and acquisition of bona fide atrial or ventricular identity. However, the mechanisms underlying these early specification events remain poorly understood. Here, we performed single cell analysis at the murine cardiac crescent, primitive heart tube and heart tube stages to uncover the transcriptional mechanisms underlying formation of atrial and ventricular cells. We find that progression towards differentiated cardiomyocytes occurs primarily based on heart field progenitor identity, and that progenitors contribute to ventricular or atrial identity through distinct differentiation mechanisms. We identify new candidate markers that define such differentiation processes and examine their expression dynamics using computational lineage trajectory methods. We further show that exposure to exogenous retinoic acid causes defects in ventricular chamber size, dysregulation in FGF signaling and a shunt in differentiation towards orthogonal lineages. Retinoic acid also causes defects in cell-cycle exit resulting in formation of hypomorphic ventricles. Collectively, our data identify, at a single cell level, distinct lineage trajectories during cardiac specification and differentiation, and the precise effects of manipulating cardiac progenitor patterning via retinoic acid signaling.

Keywords: Cardiac development; Cardiac organoid; Cardiac progenitor; Mouse; Retinoic acid; Single cell RNA-sequencing.


Conflict of interest statement

Competing interests R.S. is Vice President of Sema4. Since June 1 2021, M.P.L. has been an employee of Roche. All other authors declare no competing or financial interests.

Figures

Fig. 1.
Fig. 1.
Establishing a transcriptional atlas of early cardiogenesis. (A) Top: schematic showing mating strategy used to generate Foxa2Cre;R26mTmG mice. Bottom: lineage-tracing in Foxa2Cre;R26mTmG embryos (representative of stages sequenced) and dissected heart shows ventricular-specific labeling of cardiac tissues. (B) UMAP clustering of cardiovascular populations. (C) FeaturePlots of key progenitor, cardiomyocyte, epicardium, neural crest and endothelial cell markers used together with DGE to annotate populations presented in B. (D) Heatmap demonstrating top three most differentially expressed genes for broad categories of cell types. (E) Cell cycle phase scoring projected onto UMAP embedding demonstrating preponderance of cardiac progenitors in S phase, with differentiating cell types primarily in G1 and G2/M phase. (F) Contribution from each stage to individual clusters (gray, CC; blue, PHT; orange, HT). Frequency is calculated as the number of cells in a given cluster from one stage relative to the total number of cells in the sample. (G) GO analysis of differentially regulated processes. Color of dot represents adjusted P-value score. Size of dot represents Combined Score given by enrichr. aSHF, anterior second heart field; CM, cardiomyocytes; EC, endothelial/endocardial cell; Epi, epicardium; HP, hematoendothelial progenitor; LPM, lateral plate mesoderm; NC, neural crest; OFT, outflow tract; pSHF, posterior second heart field.
Fig. 2.
Fig. 2.
Using the in vivo transcriptional atlas to annotate cells in mouse and human cardiac organoids. (A) Reproduction of UMAP clustering from mouse gastruloids reported by Rossi et al., 2021 (left), and human cardiac organoids reported by Drakhlis et al., 2021 (right) with author's annotation after subsetting cardiac region. (B) UMAP clustering of organoids, re-annotated following use of a random forest classifier trained on embryonic in vivo scSeq data from Gonzalez, Schrode et al. (C) Breakdown of composition of cluster identities from Rossi et al., 2021 (left) and Drakhlis et al., 2021 (right) with newly assigned identities based on classifier training in this study. AFE, anterior foregut endoderm; AV, atrioventricular; PFE, posterior foregut endoderm; SHF, second heart field.
Fig. 3.
Fig. 3.
Characterization of cardiomyocyte subtypes and corresponding lineage relationships to progenitor cells. (A) RNA velocity demonstrating differentiation relationships within cardiac subsets. (B) Latent time scores overlayed on UMAP clusters. Color indicates inferred developmental time. (C-E) Calculation of predicted transitions (C), velocity vector length (D) and velocity confidence (E). Color indicates velocity length and confidence score, measures of the speed of differentiation and the coherence of the vector field (i.e. how the vector correlates with its neighbors), respectively. (F,I) Subset of pSHF/aSHF differentiation streams (top) with overlaid latent time values (bottom). (G,J) Heatmap of top 300 dynamically regulated genes for pSHF/aSHF differentiation streams with selected candidates highlighted. (H,K) Examples of dynamically regulated genes along the pSHF/aSHF differentiation streams. Top: phase portraits demonstrate ratio of unspliced to spliced transcripts, colored according to cluster population in Fig. 1B. Dotted line represents steady state expression. Bottom: expression dynamics along latent time (right) demonstrate activity of genes across time. aSHF, anterior second heart field; CM, cardiomyocytes; LPM, lateral plate mesoderm; NC, neural crest; OFT, outflow tract; pSHF, posterior second heart field; S, spliced transcript; t, time; u, unspliced transcript.
Fig. 4.
Fig. 4.
Differentiation of second heart field subpopulations occurs through transcriptionally distinct mechanisms. (A) Schematic of clusters analyzed [aSHF differentiating cells (8); pSHF differentiating cells (14)] and KEGG pathway (top) and GO term (bottom) analysis of upregulated and downregulated processes between clusters. Color of dot represents adjusted P-value; size of dot represents number of genes within GO term uncovered by DGE analysis. (B) Feature plots for EGFP and markers of atrial (Stard10) and ventricular (Lbh) identity. (C) Violin plots of selected differentially expressed genes across C8 and C14. (D,E) Dynamically regulated genes during differentiation and identity across LPM/pSHF differentiation stream (C14, D), and across aSHF differentiation stream (C8, E). Phase portraits (top) demonstrate ratio of unspliced to spliced transcripts, colored according to cluster population in Fig. 1B. Dotted line represents steady state expression. Expression dynamics along latent time (bottom) demonstrate activity of genes across time. (F) Differential regulation of Nkx2-5, Ttn, Myl7 and Gata5. Panels for each gene show spliced (x-axis) versus unspliced (y-axis) transcripts (left); expression of specified gene (middle); RNA velocity score based on ratio of unspliced versus spliced transcripts (right), in which positive score (green) indicates upregulation of gene, negative score (red) indicates downregulation of gene. aSHF, anterior second heart field; LPM, lateral plate mesoderm; pSHF, posterior second heart field; S, spliced transcript; t, time; u, unspliced transcript.
Fig. 5.
Fig. 5.
Identification of differentially expressed genes and regulatory networks of atrial and ventricular cells at multiple developmental stages. (A) Schematic of atrial (C4) and ventricular (C2, C17) populations used for pairwise DGE analysis. (B) Volcano plot demonstrating differential expression of ventricular (C17, C2) versus atrial (C4) cells. DGE analysis was performed using negative binomial distribution test in Seurat with P<0.01. (C) Selected upregulated/downregulated GO terms and KEGG pathways in ventricular compared with atrial cells. (D) UMAP clustering of cardiac cell types at the CC stage. (E) Feature plots for key markers. (F) Heatmap demonstrating top five most differentially expressed genes for each cell type. Differentially expressed genes were identified using Wilcoxon rank-sum test with cutoff P-value <0.01. (G) Volcano plot of differential expression across EGFP+/− cells within the CC. (H) Selected upregulated/downregulated GO terms between EGFP+/− cells at the CC. In C and H, color of dot represents adjusted P-value; size of dot represents number of genes within GO term represented in the DGE analysis. ACM, atrial cardiomyocyte; aSHF, anterior second heart field; EC, endothelial/endocardial cell; FHF, first heart field; MP, mesoderm progenitor; pSHF, posterior second heart field; SM, somitic mesoderm; VCM, ventricular cardiomyocyte.
Fig. 6.
Fig. 6.
scRNA-seq following in utero exposure to RA reveals defects in ventricular development and lineage relationships between aSHF and ventricular differentiation. (A) Schematic of RA-exposure model and experimental workflow. (B) Brightfield images of control and in utero-exposed embryos demonstrating dose-dependent effects on heart and head development. (C) Brightfield (top) and lineage-tracing information (bottom) of representative embryos at stages sequenced showing the morphology of RA-induced defect at each stage. (D) UMAP clustering of merged dataset comprising control and RA-exposed embryos. (E) Contribution to each cluster from control (red) and RA samples (teal). Frequency is calculated as total number of cells within cluster, relative to total number of cells within a treatment condition. (F) Bubble plot of selected markers across individual clusters. Color of dot represents the average expression level in each cluster; size of dot represents the percentage of cells in each cluster expressing the gene of interest. (G) Cell cycle score for cell types in control and RA-exposed samples. (H) Left: representative image of surface volume used for visualization of YFP (Foxa2Cre;R26RYFP) population (green) within Nkx2-5 population (red). Right: quantification of percentage YFP volume. Data are mean±s.d. P-value is calculated using the Mann-Whitney test. aSHF, anterior second heart field; AVC, atrioventricular canal; CM, cardiomyocytes; IP, intraperitoneal; LPM, lateral plate mesoderm; OFT, outflow tract; pSHF, posterior second heart field; SHF, second heart field; SV, sinus venosus.
Fig. 7.
Fig. 7.
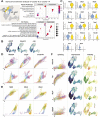
Differential expression analysis of ventricular cells and associated progenitors shows dysregulation in processes related to ventricular development and differentiation. (A) RNA velocity plot demonstrating directionality of differentiation across cell types. (B) Top: selected up- and downregulated GO terms within aSHF. Bottom: selected differentially expressed candidates between control (red) and RA (teal) cells within aSHF. (C) Subclustering of aSHF cell types and derivatives, labeled with original population in A. (D) Contribution of Control and RA-treated embryos to UMAP projection. (E) RNA velocity map of aSHF derivative UMAP projection. (F,G) URD trajectories demonstrating cell state transitions, colored by cell type (F) and condition (G). (H) Expression of characteristic markers across URD trajectory. (I,J) Top: selected up- and downregulated GO terms within myocardial precursor (I) and ventricular cardiomyocytes (J). Bottom: selected differentially expressed candidates between control (red) and RA (teal) cells within myocardial precursor (I) and ventricular cardiomyocytes (J). In B, I and J, color of dot represents adjusted P-value and size of dot represents number of genes within the GO term uncovered by the DGE analysis. aSHF, anterior second heart field; AVC, atrioventricular canal; CM, cardiomyocytes; OFT, outflow tract; pSHF, posterior second heart field; SHF, second heart field; SV, sinus venosus; VCM, ventricular cardiomyocytes.

References

    1. Ai, D., Fu, X., Wang, J., Lu, M.-F., Chen, L., Baldini, A., Klein, W. H. and Martin, J. F. (2007). Canonical Wnt signaling functions in second heart field to promote right ventricular growth. Proc. Natl. Acad. Sci. USA 104, 9319-9324. 10.1073/pnas.0701212104 - DOI - PMC - PubMed
    1. Asp, M., Giacomello, S., Larsson, L., Wu, C., Fürth, D., Qian, X., Wärdell, E., Custodio, J., Reimegård, J., Salmén, F.et al. (2019). A spatiotemporal organ-wide gene expression and cell atlas of the developing human heart. Cell 179, 1647-1660.e19. 10.1016/j.cell.2019.11.025 - DOI - PubMed
    1. Bardot, E., Calderon, D., Santoriello, F., Han, S., Cheung, K., Jadhav, B., Burtscher, I., Artap, S., Jain, R., Epstein, J.et al. (2017a). Foxa2 identifies a cardiac progenitor population with ventricular differentiation potential. Nat. Commun. 8, 14428. 10.1038/ncomms14428 - DOI - PMC - PubMed
    1. Bardot, E., Tzavaras, N., Benson, D. L. and Dubois, N. C. (2017b). Quantitative whole-mount immunofluorescence analysis of cardiac progenitor populations in mouse embryos. J. Vis. Exp. 128, e56446. 10.3791/56446 - DOI - PMC - PubMed
    1. Bardot, E. S., Jadhav, B., Wickramasinghe, N., Rezza, A., Rendl, M., Sharp, A. J. and Dubois, N. C. (2020). Notch signaling commits mesoderm to the cardiac lineage. BioRxiv 2020.02.20.958348. 10.1101/2020.02.20.958348 - DOI

Publication types