. 2022 Jun 10:11:e73645.
doi: 10.7554/eLife.73645.

Sequence and structural conservation reveal fingerprint residues in TRP channels

Affiliations

Sequence and structural conservation reveal fingerprint residues in TRP channels

Deny Cabezas-Bratesco et al. Elife. .

Abstract

Transient receptor potential (TRP) proteins are a large family of cation-selective channels, surpassed in variety only by voltage-gated potassium channels. Detailed molecular mechanisms governing how membrane voltage, ligand binding, or temperature can induce conformational changes promoting the open state in TRP channels are still a matter of debate. Aiming to unveil distinctive structural features common to the transmembrane domains within the TRP family, we performed phylogenetic reconstruction, sequence statistics, and structural analysis over a large set of TRP channel genes. Here, we report an exceptionally conserved set of residues. This fingerprint is composed of twelve residues localized at equivalent three-dimensional positions in TRP channels from the different subtypes. Moreover, these amino acids are arranged in three groups, connected by a set of aromatics located at the core of the transmembrane structure. We hypothesize that differences in the connectivity between these different groups of residues harbor the apparent differences in coupling strategies used by TRP subgroups.

Keywords: MSA; TRP channels; allosterism; evolution; evolutionary biology; structure.


Conflict of interest statement

DC, FM, CC, KZ, DG, VC, JO, SB No competing interests declared

Figures
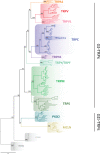
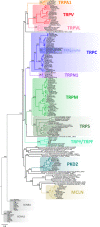
Figure 1.
Figure 1.. Maximum likelihood tree showing relationships among TRP channels.
The scale denotes substitutions per site and colors represent lineages. Numbers on the nodes correspond to support values from the ultrafast bootstrap routine. Potassium voltage-gated channel subfamily A member 2 (KCNA2) and sodium voltage-gated channel alpha subunit 8 (SCN8A) sequences were included as an outgroup. TRP, transient receptor potential.
Figure 1—figure supplement 1.
Figure 1—figure supplement 1.. Maximum likelihood tree showing relationships among TRP channels with species indicated.
Numbers on the nodes correspond to support values from the ultrafast bootstrap routine. The scale denotes substitutions per site and colors represent lineages. Potassium voltage-gated channel subfamily A member 2 (KCNA2) and sodium voltage-gated channel alpha subunit 8 (SCN8A) sequences were included as an outgroup. TRP, transient receptor potential.
Figure 1—figure supplement 2.
Figure 1—figure supplement 2.. Maximum likelihood tree showing relationships among TRP channels and the putative TRPs from unicellular organisms.
Numbers on the nodes correspond to support values from the ultrafast bootstrap routine. The scale denotes substitutions per site and colors represent lineages. Potassium voltage-gated channel subfamily A member 2 (KCNA2), and sodium voltage-gated channel alpha subunit 8 (SCN8A) sequences were included as an outgroup. TRP, transient receptor potential.
Figure 1—figure supplement 3.
Figure 1—figure supplement 3.. Maximum likelihood tree showing relationships among TRP channels and the putative TRPs from unicellular organisms with all species indicated.
Numbers on the nodes correspond to support values from the ultrafast bootstrap routine. The scale denotes substitutions per site and colors represent lineages. Potassium voltage-gated channel subfamily A member 2 (KCNA2) and sodium voltage-gated channel alpha subunit 8 (SCN8A) sequences were included as an outgroup. TRP, transient receptor potential.
Figure 1—figure supplement 4.
Figure 1—figure supplement 4.. Pipeline diagram.
Our analyses begin by pulling TRP sequences from the Uniprot and OMA databases (upper left). From this set of sequences (1615), we handpicked 58 individuals for phylogenetic analysis and produced an initial MSA with the whole set (blue) by using MAFFT (FFTNS1). Knowledge-based feature selection (purple) was implemented to retain only those positions between the pre-TM1 and TDh regions, and then performed another MAFFT (L-INS-I) to produce a new MSA, defined as primary, containing 1481 sequences. From this primary MSA, we identified the fingerprint residues (orange) using two separate analyses, a Fourier analysis and an HMM analysis (bottom-center). From the primary MSA, we used feature selection to create a third and final MSA, the structure MSA (138 structures). The knowledge-based feature selection for this MSA trimmed the positions to include only those within the borders of the individual helices, and nothing in between them. The statistical feature selection removed any positions with a gap frequency above 4%. The sequences in this MSA were all from Uniprot only and were mapped on a residue-by-residue basis to their corresponding PDB structures using a Uniprot-PDB index provided by PFAM. From this sequence-structure map, pairwise cβ-cβ (or cα in the case of glycine) distance matrices were computed, and from these the various distograms (mean, variance, and normalized variance) were computed (orange). These distograms were used to corroborate the existence of the fingerprint residues identified by frequency and HMM Analyses. HMM, hidden Markov model; MSA, multiple sequence alignment; TRP, transient receptor potential.
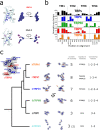
Figure 2.
Figure 2.. Conserved residues in GI-TRPs.
(a) Stacked histogram showing the amino acidic probability in each position of the MAFFT alignment. Gray boxes depict the trans-membrane helices (TM1–TM6) and features such as pre-TM1, the TM4–TM5 linker (L), the Selectivity Filter and Pore Helix (SF&PH) and the TRP domain helix (TDH). Numbers over the arrows indicate the position in the alignment, and in brackets the corresponding position in the rat TRPV1 primary sequence. (b) Sequence logos for the TRP family, depicting highly conserved residues (>90% identity). (c) Upper: Cartoon of a TRP channel monomer depicting the location of conserved residues in the secondary structure. Φ denotes six carbon aromatic residues (i.e., Tyr or Phe). Bottom: Table summarizing the highly conserved positions in alignment and in the corresponding position in the rat TRPV1 primary sequence, along with the percentage of identity. Consensus residues for each subfamily are indicated. The last column corresponds to the total number of fingerprint residues for each subfamily. Green residues correspond to identities while black represents homology. Red shades denote non-conserved residues. TRP, transient receptor potential.
Figure 2—figure supplement 1.
Figure 2—figure supplement 1.. Stacked histograms showing the amino acid frequency in each position on the MAFFT alignment for the different TRP subgroups.
Gray boxes depict the trans-membrane helices (TM1–TM6) and features like pre-TM1, the TM4–TM5 linker (L), the Selectivity Filter and Pore Helix (SF&PH) and the TRP domain helix (TDH). Numbers over the arrows localize the position in the alignment, and in brackets the corresponding position in the rat TRPV1 primary sequence. TRP, transient receptor potential.
Figure 2—figure supplement 2.
Figure 2—figure supplement 2.. Different strategies of alignment reveal the same highly conserved residues.
(a) Stacked histograms showing the amino acidic probability in each position on the MAFFT alignment. Gray boxes depict the trans-membrane helices (TM1–TM6) and features such as pre-TM1, the TM4–TM5 linker (L), the Selectivity Filter and Pore Helix (SF&PH) and the TRP domain helix (TDH). Numbers over the arrows localize the position in the respective alignment, and in brackets the corresponding position in the rat TRPV1 primary sequence. (b) Shannon entropy of the amino acid distribution corresponding to each position in the alignment; the calculation is carried out using the emission probabilities from a hidden Markov model trained on the multiple sequence alignment. Low entropy values indicate conserved positions. TRP, transient receptor potential.
Figure 2—figure supplement 3.
Figure 2—figure supplement 3.. Sequence logos for the TRP family and the analyzed subfamilies, depicting highly conserved residues (>90% identity) for the MAFFT alignment.
TRP, transient receptor potential.
Figure 3.
Figure 3.. Spatial distribution of TRP channel signature residues.
(a) Conservation rates for each position in the alignment, calculated on Consurf (see Materials and methods), mapped on rTRPV1 structure (PDB: 7LP9) (b) Highly conserved (>90%) residues are arranged in three well-defined patches, highlighted as insets and dubbed P1, P2, and P3. The structural data and residue numbering corresponds to rat TRPV1 (PDB: 7LP9). For clarity, only one protomer is shown. Backbone and residues follow the code color used in Figure 2b. 4–5L: TM4–TM5 linker; SF&PH: selectivity filter and pore helix; TRPh: TRP helix. (c) Structural alignment performed over representative channels (rTRPV1, PDB:7LP9; mTRPC5, PDB:6AEI; pmTRPM8, PDB: 6O6A; hTRPA1, PDB:3J9P; dmTRPN1, PDB:5VKQ; CrTRP1, PDB:6PW4) reveals a consistency in the position of signature residues. (d, e) Distogram of mean distances (d) and normalized variance of mean distances (e) between pair of residues on transmembrane segments, revealing the proximity of signature residues of same patches (brighter areas in (d)) and the low variability on the distances of the same pairs (brighter areas in (e)). Blue, green, and red lines identify the P1, P2, and P3 residues, respectively, and squares locate the intersection between these residues. TRP, transient receptor potential.
Figure 3—figure supplement 1.
Figure 3—figure supplement 1.. Position of signature residues in structural alignment.
By mapping the signature residues in the structural alignment released in Huffer et al., 2020, we further confirmed the high level of conservation in the 3D position of the signature residues. Red letters identify residues with different identities compared with the signature. Red and blue shade boxes depict a shift to amino or carboxyl direction with respect to white boxes in the structural alignment. These shifts arouse from displacements throughout the helix axis or its rotation in each particular structure. In 87.8% of the structures, it is necessary to use one-position shift to help coincide with the alignment of primary sequences. In yellow are the positions where there are no aligned residues (gap).
Figure 3—figure supplement 2.
Figure 3—figure supplement 2.. Coevolution analysis.
Residue pairs with high coevolution scores (top 5%) are connected by red lines. Coevolution scores were calculated using an asymmetric pseudo-likelihood maximization direct coupling analysis algorithm (aplmDCA). Signature residues are drawn in blue licorice representation (rTRPV1, PDB: 7LP9; paTRPM8, PDB:6O6A; mTRPC5, PDB:6AEI).
Figure 3—figure supplement 3.
Figure 3—figure supplement 3.. Stacked histograms showing the amino acidic probability in each position on MAFFT alignment.
(a) Complete sequence histogram. (b). Parsed alignment used for building distance matrices. The parsed alignment contains highly conserved residues with a gap frequency<0.01. Gray boxes depict the trans-membrane helices (TM1–TM6) and features like pre-TM1, the TM4–TM5 linker (L), the Selectivity Filter and Pore Helix (SF&PH) and the TRP domain helix (TDH). Numbers over the arrows localize the position in the respective dataset, and in brackets the corresponding position in the rat TRPV1 primary sequence. TRP, transient receptor potential.
Figure 3—figure supplement 4.
Figure 3—figure supplement 4.. Fingerprint residues remain at close distance.
(a) Frequency histogram depicting the distribution of pairwise distances in all analyzed structures for all the residues analyzed in the distograms (black) and also the fingerprint residues (red). (b) Individual frequency histograms for the mean distances depicted in the distogram presented in Figure 3d.
Figure 4.
Figure 4.. Aromatic residue distribution in LBD.
(a) Aromatic residues facing the internal space shared by the four first transmembrane helices (core). The interacting aromatic (distance<5A) in rTRV1 (PDB:7LP9) and rKv1.2 (PDB:2R9R) are depicted in blue. In violet residues with no other aromatic at <5A. Right: surface representation of the sidechain of aromatic residues shown as licorice in the left. (b) Histogram of aromatic residues in the alignment, on the positions facing the core. At the bottom are depicted the positions in the alignment, and a (+1) or (–1) indicates that in one of the subfamilies the aromatic is immediately after or before the labeled position (shared for the rest of the subfamilies). (c) Comparison between AC volumes presented next to a schematic view of the topology obtained in our phylogenetic analysis. Blue: aromatic residues >50% conserved in the respective subfamily; red: aromatic residues >50% conserved in the respective subfamily and signature residue; black: not conserved residue present in the used structure; orange: not aromatic residue in the used structure, but present as an aromatic in >50% in the respective subfamily. Inset: Aromatic core in rTRPV1. The specific positions of the aromatics are indicated. Used structures: rTRPV1, PDB:7LP9; mTRPC5, PDB:6AEI; pmTRPM8, PDB: 6O6A; hTRPA1, PDB:3J9P; CrTRP1, PDB:6PW4; mTPC1, PDB:6C96. AC, aromatic core; LBD, ligand-binding domain.
Figure 4—figure supplement 1.
Figure 4—figure supplement 1.. Characterization of aromatic core.
(a) Upper: Histogram of the number of aromatic residues contained in the bigger cluster of each structure, fitted to a Gaussian function (center at x=6.78 and width=2.87). Bottom: Average size of the core per subfamily. Graph shows means ± SEM. The size sample for each subfamily depends on the structure files availability (TRPs n=128; TRPA n=8; TRPC n=10; TRPM n=28; TRPV n=80) (b) Upper: Table of size of the larger cluster on non-TRP channels. Bottom: Hatch pattern showing the threshold of p<0.05 for the fitted Gaussian curve. TRP, transient receptor potential.
Figure 4—figure supplement 2.
Figure 4—figure supplement 2.. Distograms of mean distances and normalized variance of mean distances between pairs of residues within the TM1–TM4 region.
(a) Mean distance and variance distograms obtained for pan-TRP. (b) Frequency histogram for pairwise distances in all analyzed structures highlighting the AC residues (colored bars). (c–e) Distograms corresponding to TRPV, TRPC, and TRPM subgroups. Blue lines depict the position of the conserved aromatics (>50%) for each subfamily. (f–h) Individual frequency histograms for the pairwise distances depicted in the corresponding insets and the distgrams (c–e). AC, aromatic core; TRP, transient receptor potential.
Figure 5.
Figure 5.. The AC connects to aromatics in P2 from neighboring subunits.
(a) A conserved intermolecular connection between residues (licorice) in helices at opposite faces to the AC (gray surface) and P2 (yellow surface). Inset: Upper view of residues establishing the inter-subunit interaction (rTRPV1, PDB:7LP9). (b) Sequence logos showing the position of residues involved in the putative intermolecular interaction in blue, and the fourth signature residue in orange. AC, aromatic core.
Figure 5—figure supplement 1.
Figure 5—figure supplement 1.. Inter-subunit interaction is conserved in subfamilies.
(a) Residues connecting TM4 and TM5 from neighboring subunits align on the same position in TM4 and at one or two positions from the fourth signature residue in TM5. (b) Lateral view of the interaction between LBD and PD from different subunits for two channels from different subfamilies. LBD, ligand-binding domain; PD, pore domain.
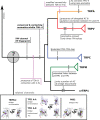
Figure 6.
Figure 6.. Conserved modifications observed in TRP proteins.
The different channels studied in this work are presented next to a schematic view of the topology obtained in our phylogenetic analysis. Unique TRP features are highlighted. Previous observations confirmed here are indicated in pink shades. Novel observations from the present work are indicated in gray shades. Lines represent presence while crosses represent absence or loss. TRP, transient receptor potential.

Similar articles

Cited by

References

    1. Altenhoff AM, Glover NM, Train C-M, Kaleb K, Warwick Vesztrocy A, Dylus D, de Farias TM, Zile K, Stevenson C, Long J, Redestig H, Gonnet GH, Dessimoz C. The OMA orthology database in 2018: retrieving evolutionary relationships among all domains of life through richer web and programmatic interfaces. Nucleic Acids Research. 2018;46:D477–D485. doi: 10.1093/nar/gkx1019. - DOI - PMC - PubMed
    1. Altenhoff AM, Train C-M, Gilbert KJ, Mediratta I, Mendes de Farias T, Moi D, Nevers Y, Radoykova H-S, Rossier V, Warwick Vesztrocy A, Glover NM, Dessimoz C. OMA orthology in 2021: website overhaul, conserved isoforms, ancestral gene order and more. Nucleic Acids Research. 2021;49:D373–D379. doi: 10.1093/nar/gkaa1007. - DOI - PMC - PubMed
    1. Altschul SF, Gish W, Miller W, Myers EW, Lipman DJ. Basic local alignment search tool. Journal of Molecular Biology. 1990;215:403–410. doi: 10.1016/S0022-2836(05)80360-2. - DOI - PubMed
    1. Arias-Darraz L, Colenso CK, Veliz LA, Vivar JP, Cardenas S, Brauchi S. A TRP conductance modulates repolarization after sensory-dependent depolarization in Chlamydomonas reinhardtii. Plant Signaling & Behavior. 2015;10:e1052924. doi: 10.1080/15592324.2015.1052924. - DOI - PMC - PubMed
    1. Autzen HE, Myasnikov AG, Campbell MG, Asarnow D, Julius D, Cheng Y. Structure of the human TRPM4 ion channel in a lipid nanodisc. Science (New York, N.Y.) 2018;359:228–232. doi: 10.1126/science.aar4510. - DOI - PMC - PubMed

Publication types

MeSH terms

Substances