

Exploring the Conformational and Binding Dynamics of HMGA2·DNA Complexes Using Trapped Ion Mobility Spectrometry-Mass Spectrometry
- PMID: 35687119
- PMCID: PMC9280850
- DOI: 10.1021/jasms.2c00101
Exploring the Conformational and Binding Dynamics of HMGA2·DNA Complexes Using Trapped Ion Mobility Spectrometry-Mass Spectrometry
Abstract
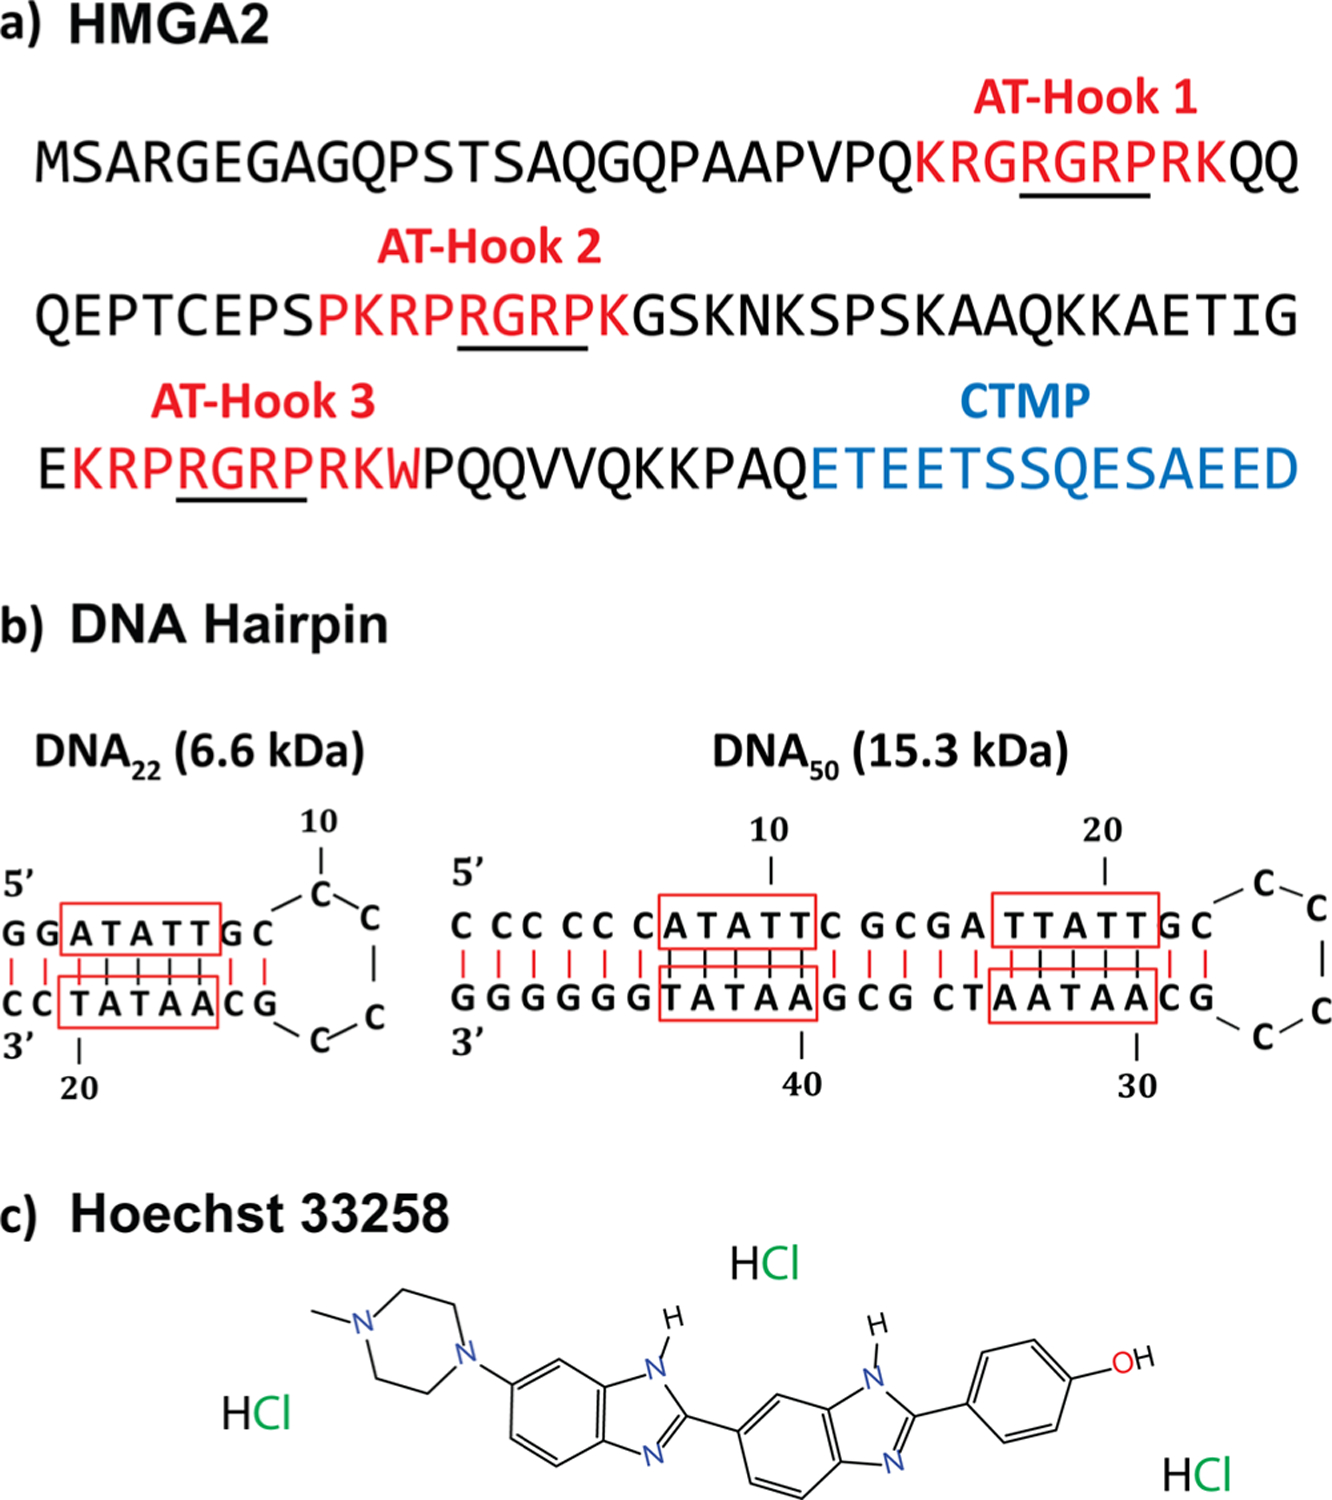
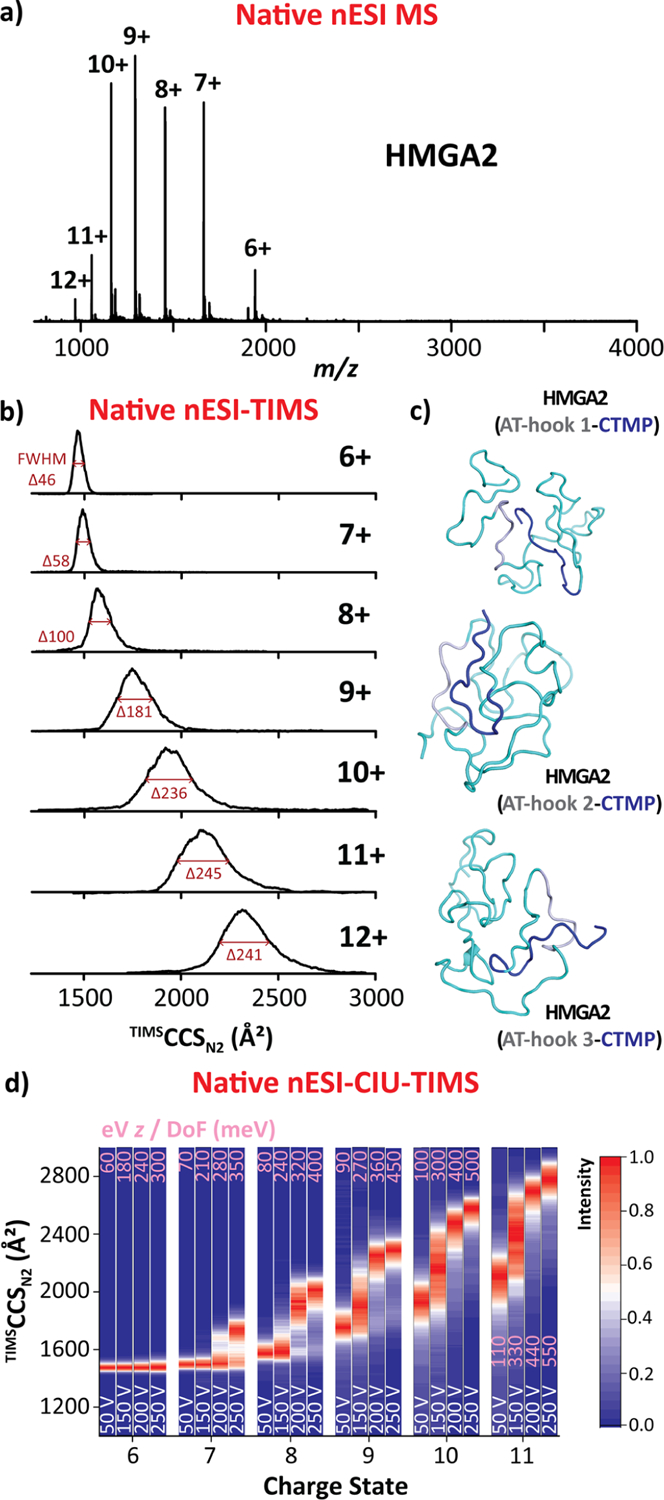
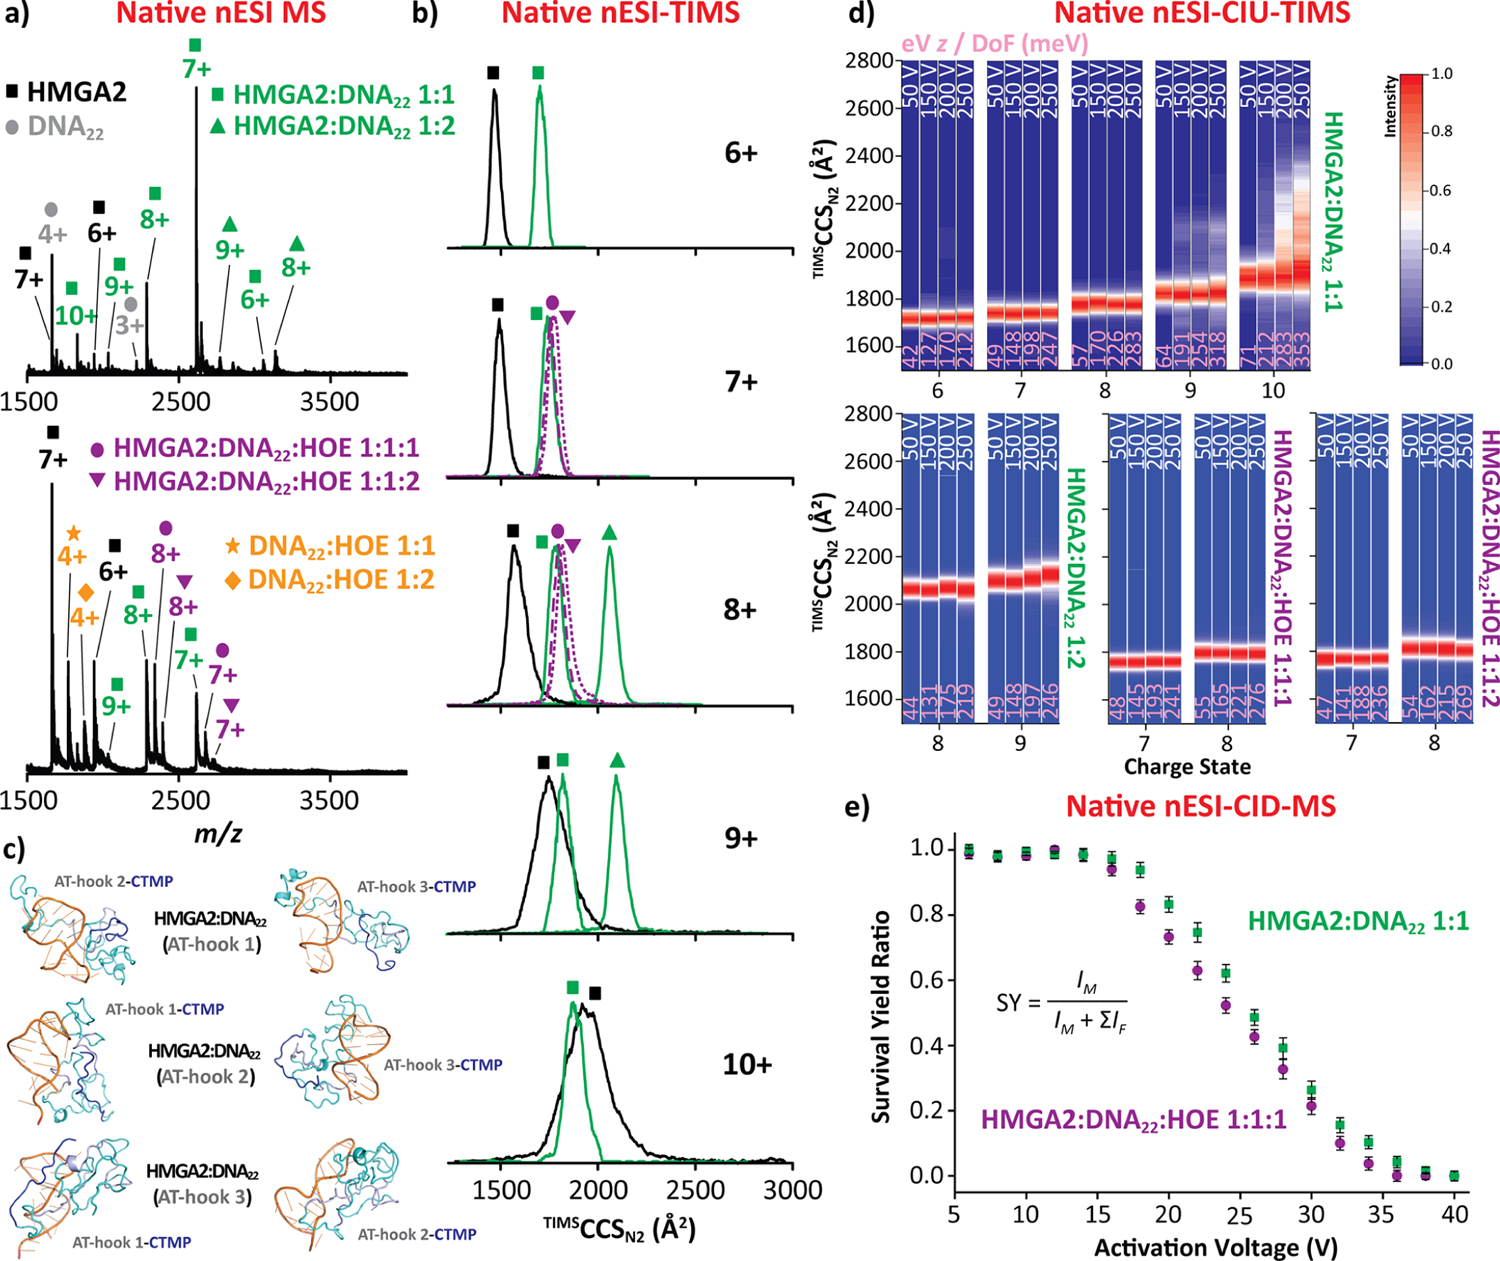
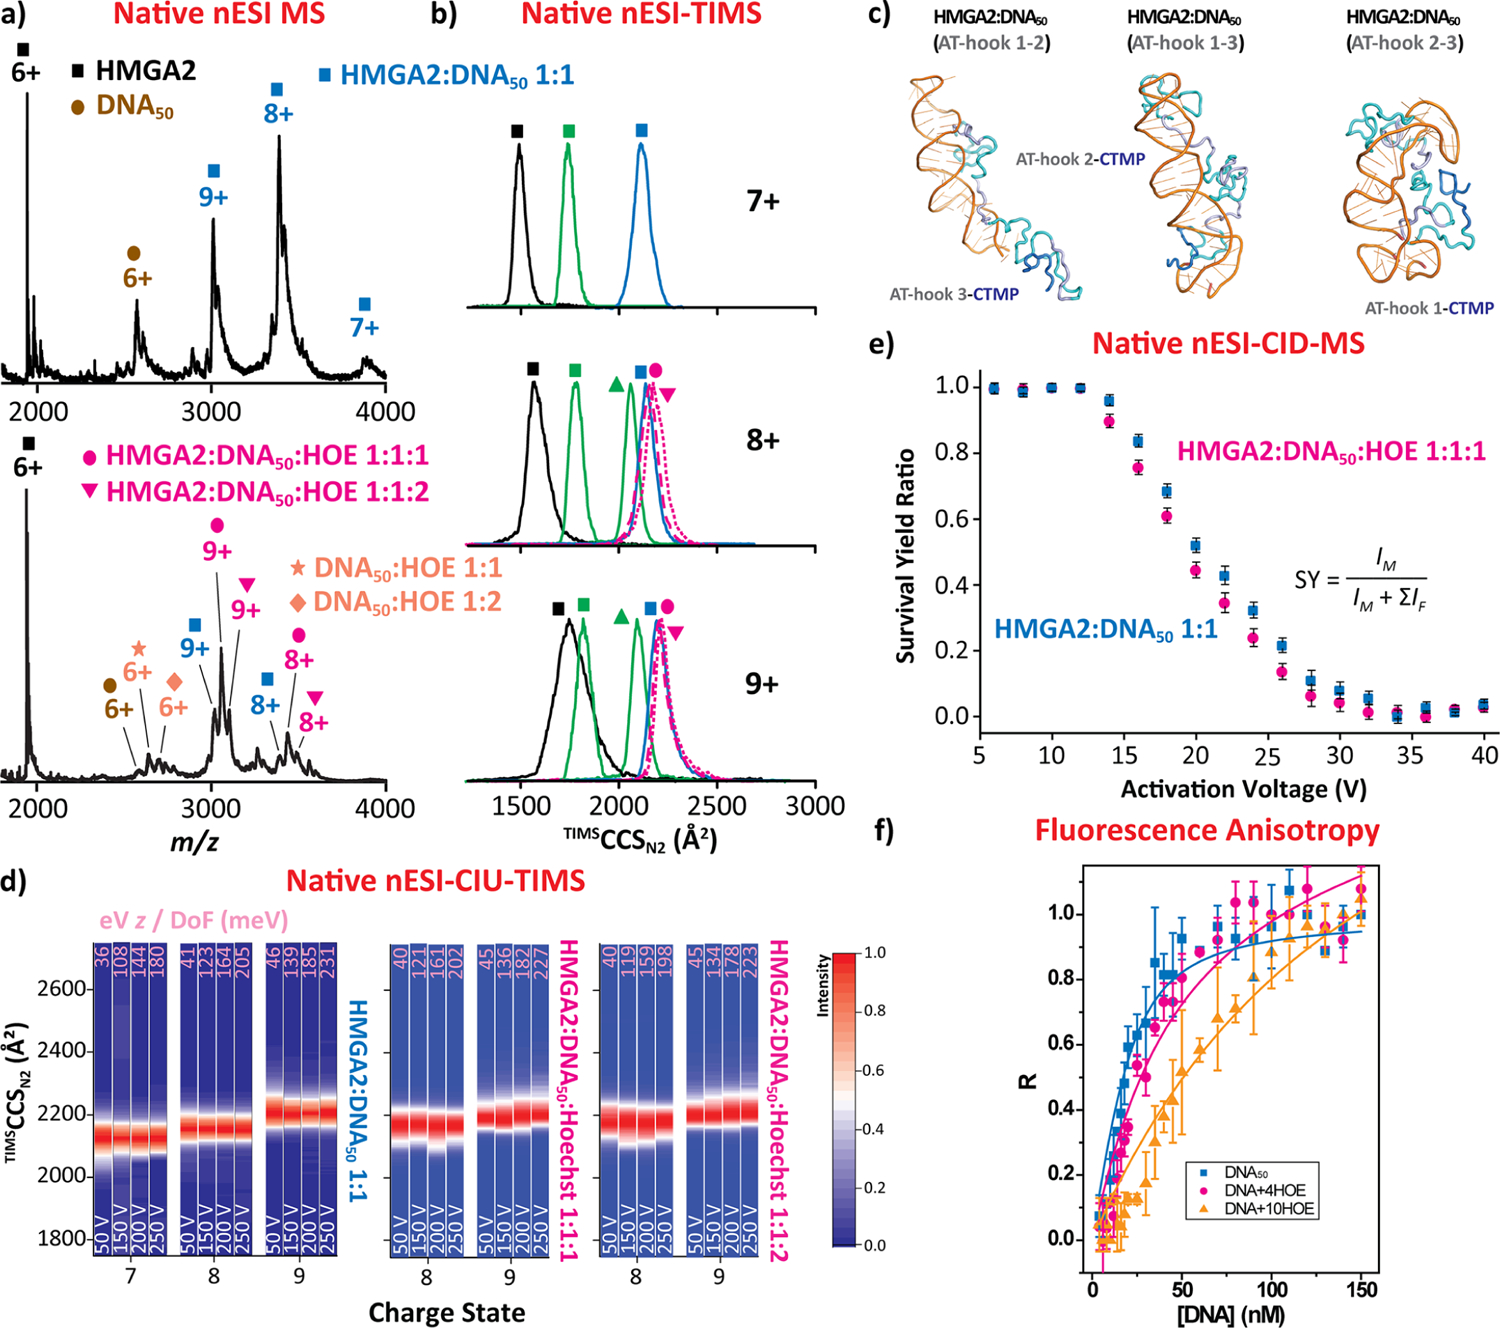
The mammalian high mobility group protein AT-hook 2 (HMGA2) is an intrinsically disordered DNA-binding protein expressed during embryogenesis. In the present work, the conformational and binding dynamics of HMGA2 and HMGA2 in complex with a 22-nt (DNA22) and a 50-nt (DNA50) AT-rich DNA hairpin were investigated using trapped ion mobility spectrometry-mass spectrometry (TIMS-MS) under native starting solvent conditions (e.g., 100 mM aqueous NH4Ac) and collision-induced unfolding/dissociation (CIU/CID) as well as solution fluorescence anisotropy to assess the role of the DNA ligand when binding to the HMGA2 protein. CIU-TIMS-CID-MS/MS experiments showed a significant reduction of the conformational space and charge-state distribution accompanied by an energy stability increase of the native HMGA2 upon DNA binding. Fluorescence anisotropy experiments and CIU-TIMS-CID-MS/MS demonstrated for the first time that HMGA2 binds with high affinity to the minor groove of AT-rich DNA oligomers and with lower affinity to the major groove of AT-rich DNA oligomers (minor groove occupied by a minor groove binder Hoechst 33258). The HMGA2·DNA22 complex (18.2 kDa) 1:1 and 1:2 stoichiometry suggests that two of the AT-hook sites are accessible for DNA binding, while the other AT-hook site is probably coordinated by the C-terminal motif peptide (CTMP). The HMGA2 transition from disordered to ordered upon DNA binding is driven by the interaction of the three basic AT-hook residues with the minor and/or major grooves of AT-rich DNA oligomers.
Conflict of interest statement
The authors declare no competing financial interest.
Figures
Similar articles
-
AT-hook peptides bind the major and minor groove of AT-rich DNA duplexes.Nucleic Acids Res. 2022 Mar 21;50(5):2431-2439. doi: 10.1093/nar/gkac115. Nucleic Acids Res. 2022. PMID: 35212375 Free PMC article.
-
Peptide Sequence Influence on the Conformational Dynamics and DNA binding of the Intrinsically Disordered AT-Hook 3 Peptide.Sci Rep. 2018 Jul 17;8(1):10783. doi: 10.1038/s41598-018-28956-z. Sci Rep. 2018. PMID: 30018295 Free PMC article.
-
The Mammalian High Mobility Group Protein AT-Hook 2 (HMGA2): Biochemical and Biophysical Properties, and Its Association with Adipogenesis.Int J Mol Sci. 2020 May 25;21(10):3710. doi: 10.3390/ijms21103710. Int J Mol Sci. 2020. PMID: 32466162 Free PMC article. Review.
-
Energetics of binding the mammalian high mobility group protein HMGA2 to poly(dA-dT)2 and poly(dA)-poly(dT).J Mol Biol. 2005 Sep 23;352(3):629-45. doi: 10.1016/j.jmb.2005.07.048. J Mol Biol. 2005. PMID: 16109425
-
Ion mobility-mass spectrometry as a tool to investigate protein-ligand interactions.Anal Bioanal Chem. 2017 Jul;409(18):4305-4310. doi: 10.1007/s00216-017-0384-9. Epub 2017 May 13. Anal Bioanal Chem. 2017. PMID: 28500372 Review.
Cited by
-
Accessing Different Protein Conformer Ensembles with Tunable Capillary Vibrating Sharp-Edge Spray Ionization.J Phys Chem B. 2025 Feb 6;129(5):1626-1639. doi: 10.1021/acs.jpcb.4c04842. Epub 2025 Jan 29. J Phys Chem B. 2025. PMID: 39878076 Free PMC article.
-
Enhancing the Depth of Analyses with Next-Generation Ion Mobility Experiments.Annu Rev Anal Chem (Palo Alto Calif). 2023 Jun 14;16(1):27-48. doi: 10.1146/annurev-anchem-091522-031329. Epub 2023 Mar 31. Annu Rev Anal Chem (Palo Alto Calif). 2023. PMID: 37000959 Free PMC article. Review.
-
Exploring the Conformations and Binding Location of HMGA2·DNA Complexes Using Ion Mobility Spectrometry and 193 nm Ultraviolet Photodissociation Mass Spectrometry.J Am Soc Mass Spectrom. 2022 Jul 6;33(7):1092-1102. doi: 10.1021/jasms.2c00083. Epub 2022 Jun 10. J Am Soc Mass Spectrom. 2022. PMID: 35687872 Free PMC article.
-
Inhibition of HMGA2 binding to AT-rich DNA by its negatively charged C-terminus.Nucleic Acids Res. 2025 Jan 24;53(3):gkaf035. doi: 10.1093/nar/gkaf035. Nucleic Acids Res. 2025. PMID: 39873271 Free PMC article.
-
Charging of DNA Complexes in Positive-Mode Native Electrospray Ionization Mass Spectrometry.J Am Soc Mass Spectrom. 2024 Dec 4;35(12):3157-3162. doi: 10.1021/jasms.4c00335. Epub 2024 Oct 17. J Am Soc Mass Spectrom. 2024. PMID: 39417657 Free PMC article.
References
-
- Zhou X; Benson KF; Ashar HR; Chada K Mutation responsible for the mouse pygmy phenotype in the developmentally regulated factor HMGI-C. Nature 1995, 376 (6543), 771–774. - PubMed
-
- Chung J; Zhang X; Collins B; Sper RB; Gleason K; Simpson S; Koh S; Sommer J; Flowers WL; Petters RM; Piedrahita JA High mobility group A2 (HMGA2) deficiency in pigs leads to dwarfism, abnormal fetal resource allocation, and cryptorchidism. Proc. Natl. Acad. Sci. U.S.A 2018, 115 (21), 5420–5425. - PMC - PubMed
-
- Weedon MN; Lettre G; Freathy RM; Lindgren CM; Voight BF; Perry JR; Elliott KS; Hackett R; Guiducci C; Shields B; Zeggini E; Lango H; Lyssenko V; Timpson NJ; Burtt NP; Rayner NW; Saxena R; Ardlie K; Tobias JH; Ness AR; Ring SM; Palmer CN; Morris AD; Peltonen L; Salomaa V; Diabetes Genetics; Davey Smith G; Wellcome Trust Case Control; Groop, L. C.; Hattersley AT; McCarthy MI; Hirschhorn JN; Frayling TM A common variant of HMGA2 is associated with adult and childhood height in the general population. Nat. Genet 2007, 39 (10), 1245–1250. - PMC - PubMed
MeSH terms
Substances
Grants and funding
LinkOut - more resources
Full Text Sources
Research Materials
