Observational Study
. 2022 Jun 10;17(6):e0268547.
doi: 10.1371/journal.pone.0268547. eCollection 2022.

Subtyping of common complex diseases and disorders by integrating heterogeneous data. Identifying clusters among women with lower urinary tract symptoms in the LURN study

Affiliations
Observational Study

Subtyping of common complex diseases and disorders by integrating heterogeneous data. Identifying clusters among women with lower urinary tract symptoms in the LURN study

Victor P Andreev et al. PLoS One. .

Abstract

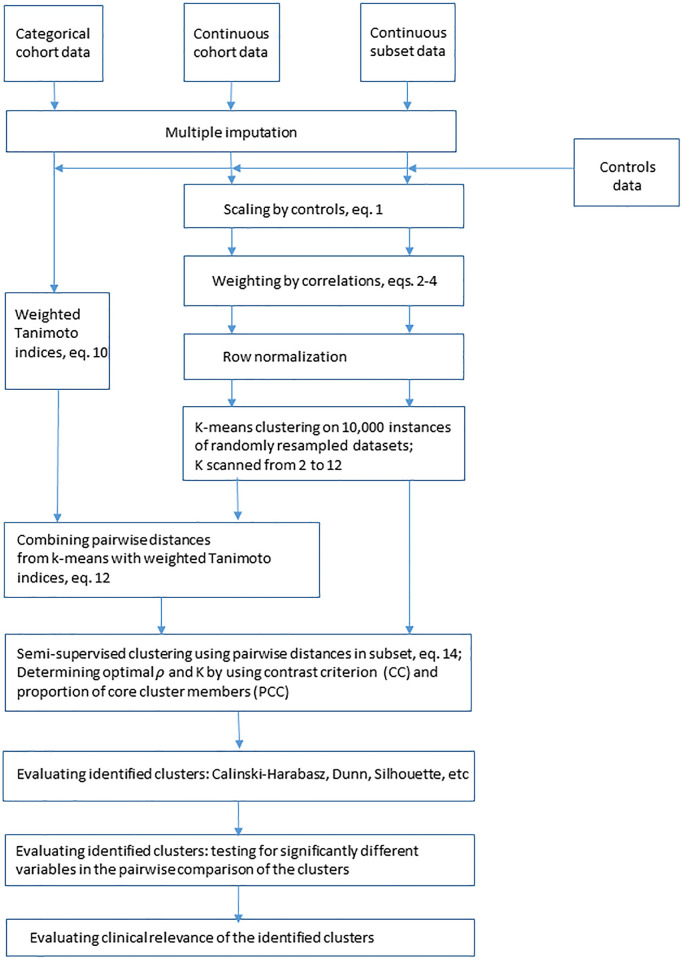
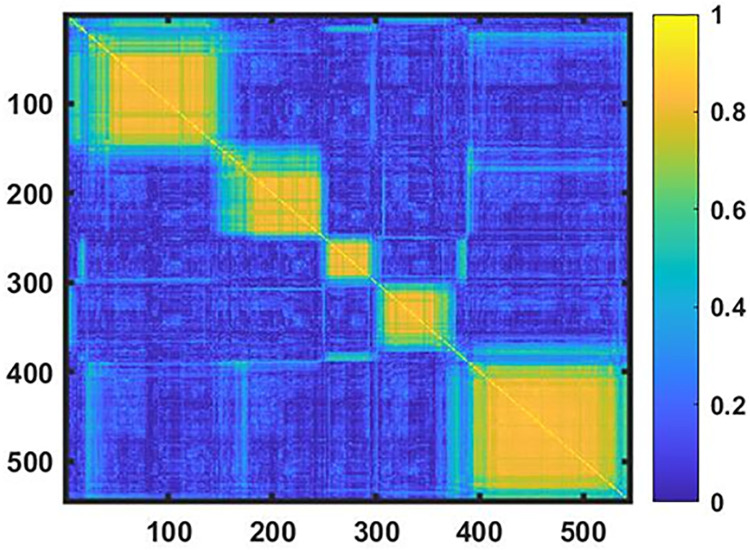
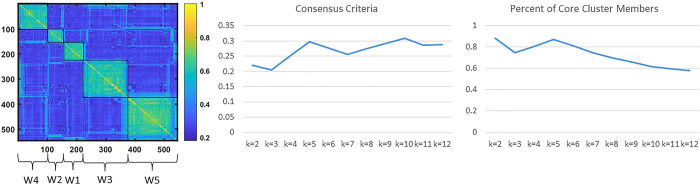
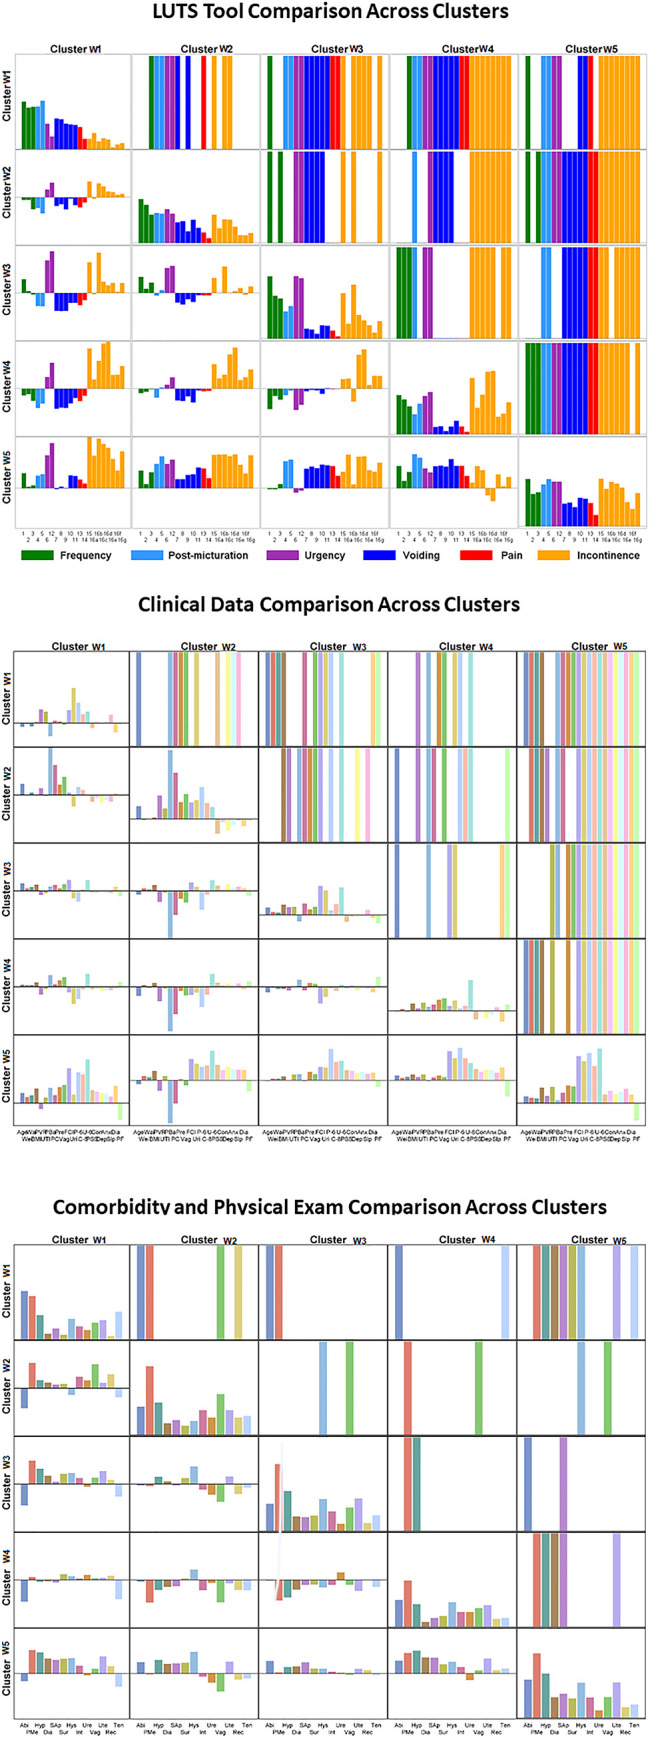
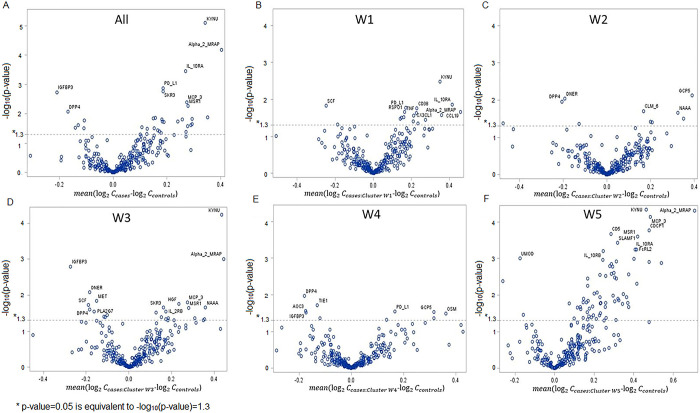
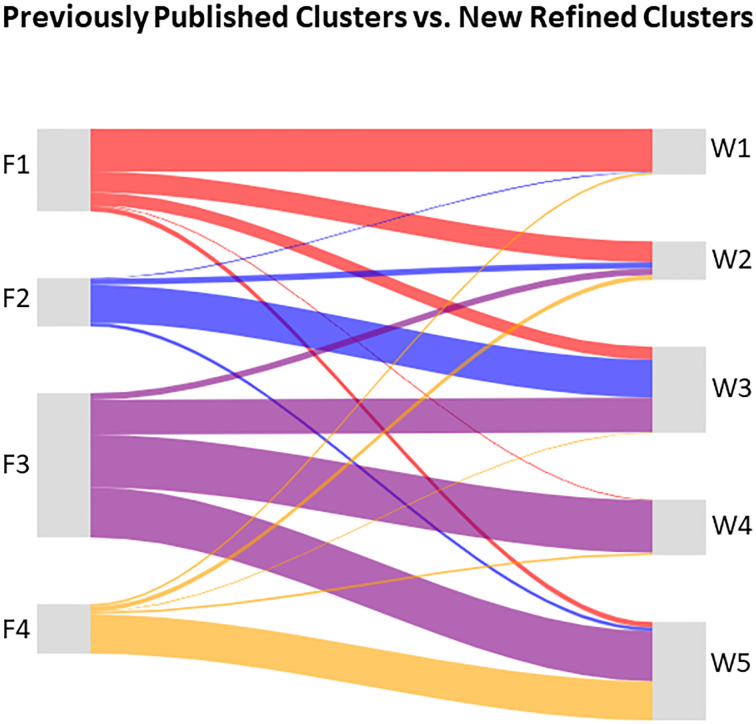
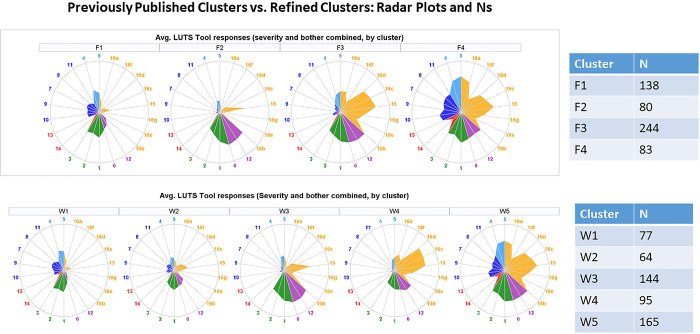
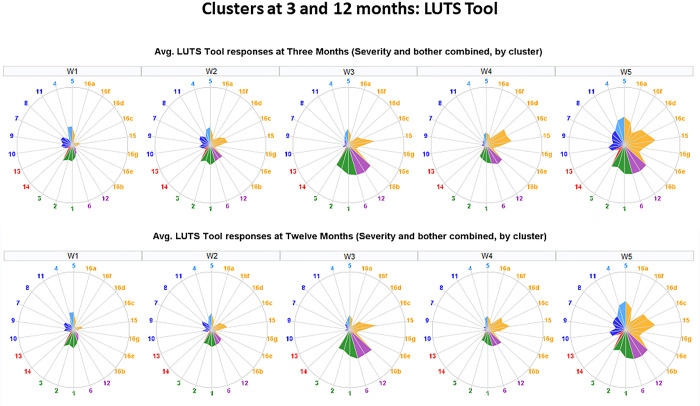
We present a methodology for subtyping of persons with a common clinical symptom complex by integrating heterogeneous continuous and categorical data. We illustrate it by clustering women with lower urinary tract symptoms (LUTS), who represent a heterogeneous cohort with overlapping symptoms and multifactorial etiology. Data collected in the Symptoms of Lower Urinary Tract Dysfunction Research Network (LURN), a multi-center observational study, included self-reported urinary and non-urinary symptoms, bladder diaries, and physical examination data for 545 women. Heterogeneity in these multidimensional data required thorough and non-trivial preprocessing, including scaling by controls and weighting to mitigate data redundancy, while the various data types (continuous and categorical) required novel methodology using a weighted Tanimoto indices approach. Data domains only available on a subset of the cohort were integrated using a semi-supervised clustering approach. Novel contrast criterion for determination of the optimal number of clusters in consensus clustering was introduced and compared with existing criteria. Distinctiveness of the clusters was confirmed by using multiple criteria for cluster quality, and by testing for significantly different variables in pairwise comparisons of the clusters. Cluster dynamics were explored by analyzing longitudinal data at 3- and 12-month follow-up. Five clusters of women with LUTS were identified using the developed methodology. None of the clusters could be characterized by a single symptom, but rather by a distinct combination of symptoms with various levels of severity. Targeted proteomics of serum samples demonstrated that differentially abundant proteins and affected pathways are different across the clusters. The clinical relevance of the identified clusters is discussed and compared with the current conventional approaches to the evaluation of LUTS patients. The rationale and thought process are described for the selection of procedures for data preprocessing, clustering, and cluster evaluation. Suggestions are provided for minimum reporting requirements in publications utilizing clustering methodology with multiple heterogeneous data domains.


Conflict of interest statement

The authors have declared that no competing interests exist.

Figures

Fig 1
Fig 1. Flowchart of the pipeline for subtyping of a common complex disease or disorder by integrating heterogeneous data as used for subtyping of LUTS.
Three types of data are imputed. Continuous variables are scaled using controls, weighted, normalized, and then clustered using consensus k-means clustering. Categorical data is transformed into binary and then clustered using weighted Tanimoto indices approach. Matrices of pairwise distances for three types of data are then integrated to maximize contrast criterion (CC) and proportion of core cluster members (PCC). Identified clusters are evaluated using several clustering criteria and testing for significantly different variables in the pairwise comparison of the clusters.
Fig 2
Fig 2. Consensus matrix.
Consensus (545x 545) matrix is presented as a heat map, where the probabilities Mnq for each pair of participants to be in the same cluster are shown by color-coded elements; bright yellow represents probability close to one and dark blue probability close to zero. Five yellow squares along the diagonal represent 5 clusters of participants with LUTS.
Fig 3
Fig 3. Determination of the optimal number of refined clusters.
(A) Consensus matrix heat map demonstrates five clusters of participants (named W1-W5) grouped together based on the pairwise distances Gnq (Eq 14). (B) Contrast criterion (CC Eq 15) for K = 2,…,12. (C) Proportion of core cluster members (PCC Eq 16) for K = 2,…12. Both CC and PCC have maxima at K = 5, justifying the selection of five clusters.
Fig 4
Fig 4. Radar plots illustrating mean values of urinary symptoms, demographics, clinical measurements, non-urinary PROs, comorbidities, and bladder diary variables for identified five clusters of women with LUTS.
First row–urinary symptoms (LUTS Tool). Second row–clinical, non-urologic PRO, and demographic variables. Third row–comorbidities and anomalies identified by physical examination. Fourth row- bladder diary variables. Urinary symptoms are color-coded: Green = frequency; blue = post-micturition; purple = urgency; dark blue = voiding; red = pain; orange = incontinence.
Fig 5
Fig 5. Results of the pairwise comparison of clusters W1-W5.
(A) LUTS Tool variables. (B) Demographic and clinical variables. (C) Physical examination and comorbidities data. Boxes above the diagonal demonstrate significantly different variables in the pairwise comparison of the clusters. Each colored bar represents a significantly different variable. Boxes on diagonal are similar to radar plots and demonstrate the “signatures” of the clusters. Boxes below diagonal present the difference in the values of variables for each pair of clusters. Clusters are distinct and significantly different, not only by their urinary symptom signatures, but by multiple non-urologic variables, and comorbidities as well.
Fig 6
Fig 6. Volcano plots demonstrating differentially abundant proteins in women with LUTS vs. controls for 230 participants representing.
(A) the whole cohort; and (B-F) for each of identified clusters W1-W5. Volcano plots allow for identification and visual representation of the differences in the data sets. Each small circle on volcano plots (A-F) represents mean abundance of one of 276 proteins in women with LUTS compared to non-LUTS controls. Horizontal axis represents mean fold-change on the logarithmic scale, while vertical axis represents p-value on the logarithmic scale. The higher the circle, the more significantly different its abundances in LUTS versus controls. The further the circle from zero on the horizontal axis, the larger the fold-change.
Fig 7
Fig 7. Sankey diagram comparing cluster memberships in W1-W5 and F1-F4.
Cluster memberships in the refined cluster W1-W5 and previously published [41] urinary symptom-based clusters F1-F4 are compared. The new cluster W2 emerged, in which urinary symptoms are complicated by the presence of anterior vaginal wall prolapse. See text for more details on cluster comparison and properties of refined clusters W1-W5.
Fig 8
Fig 8. Comparison of radar plots of the urinary symptom signatures for clusters W1-W5 and F1-F4.
Urinary symptom signatures (shapes of the radar plots) demonstrate pairwise similarities between the clusters F1-W1, F2-W3, F3-W4, F4-W5.
Fig 9
Fig 9. Evolution of the urinary symptom signatures in 3- and 12-month follow-up.
First row–urinary symptom signatures for members of clusters W1-W5 at 3-month visit. Second row–urinary symptom signatures for members of clusters W1-W5 at 12-month visit. Note that the shape of the radar plots is conserved (similar to the radar plots in Figs 4 and 8), while the area of the radar plots is decreased due to symptoms improvement in some of the patients shown in Table 6.

Similar articles

Cited by

References

    1. Schadt EE, Lum PY. Reverse engineering gene networks to identify key drivers of complex disease phenotypes. J Lipid Res. 2006;47:2601–2613. doi: 10.1194/jlr.R600026-JLR200 - DOI - PubMed
    1. Becker KG. The common variants/multiple disease hypothesis of common complex genetic disorders. Medical Hypothesis. 2004;62:309–317. doi: 10.1016/S0306-9877(03)00332-3 - DOI - PubMed
    1. Relton CL, Davey Smith G. Epigenetic epidemiology of common complex disease: prospects for prediction, prevention, and treatment. PLoS Med. 2010;7(10):e1000356. doi: 10.1371/journal.pmed.1000356 - DOI - PMC - PubMed
    1. Coyne KS, Sexton CC, Thompson CL, Milsom I, Irwin D, Kopp ZS, et al.. The prevalence of lower urinary tract symptoms (LUTS) in the USA, the UK and Sweden: results from the Epidemiology of LUTS (EpiLUTS) study. BJU Int. 2009;104(3):352–360. doi: 10.1111/j.1464-410X.2009.08427.x - DOI - PubMed
    1. Irwin DE, Milsom I, Hunskaar S, Reilly K, Kopp Z, Herschorn S, et al.. Population-based survey of urinary incontinence, overactive bladder, and other lower urinary tract symptoms in five countries: results of the EPIC study. Eur Urol. 2006;50(6):1306–1314; discussion 1314–1305. doi: 10.1016/j.eururo.2006.09.019 - DOI - PubMed

Publication types