Review
. 2022 Oct;22(19-20):e2100256.
doi: 10.1002/pmic.202100256. Epub 2022 Jun 22.

Recent advances in isobaric labeling and applications in quantitative proteomics

Affiliations
Review

Recent advances in isobaric labeling and applications in quantitative proteomics

Michael K Sivanich et al. Proteomics. 2022 Oct.

Abstract

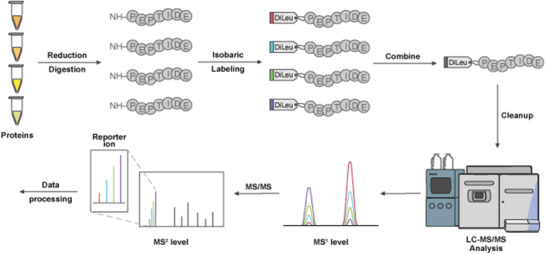
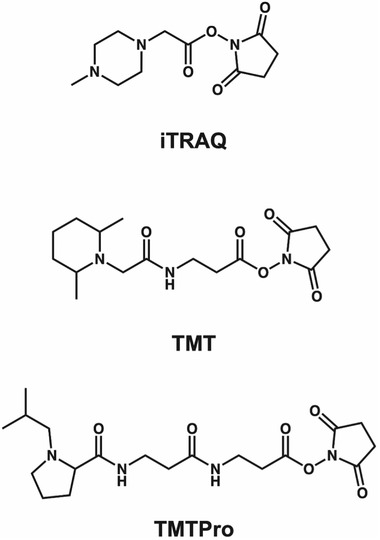
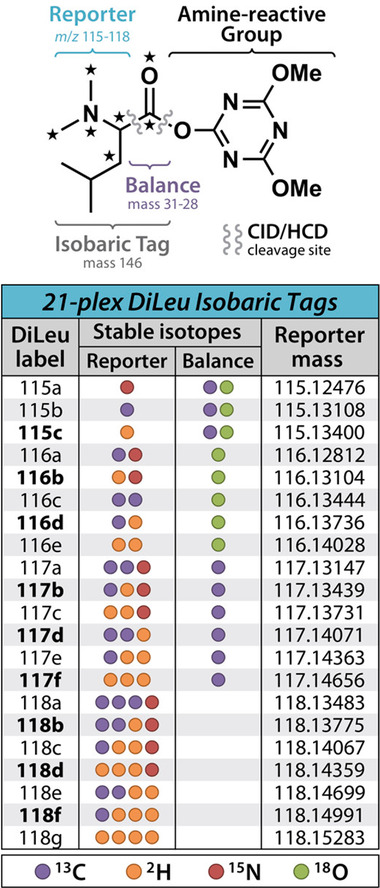
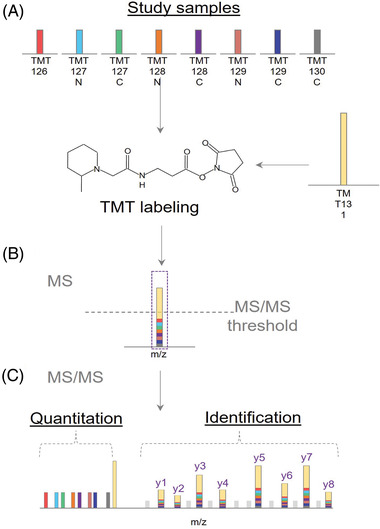
Mass spectrometry (MS) has emerged at the forefront of quantitative proteomic techniques. Liquid chromatography-mass spectrometry (LC-MS) can be used to determine abundances of proteins and peptides in complex biological samples. Several methods have been developed and adapted for accurate quantification based on chemical isotopic labeling. Among various chemical isotopic labeling techniques, isobaric tagging approaches rely on the analysis of peptides from MS2-based quantification rather than MS1-based quantification. In this review, we will provide an overview of several isobaric tags along with some recent developments including complementary ion tags, improvements in sensitive quantitation of analytes with lower abundance, strategies to increase multiplexing capabilities, and targeted analysis strategies. We will also discuss limitations of isobaric tags and approaches to alleviate these restrictions through bioinformatic tools and data acquisition methods. This review will highlight several applications of isobaric tags, including biomarker discovery and validation, thermal proteome profiling, cross-linking for structural investigations, single-cell analysis, top-down proteomics, along with applications to different molecules including neuropeptides, glycans, metabolites, and lipids, while providing considerations and evaluations to each application.

Keywords: isobaric tags; isotopic labeling; mass spectrometry; protein quantitation; quantitative proteomics; systems biology.


Conflict of interest statement

The authors declare no conflict of interest.

Figures

FIGURE 1
FIGURE 1
Overview of Isobaric Tag Workflow. The standard protocol involves proteins that undergo reduction, alkylation, and digestion to generate peptides. For the case of DiLeu 4‐plex, up to four samples are labeled with different channels, and are combined at equal concentrations prior to clean up steps. DiLeu‐labeled samples are analyzed via LC‐MS/MS where at the MS1 level, peptides from the pooled samples will appear as a single composite peak, which after fragmentation will show distinct reporter ion masses between m/z 114 and 118. The intensity of the reporter ion will indicate the relative amount of peptide in the mixture. All LC‐MS/MS data will undergo further data processing for downstream analysis
FIGURE 2
FIGURE 2
Chemical Structures of iTRAQ, TMT, and TMTPro. Each molecule consists of a reporter group, a mass balance group, and a peptide‐reactive group. iTRAQ contains a distribution of 13C, 15N, and 18O isotopes across the balance and reporter groups, while TMT and TMTPro consist of 13C and 15N only. iTRAQ consists of a N‐methylpiperazine reporter group, TMT with a dimethylpiperidine reporter and TMTPro contains an isobutyl‐proline reporter ion. Each tag carries an NHS reactive group, while mass normalization groups vary across each structure
FIGURE 3
FIGURE 3
Chemical Structure of DiLeu and Multiplexing Chart. DiLeu isobaric tag structure with multiplexing capability chart illustrating the isotopic configurations across reporter ion and balance groups for each channel along with reporter ion masses
FIGURE 4
FIGURE 4
Illustration of BASIL Strategy. Adapted from Yi. L et al., (2019) with permission. (A) Study samples are labeled with a smaller amount of TMT tag, while the boosting sample is labeled with a larger amount of TMT tag. (B) Peptides will appear as a single composite peak at the MS1 level as a sum of all intensities from the study and boosting samples. (C) Tandem MS fragmentation of peptide backbones reveal the intensities of the TMT reporter ions along with quantification of the study samples
FIGURE 5
FIGURE 5
Thermal Proteome Profiling Workflow. Cells are snap frozen via liquid nitrogen for cell extraction, followed by ultra‐centrifugation. The supernatant is then subjected to treatment either with a control or drug with further exposure via a thermal cycler at varying temperatures. The heated samples are ultracentrifuged again with enzymatic digestion of the supernatant. Once peptides are formed, they are labeled with isobaric tags and combined at equal concentrations prior to cleanup steps and LC‐MS/MS analysis
FIGURE 6
FIGURE 6
Single cell quantitative proteomics workflow via isobaric tagging. Adapted from Petelski A. et al., (2021) with permission. Individual cells are isolated from single‐cell suspensions, which are then lysed into proteins, digested into peptide chains, and labeled with isobaric tags for LC‐MS/MS analysis with subsequent data processing
FIGURE 7
FIGURE 7
mdDiLeu DIA Workflow. Adapted from Zhong X. et al, (2020) with permission. Either cerebral spinal fluid or samples were labeled with mdDiLeu tags, with LC‐MS/MS analysis using a m/z 27 scan range for DIA isolation windows. These were analyzed using HCD tandem MS with further data processing to illustrate the different b and y ions for differentially labeled samples

Similar articles

Cited by

References

    1. Rauniyar, N. , & Yates, J. R. (2014). Isobaric labeling‐based relative quantification in shotgun proteomics. Journal of Proteome Research, 13(12), 5293–5309. - PMC - PubMed
    1. Asara, J. M. , Christofk, H. R. , Freimark, L. M. , & Cantley, L. C. (2008). A label‐free quantification method by MS/MS TIC compared to SILAC and spectral counting in a proteomics screen. Proteomics, 8, 994–999. - PubMed
    1. Bondarenko, P. V. , Chelius, D. , & Shaler, T. A. (2002). Identification and relative quantitation of protein mixtures by enzymatic digestion followed by capillary reversed‐phase liquid chromatography−tandem mass spectrometry. Analytical Chemistry, 74(18), 4741–4749. - PubMed
    1. Gygi, S. P. , Rist, B. , Gerber, S. A. , Turecek, F. , Gelb, M. H. , & Aebersold, R. (1999). Quantitative analysis of complex protein mixtures using isotope‐coded affinity tags, Nature Biotechnology, 17, 994–999. - PubMed
    1. Zhu, W. , Smith, J. W. , & Huang, C.‐M. (2010). Mass spectrometry‐based label‐free quantitative proteomics. Journal of Biomedical Biotechnology, 2010, 840518. - PMC - PubMed

Publication types

LinkOut - more resources