. 2022 Jun 22;14(24):28389-28402.
doi: 10.1021/acsami.2c07492. Epub 2022 Jun 10.

3D Culture Modeling of Metastatic Breast Cancer Cells in Additive Manufactured Scaffolds

Affiliations

3D Culture Modeling of Metastatic Breast Cancer Cells in Additive Manufactured Scaffolds

Afroditi Nanou et al. ACS Appl Mater Interfaces. .

Abstract

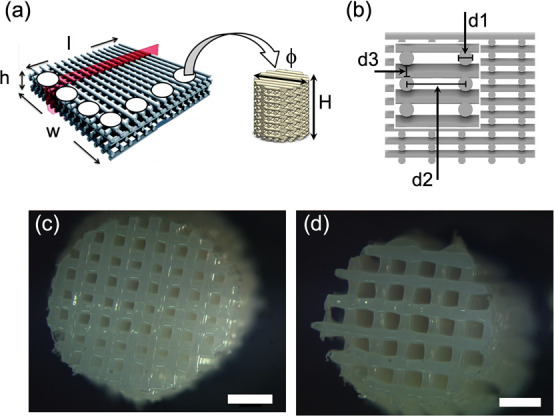
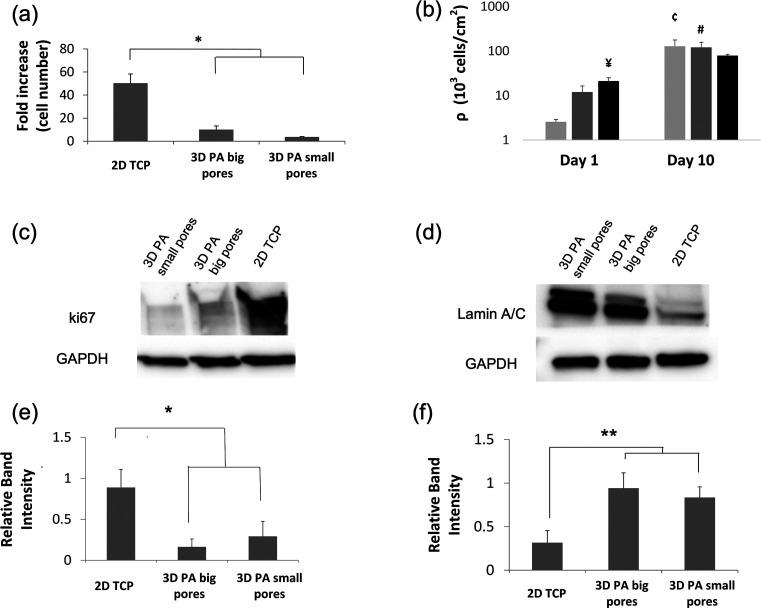
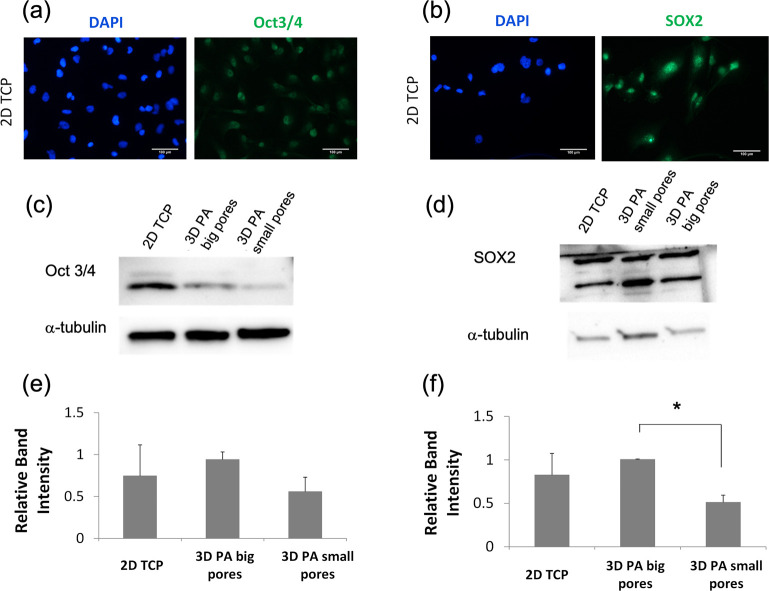
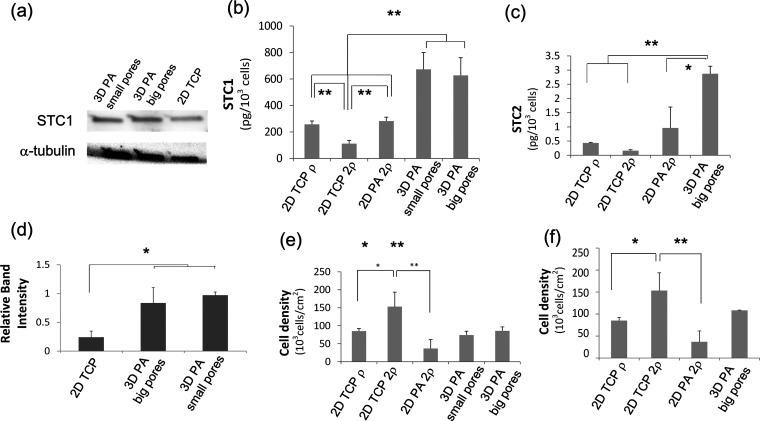
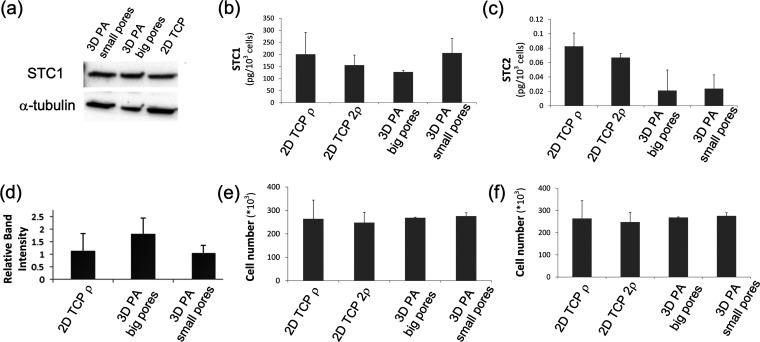
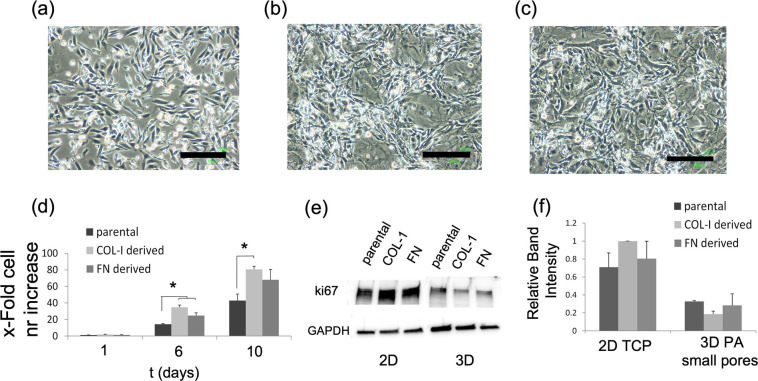
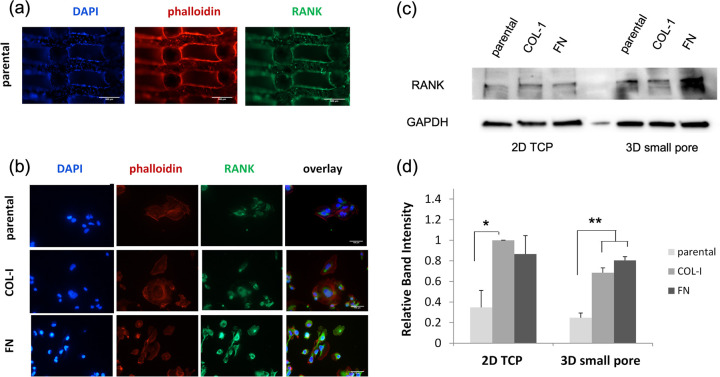
Cancer biology research is increasingly moving toward innovative in vitro 3D culture models, as conventional and current 2D cell cultures fail to resemble in vivo cancer biology. In the current study, porous 3D scaffolds, designed with two different porosities along with 2D tissue culture polystyrene (TCP) plates were used with a model breast cancer human cell line. The 3D engineered system was evaluated for the optimal seeding method (dynamic versus static), adhesion, and proliferation rate of MDA-MB-231 breast cancer cells. The expression profiles of proliferation-, stemness-, and dormancy-associated cancer markers, namely, ki67, lamin A/C, SOX2, Oct3/4, stanniocalcin 1 (STC1), and stanniocalcin 2 (STC2), were evaluated in the 3D cultured cells and compared to the respective profiles of the cells cultured in the conventional 2D TCP. Our data suggested that static seeding was the optimal seeding method with porosity-dependent efficiency. Moreover, cells cultured in 3D scaffolds displayed a more dormant phenotype in comparison to 2D, which was manifested by the lower proliferation rate, reduced ki67 expression, increased lamin A/C expression, and overexpression of STCs. The possible relationship between the cell affinity to different extracellular matrix (ECM) proteins and the RANK expression levels was also addressed after deriving collagen type I (COL-I) and fibronectin (FN) MDA-MB-231 filial cell lines with enhanced capacity to attach to the respective ECM proteins. The new derivatives exhibited a more mesenchymal like phenotype and higher RANK levels in relation to the parental cells, suggesting a relationship between ECM cell affinity and RANK expression. Therefore, the present 3D cell culture model shows that cancer cells on printed scaffolds can work as better representatives in cancer biology and drug screening related studies.

Keywords: breast cancer; scaffolds; three-dimensional bioprinting; tissue engineering; tumor microenvironment.


Conflict of interest statement

The authors declare no competing financial interest.

Figures

Figure 1
Figure 1
3D scaffold fabrication and characterization. (a) Representative 3D bioplotted PA scaffold block (w × l × h = 20 × 20 × 3 mm, ϕ = 4 mm, H = 20 layers). (b) Schematization of a CAD model, illustrating the main parameters defining the scaffold architecture: namely, fiber configuration, fiber diameter d1, fiber spacing d2, and layer thickness d3. The scaffolds used had a 0–90° pattern, d1 = 250 μm, d2= 450 or 650 μm, and d3 = 150 μm. (c, d) Images of two representative scaffold units with the two different porosities used, arising from two different strand distances d2: namely, (c) d2 = 450 μm (small pores/low porosity) and (d) d′2 = 650 μm (big pores/high porosity). Scale bar: 1 mm.
Figure 2
Figure 2
MDA-MB-231 cell proliferation and growth on 2D TCP and 3D PA scaffolds with big and small pores. (a) Fold increase in cell number after 10 days of cell culture in reference to the cell number at day 1. (b) Bar graph on a log scale showing cell densities determined at day 1 and day 10. ¥ denotes a significant difference from 2D TCP at day 1, ć denotes a highly significant difference from 2D TCP at day 1, and # denotes a significant difference from 3D big pores at day 1. Representative WBs for the detection and comparison of (c) ki67 and (d) lamin A/C among the different culture systems. GAPDH was used as a loading control. Semiquantitative analysis of ki67 (e) and (f) lamin A/C expression based on WB confirming that the intensity of the ki67 blot is much higher in the 2D culture, whereas the opposite tendency is observed in the case of lamin A/C. Biological triplicates were used in each experiment. Error bars represent SD; * and ** denote statistically and highly statistically significant differences, respectively (P < 0.05 and P < 0.005).
Figure 3
Figure 3
Expression of stemness-related transcription factors in MDA-MB-231 cells. (a) Immunofluorescence staining and imaging of (a) Oct3/4 and (b) SOX2 expressed in MDA-MB-231 cells cultured on 2D TCP. DAPI staining (in blue) and Oct3/4 and SOX2 (in green) showed that Oct3/4 and SOX2 are localized mainly within cell nuclei. Scale bars represent 100 μm. WBs for a comparison of (c) Oct3/4 and (d) and SOX2 expression levels among the different culture systems. α-Tubulin was used as a loading control. Relative intensities of (e) Oct3/4 and (f) SOX2 blots to α-tubulin are not significantly different between 2D and 3D cultures. Error bars represent SD, and * denotes a statistically significant difference (P < 0.05).
Figure 4
Figure 4
Expression of dormancy-related markers in MDA-MB-231 cells cultured in different configurations. (a) WB corresponding to the intracellular STC1 expression of MDA-MB-231 cells cultured for 8 days on either 2D TCP or 3D PA scaffolds. α-Tubulin was used as a loading control. (b) Bar graph corresponding to normalized to cell number STC1 secretion, measured by ELISA from the supernatant of cell cultures at t = 10 days. (c) Bar graph corresponding to normalized to cell number STC2 secretion measured by ELISA from the supernatant of cell cultures at t = 10 days. (d) Bar graph representing WB semiquantitative analysis of STC1 expression corresponding to normalized (to α-tubulin) STC1 expression after 8 days of cell culture on the various systems. (e) Average cell density corresponding to each culture condition of STC1 experiments. The cell number of each scaffold (data not shown) was used for the STC1 normalization corresponding to each scaffold. (f) Average cell density corresponding to each culture condition of STC2 experiments. The cell number of each scaffold was used for the STC2 normalization of each scaffold. Biological triplicates were used per experiment, and technical triplicates were used during the performance. Error bars represent SD, and * and ** denote P < 0.05 and P < 0.005, respectively.
Figure 5
Figure 5
Cell plasticity of MDA-MB-231 cells precultured in different cell culture configurations. (a) WB corresponding to the intracellular STC1 expression of “primed” MDA-MB-231 cells further cultured for 2 days on TCP under the same cell densities. α-Tubulin was used as a loading control. (b) Bar graph corresponding to secreted STC1 normalized to cell number. STC1 is measured by ELISA from the supernatant of “primed” MDA-MB-231 cells after 2 days of culture on TCP under the same cell densities and normalized to the cell number shown in the (e) bar graph. (c) Bar graph corresponding to STC2 secretion normalized to cell number. STC2 is measured by ELISA from the supernatant of “primed” MDA-MB-231 cells after 2 days of culture on TCP under the same cell densities and normalized to the cell number shown in the (f) bar graph. (d) Bar graph representing WB semiquantitative analysis of STC1 expression corresponding to STC1 expression after 2 days of cell culture and normalized to α-tubulin. (e) Average cell number determined by DNA quantification corresponding to each culture condition of STC1 experiments. (f) Average cell number determined by DNA quantification corresponding to each culture condition of STC2 experiments. Biological triplicates were used per experiment, and technical triplicates were used during the performance of ELISAs. Error bars represent SD. One-way ANOVA shows no statistical differences among all groups of “primed” cells once cultured for 2 additional days on 2D TCP. One-way ANOVA shows no statistical differences of cell number among all groups in the bar graph (e) corresponding to STC1 secretion experiments and the bar graph (f) corresponding to STC2 secretion experiments.
Figure 6
Figure 6
Characterization of ECM-derived MDA-MB-231 cells. Bright-field images showing the morphology of (a) parental, (b) COL-I-derived and (c) FN-derived MDA-MB-231 cells, cultured on 2D TCP. Black scale bars represent 200 μm. Filial cells exhibit a more mesenchymal morphology in comparison to the parental MDA-MB-231 population. (d) Proliferation rate on 2D TCP as shown by the fold cell number increase of parental and COL-I and FN-derived MDA-MB-231 cells. Cell numbers were determined at 1, 6, and 10 days. (e) WB of ki67 for parental and COL-I and FN-derived MDA-MB-231 cells under 2D TCP and 3D PA (of smaller porosity) cultures. The total protein amount was extracted at 6 and 8 days in the case of 2D and 3D cultures, respectively. GAPDH was used as a loading control. (f) Normalized (to GAPDH) ki67 expression based on band intensity peaks in the case of 2D and 3D cultures, respectively. Normalized ki67 levels of 2D and 3D correspond to 6 and 8 days, respectively. Biological triplicates were used per time point. Error bars represent SD. A statistical analysis among different cell lines was carried out with one-way ANOVA. * denotes P < 0.05.
Figure 7
Figure 7
Cell morphology and RANK localization of parental and filial MDA-MB-231 cells on (a) a 3D PA scaffold and (b) a 2D TCP. Fluorescent staining: nucleus (blue), actin filaments (red), and RANK protein (green). Scale bars represent 500 and 100 μm for 3D and 2D cultures, respectively. (c) WB of RANK for parental and COL-I- and FN-derived MDA-MB-231 cells under 2D and 3D (of small pores/lower porosity) cultures. The total protein amount was extracted after 3 and 8 days in the case of 2D and 3D cultures, respectively. GAPDH was used as a loading control. (d) Normalized (to GAPDH) RANK expression based on the intensity peaks of the respective Western blots. Error bars represent SD, and * and ** indicate significant and highly significant statistical differences, respectively.

Similar articles

Cited by

References

    1. Siegel R. L.; Miller K. D.; Fuchs H. E.; Jemal A. Cancer Statistics, 2021. CA: A Cancer Journal for Clinicians 2021, 71 (1), 7–33. 10.3322/caac.21654. - DOI - PubMed
    1. Mehta V.; Goel S.; Kabarriti R.; Cole D.; Goldfinger M.; Acuna-Villaorduna A.; Pradhan K.; Thota R.; Reissman S.; Sparano J. A.; et al. Case Fatality Rate of Cancer Patients with COVID-19 in a New York Hospital System. Cancer discovery 2020, 10 (7), 935–941. 10.1158/2159-8290.CD-20-0516. - DOI - PMC - PubMed
    1. Abbott A. Cell Culture: Biology’s New Dimension. Nature 2003, 424 (6951), 870–873. 10.1038/424870a. - DOI - PubMed
    1. Yamada K. M.; Cukierman E. Modeling Tissue Morphogenesis and Cancer In 3D. Cell 2007, 130 (4), 601–610. 10.1016/j.cell.2007.08.006. - DOI - PubMed
    1. Miller R. A.; Nadon N. L. Principles of Animal Use For Gerontological Research. Journals of Gerontology Series A: Biological Sciences and Medical Sciences 2000, 55 (3), B117–B123. 10.1093/gerona/55.3.B117. - DOI - PMC - PubMed