

Screening membraneless organelle participants with machine-learning models that integrate multimodal features
- PMID: 35687670
- PMCID: PMC9214545
- DOI: 10.1073/pnas.2115369119
Screening membraneless organelle participants with machine-learning models that integrate multimodal features
Abstract
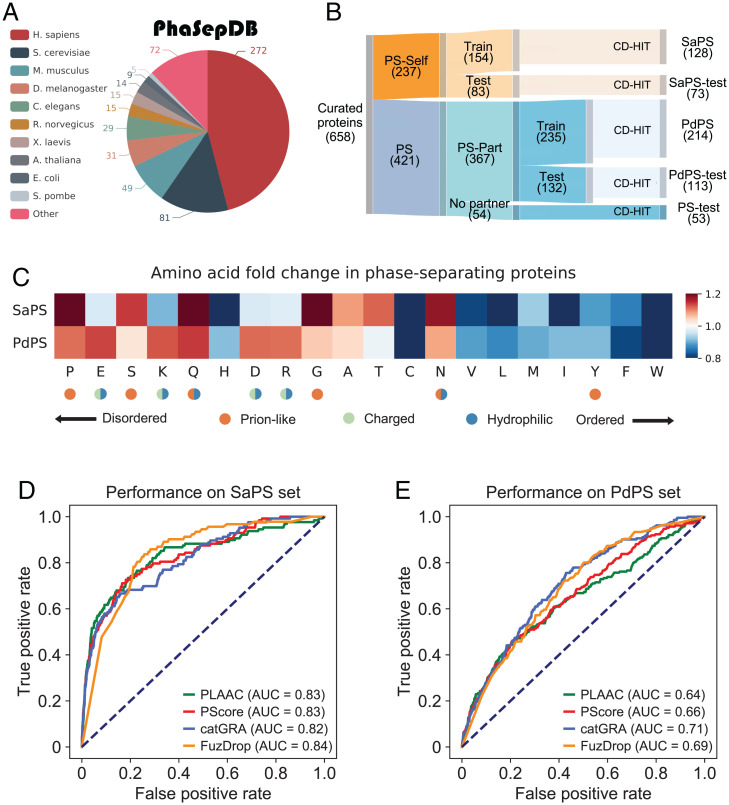
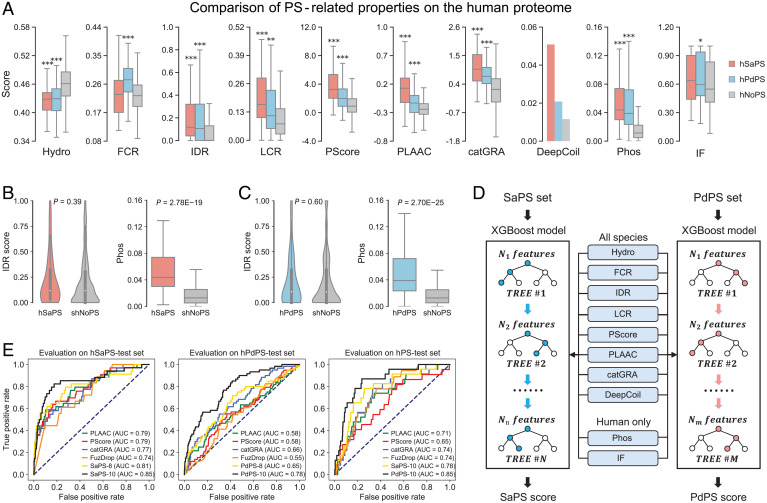
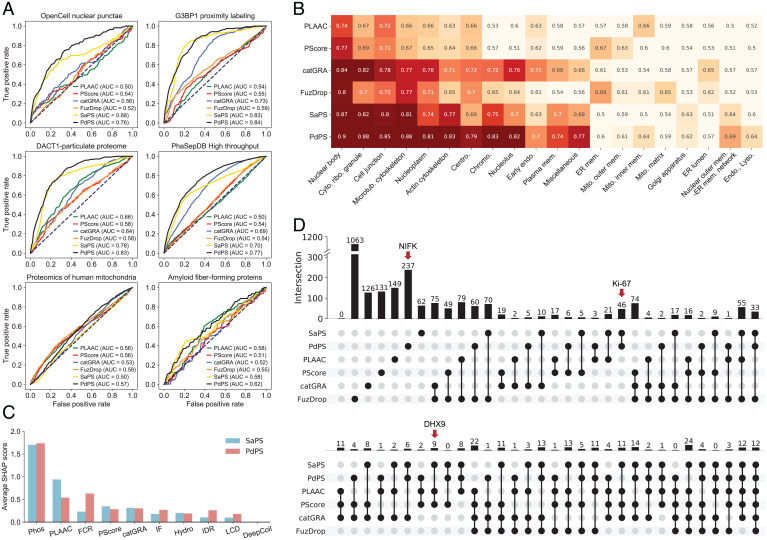
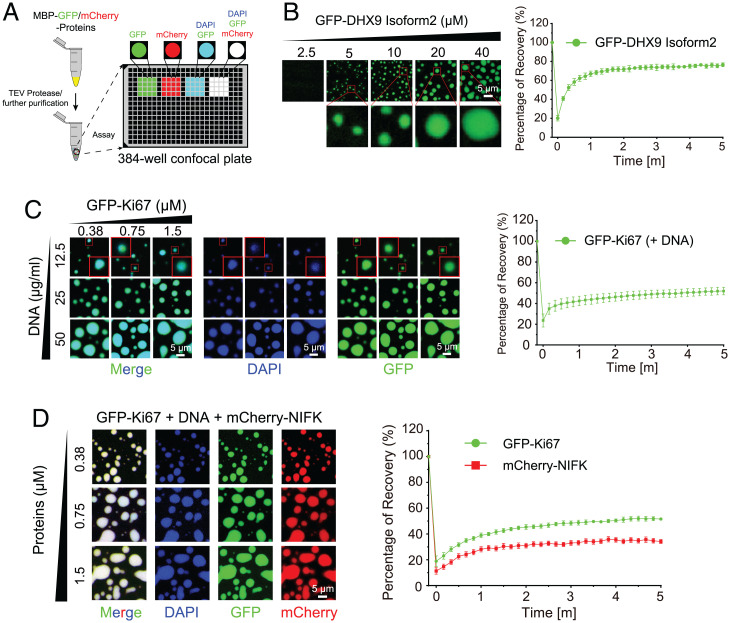
Protein self-assembly is one of the formation mechanisms of biomolecular condensates. However, most phase-separating systems (PS) demand multiple partners in biological conditions. In this study, we divided PS proteins into two groups according to the mechanism by which they undergo PS: PS-Self proteins can self-assemble spontaneously to form droplets, while PS-Part proteins interact with partners to undergo PS. Analysis of the amino acid composition revealed differences in the sequence pattern between the two protein groups. Existing PS predictors, when evaluated on two test protein sets, preferentially predicted self-assembling proteins. Thus, a comprehensive predictor is required. Herein, we propose that properties other than sequence composition can provide crucial information in screening PS proteins. By incorporating phosphorylation frequencies and immunofluorescence image-based droplet-forming propensity with other PS-related features, we built two independent machine-learning models to separately predict the two protein categories. Results of independent testing suggested the superiority of integrating multimodal features. We performed experimental verification on the top-scored proteins DHX9, Ki-67, and NIFK. Their PS behavior in vitro revealed the effectiveness of our models in PS prediction. Further validation on the proteome of membraneless organelles confirmed the ability of our models to identify PS-Part proteins. We implemented a web server named PhaSePred (http://predict.phasep.pro/) that incorporates our two models together with representative PS predictors. PhaSePred displays proteome-level quantiles of different features, thus profiling PS propensity and providing crucial information for identification of candidate proteins.
Keywords: metapredictor; partner-dependent; phase separation; phosphorylation; self-assembly.
Conflict of interest statement
The authors declare no competing interest.
Figures
Similar articles
-
PICNIC accurately predicts condensate-forming proteins regardless of their structural disorder across organisms.Nat Commun. 2024 Dec 11;15(1):10668. doi: 10.1038/s41467-024-55089-x. Nat Commun. 2024. PMID: 39663388 Free PMC article.
-
A two-task predictor for discovering phase separation proteins and their undergoing mechanism.Brief Bioinform. 2024 Sep 23;25(6):bbae528. doi: 10.1093/bib/bbae528. Brief Bioinform. 2024. PMID: 39434494 Free PMC article.
-
Sequence variations of phase-separating proteins and resources for studying biomolecular condensates.Acta Biochim Biophys Sin (Shanghai). 2023 Jul 18;55(7):1119-1132. doi: 10.3724/abbs.2023131. Acta Biochim Biophys Sin (Shanghai). 2023. PMID: 37464880 Free PMC article. Review.
-
PhaSepDB in 2022: annotating phase separation-related proteins with droplet states, co-phase separation partners and other experimental information.Nucleic Acids Res. 2023 Jan 6;51(D1):D460-D465. doi: 10.1093/nar/gkac783. Nucleic Acids Res. 2023. PMID: 36124686 Free PMC article.
-
Analysis of biomolecular condensates and protein phase separation with microfluidic technology.Biochim Biophys Acta Mol Cell Res. 2021 Jan;1868(1):118823. doi: 10.1016/j.bbamcr.2020.118823. Epub 2020 Aug 13. Biochim Biophys Acta Mol Cell Res. 2021. PMID: 32800925 Review.
Cited by
-
SON-dependent nuclear speckle rehabilitation alleviates proteinopathies.bioRxiv [Preprint]. 2025 Apr 28:2024.04.18.590103. doi: 10.1101/2024.04.18.590103. bioRxiv. 2025. Update in: Nat Commun. 2025 Aug 5;16(1):7065. doi: 10.1038/s41467-025-62242-7. PMID: 38659924 Free PMC article. Updated. Preprint.
-
Phase separation as a possible mechanism for dosage sensitivity.Genome Biol. 2024 Jan 15;25(1):17. doi: 10.1186/s13059-023-03128-z. Genome Biol. 2024. PMID: 38225666 Free PMC article.
-
Role of liquid-liquid phase separation in cancer: Mechanisms and therapeutic implications.Cancer Innov. 2024 Sep 17;3(5):e144. doi: 10.1002/cai2.144. eCollection 2024 Oct. Cancer Innov. 2024. PMID: 39290787 Free PMC article. Review.
-
Genome-Wide Identification and Expression Analysis of YTH Gene Family for Abiotic Stress Regulation in Camellia chekiangoleosa.Int J Mol Sci. 2024 Apr 3;25(7):3996. doi: 10.3390/ijms25073996. Int J Mol Sci. 2024. PMID: 38612806 Free PMC article.
-
Sequence-Based Prediction of Protein Phase Separation: The Role of Beta-Pairing Propensity.Biomolecules. 2022 Nov 28;12(12):1771. doi: 10.3390/biom12121771. Biomolecules. 2022. PMID: 36551199 Free PMC article.
References
-
- Zhang H., et al. , Liquid-liquid phase separation in biology: Mechanisms, physiological functions and human diseases. Sci. China Life Sci. 63, 953–985 (2020). - PubMed
Publication types
MeSH terms
Substances
LinkOut - more resources
Full Text Sources
Miscellaneous
