. 2022 Jun 10;8(23):eabm2456.
doi: 10.1126/sciadv.abm2456. Epub 2022 Jun 10.

Multiscale topology characterizes dynamic tumor vascular networks

Affiliations

Multiscale topology characterizes dynamic tumor vascular networks

Bernadette J Stolz et al. Sci Adv. .

Abstract

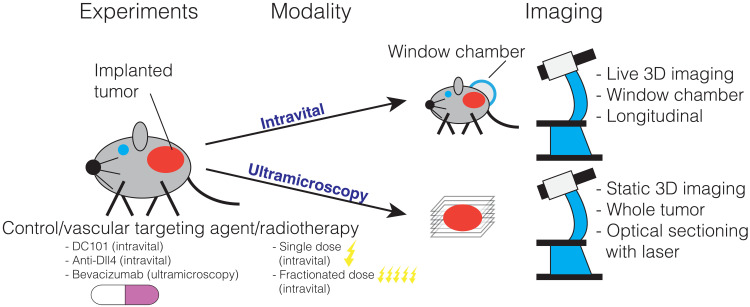
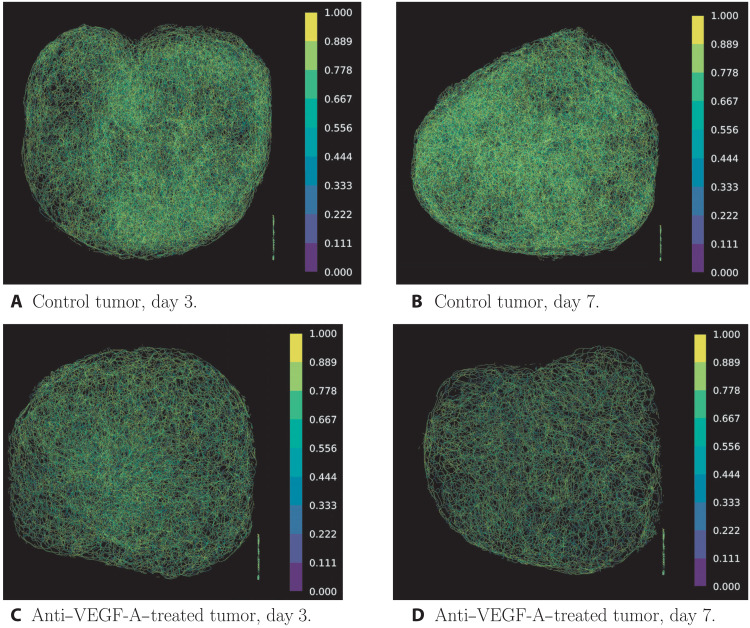
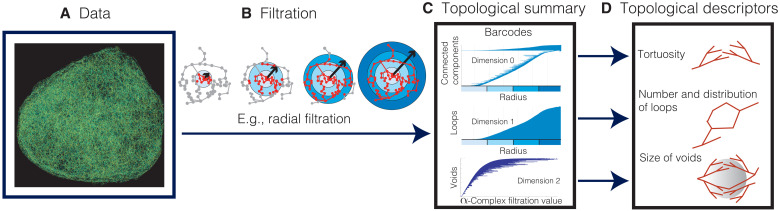
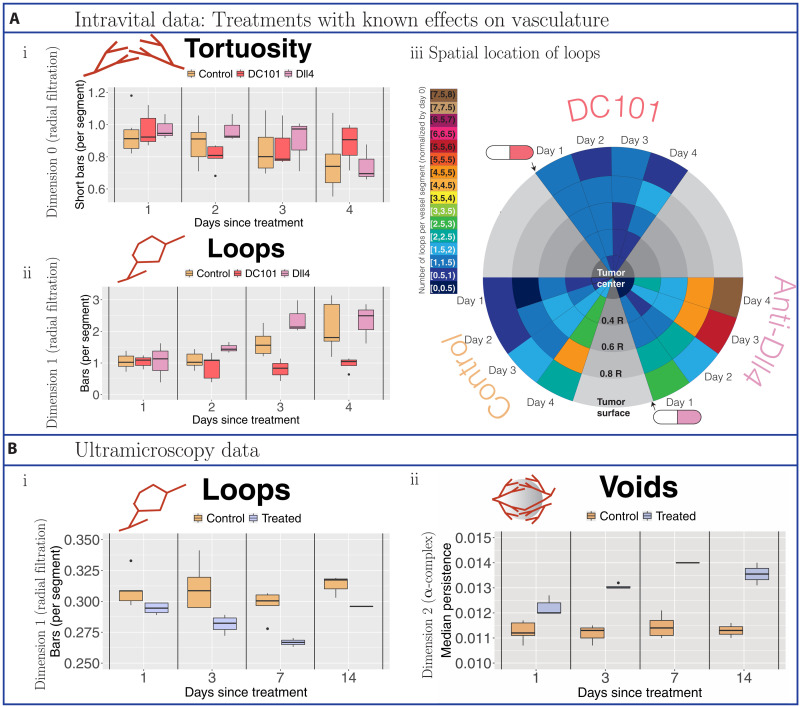
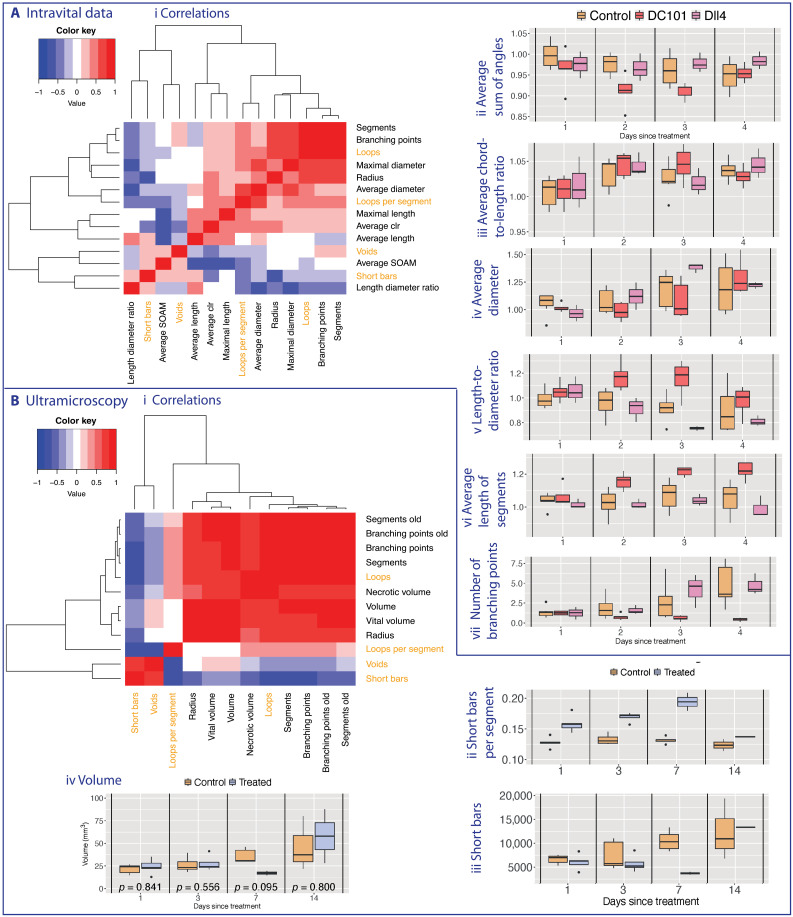
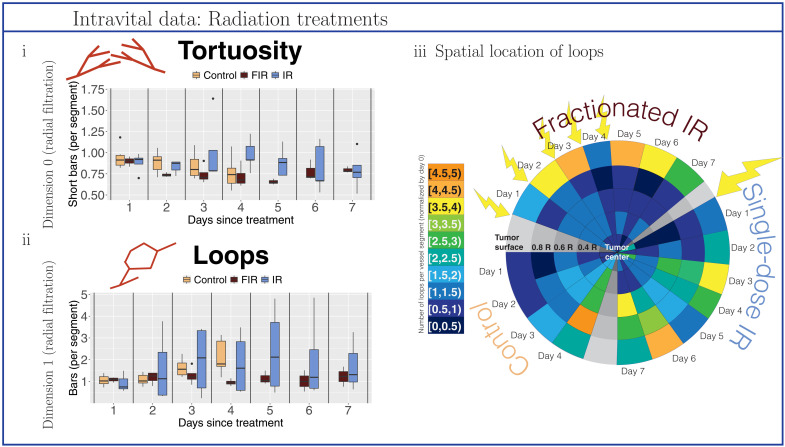
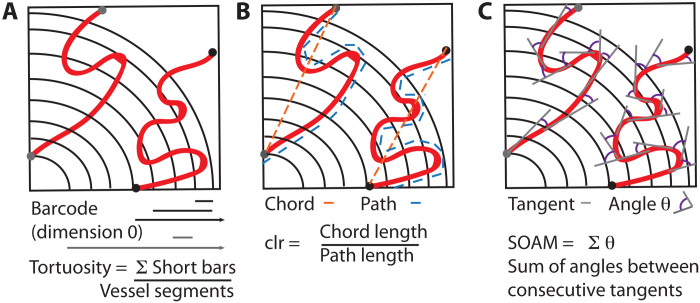
Advances in imaging techniques enable high-resolution three-dimensional (3D) visualization of vascular networks over time and reveal abnormal structural features such as twists and loops, and their quantification is an active area of research. Here, we showcase how topological data analysis, the mathematical field that studies the "shape" of data, can characterize the geometric, spatial, and temporal organization of vascular networks. We propose two topological lenses to study vasculature, which capture inherent multiscale features and vessel connectivity, and surpass the single-scale analysis of existing methods. We analyze images collected using intravital and ultramicroscopy modalities and quantify spatiotemporal variation of twists, loops, and avascular regions (voids) in 3D vascular networks. This topological approach validates and quantifies known qualitative trends such as dynamic changes in tortuosity and loops in response to antibodies that modulate vessel sprouting; furthermore, it quantifies the effect of radiotherapy on vessel architecture.


Figures

Fig. 1.
Fig. 1.. Description of datasets.
We illustrate the treatments and imaging techniques used to generate the experimental data that we analyze. Both datasets consist of 3D stacks of tumor vasculature images from mice undergoing different treatments (vascular targeting agents and radiotherapy). Intravital data were collected from live animals observed over several days. Ultramicroscopy data (8) were obtained from multiple tumors excised at different times after treatment (one time point per tumor). These data are not directly comparable since they were generated from two different mouse models (see Table 1) using different experimental setups (see Materials and Methods).
Fig. 2.
Fig. 2.. Example images of extracted vessel networks from multispectral fluorescence ultramicroscopy data colored according to tortuosity measured via clr values.
We can see a clear difference between the vessel networks of the treated and the untreated tumor on both days 3 and 7 after treatment. Note that the collection of lines in the bottom right corner of the images corresponds to text that was present in the skeleton images in the dataset. We removed these artifacts from our extracted point clouds. (A) Control tumor, day 3. (B) Control tumor, day 7. (C) Anti–VEGF-A–treated tumor, day 3. (D) Anti–VEGF-A–treated tumor, day 7.
Fig. 3.
Fig. 3.. Schematic illustration of TDA for vascular network data.
(A) We reconstruct the 3D vascular network from image stacks. (B) We apply the radial filtration and the α-complex filtration. (C) We compute the topological summary of the data, which consists of a collection of barcodes (49). The horizontal axis of a barcode represents a spatial parameter such as radial distance to the tumor center (radial filtration) or the scale at which we view the data (α-complex filtration). Every line in a barcode corresponds to a topological feature—i.e., a connected component, loop, or void—in the data. In the radial filtration, we analyze the network within the sphere (highlighted in red) and compute connected components and loops as the sphere grows from the tumor center outward. In the barcodes, the bars start at the radius (measured from the tumor center) where the corresponding connected component or loop first enters the sphere. For a connected component, its corresponding bar ends at the radius at which it merges with another component, i.e., it connects to another part of the vascular network within the growing sphere. A bar representing a loop finishes at the final radius of the filtration. For voids, we study the data at different scales using the α-complex filtration (see the “Topological data analysis” section in Materials and Methods), and the range of a bar represents the scale values where the void is detectable. Its length is a proxy for the volume of the void. (D) We extract interpretable topological descriptors of the data from barcodes.
Fig. 4.
Fig. 4.. Topological descriptors extracted from tumor blood vessel networks treated with vascular targeting agents with known effects.
(A) Intravital data results. We normalized all descriptors with respect to values on the day on which treatment is administered or, for controls, the day on which observations commence (day 0). Data were collected from controls (beige) and tumors treated with the vascular targeting agent DC101 (37) (dark pink) or the vascular targeting agent anti-Dll4 (39) (light pink). (i) Tortuosity was computed as the ratio of short bars in dimension 0 barcodes of the radial filtration (≤10% of maximal radius used) to the number of vessel segments. (ii) Loops are the number of bars in dimension 1 barcodes of the radial filtration per vessel segment. (iii) Spatiotemporal resolution of the number of loops per vessel segment. We illustrate the changes in the median number of loops (normalized by day 0) in radial intervals around the tumor centers over the days of observation. We point to the day following treatment with vascular targeting agents with a cartoon drug. (B) Ultramicroscopy data results. Because of the snapshot nature of the data (one time point per tumor), all reported topological descriptors are raw values. Data were collected from controls (beige) and tumors treated with bevacizumab (purple). (i) We computed the number of vessel loops per vessel segment. (ii) We determined the size of voids (avascular regions) by computing the median length of bars in the dimension 2 barcodes of the α-complex filtration.
Fig. 5.
Fig. 5.. Heatmaps displaying pairwise Pearson correlation coefficients between different vascular descriptors (standard and topological).
Vascular descriptors were derived from the (A) intravital data and (B) ultramicroscopy data. The dendrograms (Ai and Bi) represent complete linkage clustering using the Euclidean distance measure. We compute standard vascular descriptors for comparison (see Section Standard measures and existing descriptors in Introduction and Section Additional results and statistical analysis in SI). We highlight the topological measures in orange including both the number of loops and number of loops per vessel segment to highlight the effect of the normalization. For the ultramicroscopy data, we mark those descriptors that we report from (8) with the word “old” (as opposed to the same descriptors that we calculate as in (2,45)). We present existing tortuosity descriptors (Aii and iii) and standard measures on the data (Aiii - vi, Biv). While the proposed topological tortuosity descriptor is a good measure for intravital data (see Fig. 4), care must be taken with the ultramicroscopy data (Bii and iii, see Section Tortuosity in the ultramicroscopy data in SI for details).
Fig. 6.
Fig. 6.. Topological descriptors extracted from tumor blood vessel networks treated with radiation therapy.
We normalized all descriptors with respect to values on the day on which treatment is administered (day 0) or, for controls, the day on which observations commenced (day 0). Data were collected from control mice (beige), mice treated with fractionated irradiation (FIR; brown), and mice treated with single-dose irradiation (IR; blue). (i) Tortuosity was computed as the ratio of short bars (≤10% of maximal radius used in the radial filtration) in the dimension 0 barcodes of the radial filtration to the number of vessel segments. (ii) Loops are the number of bars in the dimension 1 barcodes of the radial filtration per vessel segment in the network. (iii) Spatiotemporal resolution of the number of loops per vessel segment. We illustrate the changes in the median number of loops (normalized by day 0) in different radial intervals around the tumor centers over the days of observation. The yellow arrows highlight days for which the tumors have received treatment on the prior day [i.e., an arrow on day 1 signifies that (a dose of) treatment was administered on day 0].
Fig. 7.
Fig. 7.. Schematic of tortuosity descriptors.
(A) The topological descriptor is defined as the number of short bars in the barcode (connected components in dimension 0 barcodes with persistence of ≤10% of the maximal radius) normalized by the number of vessel segments. In this schematic, there are two vessels. This normalization ensures that the connected components in the tortuosity measure do not also count different vessel segments. This descriptor is in contrast to the topological tortuosity reported in (26), which did not have multiple vessel segments. (B) The clr (45) is the ratio between the chord connecting two ends of a curve (orange) and the path length of the curve (blue). Clr measures the deviation from a straight line. (C) The SOAM measures the sum of angles between consecutive tangents of a curve, so a high score is given to a curve rapidly changing direction.

References

    1. R. Bates, L. Risser, B. Irving, B. W. Papież, P. Kannan, V. Kersemans, J. A. Schnabel, Filling large discontinuities in 3D vascular networks using skeleton- and intensity-based information, in Medical Image Computing and Computer-Assisted Intervention. MICCAI 2015, N. Navab, J. Hornegger, W. M. Wells, A. F. Frangi, Eds. (Springer, 2015), vol. 9351 of Lecture Notes in Computer Science, pp. 157–164.
    1. Bates R., Irving B., Markelc B., Kaeppler J., Brown G., Muschel R. J., Brady M., Grau V., Schnabel J. A., Segmentation of vasculature from fluorescently labeled endothelial cells in multi-photon microscopy images. IEEE Trans. Med. Imaging 38, 1–10 (2019). - PubMed
    1. Goel S., Duda D. G., Xu L., Munn L. L., Boucher Y., Fukumura D., Jain R. K., Normalization of the vasculature for treatment of cancer and other diseases. Physiol. Rev. 91, 1071–1121 (2011). - PMC - PubMed
    1. Nagy J. A., Chang S.-H., Dvorak A. M., Dvorak H. F., Why are tumour blood vessels abnormal and why is it important to know? Br. J. Cancer 100, 865–869 (2009). - PMC - PubMed
    1. Pittet M. J., Weissleder R., Intravital imaging. Cell 147, 983–991 (2011). - PMC - PubMed