. 2022 Jun 10;8(23):eabo0875.
doi: 10.1126/sciadv.abo0875. Epub 2022 Jun 10.

An actin mechanostat ensures hyphal tip sharpness in Phytophthora infestans to achieve host penetration

Affiliations

An actin mechanostat ensures hyphal tip sharpness in Phytophthora infestans to achieve host penetration

Jochem Bronkhorst et al. Sci Adv. .

Abstract

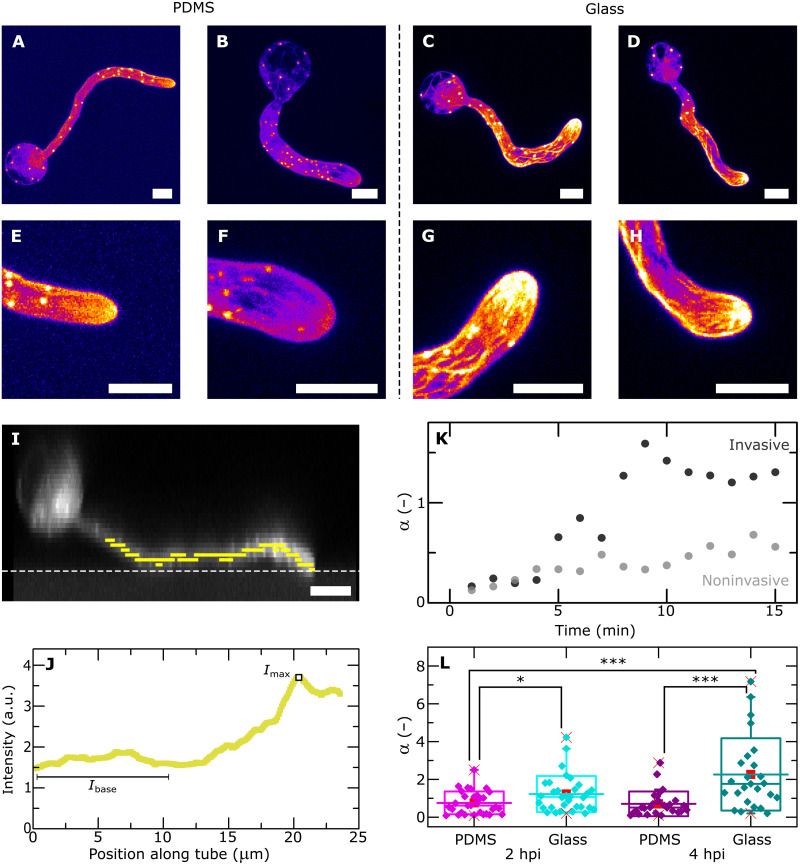
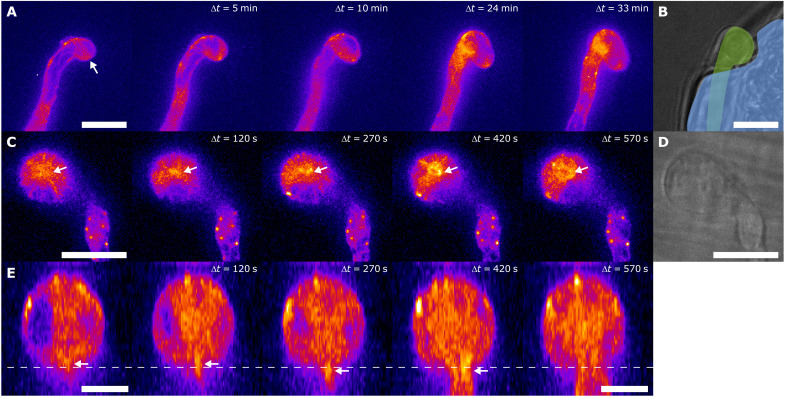
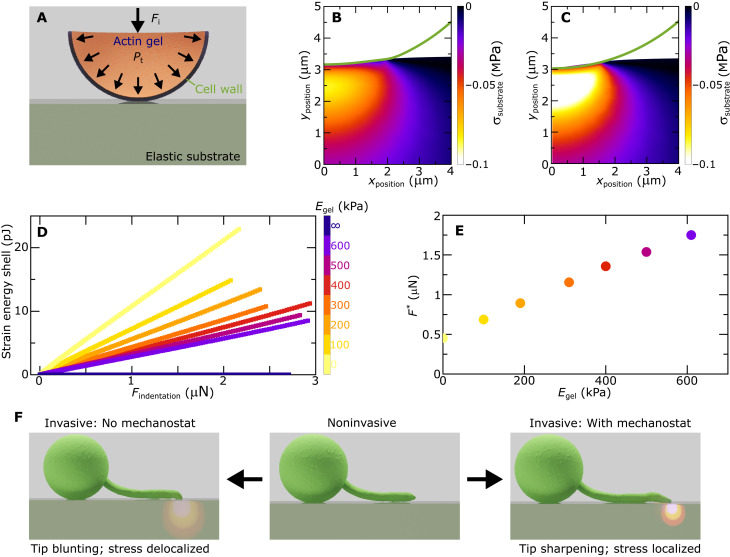
Filamentous plant pathogens apply mechanical forces to pierce their hosts surface and penetrate its tissues. Devastating Phytophthora pathogens harness a specialized form of invasive tip growth to slice through the plant surface, wielding their hypha as a microscopic knife. Slicing requires a sharp hyphal tip that is not blunted at the site of the mechanical interaction. How tip shape is controlled, however, is unknown. We uncover an actin-based mechanostat in Phytophthora infestans that controls tip sharpness during penetration. Mechanical stimulation of the hypha leads to the emergence of an aster-like actin configuration, which shows fast, local, and quantitative feedback to the local stress. We evidence that this functions as an adaptive mechanical scaffold that sharpens the invasive weapon and prevents it from blunting. The hyphal tip mechanostat enables the efficient conversion of turgor into localized invasive pressures that are required to achieve host penetration.


Figures

Fig. 1.
Fig. 1.. Substrate stiffness controls actin organization in invasive P. infestans.
(A to D) Maximum intensity xy projections of hyphae of LifeAct-eGFP–expressing P. infestans (Pi-LA-GFP) on PDMS (A and B; N = 32 cells/3 independent experiments) and glass (C and D; N = 45 cells/3 independent experiments), with corresponding close-up images of the hyphal tips shown in (E) to (H). (I) xz projection of an invasively growing hypha on glass. Gray dotted line: substrate plane, yellow markers: germ tube centroid from image analysis, with the corresponding LifeAct-eGFP intensity as a function of position along the hypha in (J) (see fig. S4 for additional examples). a.u., arbitrary units. (K) Extent of actin accumulation in the hyphal tip expressed by parameter α (as defined in text) as a function of time for a single cell undergoing noninvasive growth (gray) versus a single cell that grows invasively into a PDMS substrate (black). N = 10 cells/6 independent experiments. (L) Box plot showing the distribution of α values for invasively growing hyphae on PDMS and glass substrates, 2 and 4 hours post-inoculation (hpi); a two-sided Wilcoxon rank sum test was used to compare α between glass and PDMS at 2 and 4 hpi, respectively (a < 0.05, *P > 0.02, ***P < 0.01). N = 31 cells/4 independent experiments (PDMS—2 hpi), N = 27 cells/2 independent experiments (PDMS—4 hpi), N = 32 cells/3 independent experiments (glass—2 hpi), and N = 27 cells/3 independent experiments (glass—4 hpi). Scale bars, 5 μm (A to I).
Fig. 2.
Fig. 2.. Mechanically-induced actin remodeling during pathogenic cell penetration.
(A) Time sequence of confocal microscopy images of P. infestans Pi-LA-GFP during attempted penetration of a suspension-cultured tomato MsK8 cell, showing actin aster formation (indicated with arrow) at the site of contact (N = 4 cells/1 independent experiment). (B) Bright-field fluorescence overlay image shows the pathogen (green) indenting the dead tomato cell (blue) that has lost turgor pressure. Scale bars, 10 μm (A and B). (C) Singular unique observation of Pi-LA-GFP during penetration of an etiolated potato stem. Penetration occurs between 270 and 300 s. (D) Bright-field image of invasive hypha shown in (C). (E) xz projections showing an orthogonal view (90° rotation) of the images in (C). Scale bars, 10 μm (A to D) and 5 μm (E). Arrows in (A), (C), and (E) indicate aster, and the dashed line in (E) indicates the stem surface.
Fig. 3.
Fig. 3.. Kinetics of cytoskeletal remodeling upon local stimulation.
Live-cell imaging of P. infestans Pi-LA-GFP upon laser ablation at t = 0 in a distal area of the hypha (A) and in proximity of the hyphal tip (B) during a time frame of 40 s. In each hypha, the ablation laser was targeted to a plaque and to a plaque-free region of the cytoplasm (indicated with circles), respectively. Actin asters are indicated by arrows. Scale bars, 5 μm (A and B). (C) Fluorescence intensity in the ablation zone as a function of time, with t = 0 defining the time of the ablation pulse, for a cytosolic eGFP line (control, Pi-14-3-GFP) and the actin marker line (Pi-LA-GFP) for two different targets (plaques and plaque-free regions) and two different locations in the hypha. All curves are averaged over several repeated measurements (as indicated); symbols denote average normalized intensities, and error bars denote the SD across the repeated experiments (number of repeats as indicated). Error bars in the control experiment are smaller than the symbol size. Vertical gray lines indicate the start of the formation and dissolution phase, respectively.
Fig. 4.
Fig. 4.. Local and quantitative mechanical feedback to cytoskeletal organization.
(A to D) LifeAct-eGFP imaging combined with local surface mechanics measurements, showing xy projections of P. infestans Pi-LA-GFP during invasive growth on a PDMS substrate (A and C) and corresponding surface deformation maps (B and D) in the phase just before (A and B) and during force generation (C and D). (E) Scatterplot, showing the local LifeAct eGFP intensity (y axis) and absolute surface deformation amplitude for each pixel at a single time point for a single cell (x axis); data are grouped into adhesive (red), indentation (blue), and noninteracting sites (black) on the basis of the sign and amplitude of the local surface deformation (as explained in text). (F) Overlay of identified adhesion (red) and indentation sites (blue) on the xy projection of the LifeAct eGFP signal for a single cell showing strong localization in two distinct zones; additional examples shown in fig. S8. Spatial correlation of LifeAct-eGFP and surface deformations was performed on N = 6 cells/5 independent experiments. (G) Violin plot showing the distribution of LifeAct eGFP intensities associated with the three distinct sites, collected from N = 6 cells and n = 5 time points per cell, resulting in a total number of data points of 26,000 (indentation), 232,000 (noninteracting), and 25,000 (adhesion). A two-sided unpaired Student’s t test with Welch’s correction was performed to compare relative fluorescence intensities in the indentation zone versus the noninteracting and adhesion regions (a < 0.05 and ***P < 0.01). (H) Quantitative correlation between the extent of actin accumulation in the tip, expressed by parameter α (y axis), and the maximum amplitude of surface deformations (x axis) as a proxy for the applied invasive force. Diamonds represent means, and scale bars represent SDs between aggregated time series for N = 6 cells/5 independent experiments. Scale bars, 5 μm (A to D and F).
Fig. 5.
Fig. 5.. Mechanical model for cytoskeletal cell wall fortification.
(A) Schematic illustration of the finite-element mechanical model. (B and C) Shape of the cell wall (green line) and stress distribution in the substrate for a tip without actin gel (B) and a tip with an infinitely stiff actin gel (C). The total indentation force is 1 μN in both cases. The color scale in the substrates indicates the principal compressive stress as the result of tip indentation. (D) Total strain energy in the cell wall (y axis), as a measure for the extent of tip deformation, as a function of the indentation force (x axis) for tips containing actin gels of different modulus; color scale expresses the actin gel modulus. (E) Indentation force F* (y axis) at which the strain energy in the shell reaches a threshold value of 5 pJ as a function of the modulus of the actin gel (x axis). (F) Schematic illustration of hyphal tip shape, and its effect on stress distributions in the substrate, upon switching from noninvasive to invasive growth, with and without a mechanostat to ensure tip sharpness.
Fig. 6.
Fig. 6.. An actin-based tip shape mechanostat.
(A to C) Surface deformation maps during the invasive growth of P. infestans Pi-LA-GFP on elastomer surfaces (color code as in Fig. 3, B and D) during the initial noninvasive growth (A), invasive force generation (B), and after surface fracture and substrate penetration (C). (D to F) Associated surface height profiles (symbols) and fits to a mechanical model for invasive force generation (lines). (G) Invasive force applied onto the substrate (y axis) as a function of time (x axis) for a single cell, showing three regimes. (H) In the invasive force generation regime, the tip radius Rtip (y axis) can be extracted from the surface deformation fitting, for the same single cell as in (G). (I) Aggregated data for N = 5 cells/3 independent experiments, showing the correlation between the tip shape (y axis) and the applied invasive force Fi (x axis), revealing initial tip sharpening upon mechanical contact and tip shape stasis at higher forces. Gray diamonds: all data points; purple squares: binned and averaged data, with error bars representing the SD per bin along the force axis. Scale bars, 5 μm (A to C).
Fig. 7.
Fig. 7.. Actin depolymerization inhibits tip-shape mechanostat.
Effect of cytoskeletal mechanostat disruption, by acute treatment with 5 mM LatB at t = 0, on tip shape and surface mechanics of Pi-LA-GFP during invasive growth. (A) Bright-field images before (t = −2 min) and after (t = +12 and +38 min) LatB treatment. (B) Corresponding images from the LifeAct-eGFP channel showing disruption of the actin filaments by the lack of LifeAct-eGFP localization after treatment. (C) Corresponding surface deformation maps and (D) line profiles of surface deformations from experiments (symbols) and fitted to a mechanical model for invasive growth (solid lines) to extract tip curvature Rtip and indentation force F, as specified in the figure panels. Scale bars in (A) to (C) represent 5 μm; N = 6 cells from three independent experiments (see fig. S9 for additional examples).

Similar articles

Cited by

References

    1. P. V. Balhadère, N. J. Talbot, in Molecular Plant Pathology (CRC Press, ed. 1, 2020), pp. 1–25.
    1. Fawke S., Doumane M., Schornack S., Oomycete interactions with plants: Infection strategies and resistance principles. Microbiol. Mol. Biol. Rev. 79, 263–280 (2015). - PMC - PubMed
    1. Howard R. J., Valent B., Breaking and entering: Host penetration by the fungal rice blast pathogen Magnaporthe grisea. Annu. Rev. Microbiol. 50, 491–512 (1996). - PubMed
    1. Latijnhouwers M., de Wit P. J., Govers F., Oomycetes and fungi: Similar weaponry to attack plants. Trends Microbiol. 11, 462–469 (2003). - PubMed
    1. Rocha R. O., Elowsky C., Pham N. T., Wilson R. A., Spermine-mediated tight sealing of the Magnaporthe oryzae appressorial pore–rice leaf surface interface. Nat. Microbiol. 5, 1472–1480 (2020). - PubMed