. 2022 Jun 10;7(72):eabn5917.
doi: 10.1126/sciimmunol.abn5917. Epub 2022 Jun 10.

NuRD complex recruitment to Thpok mediates CD4+ T cell lineage differentiation

Affiliations

NuRD complex recruitment to Thpok mediates CD4+ T cell lineage differentiation

Yayi Gao et al. Sci Immunol. .

Abstract

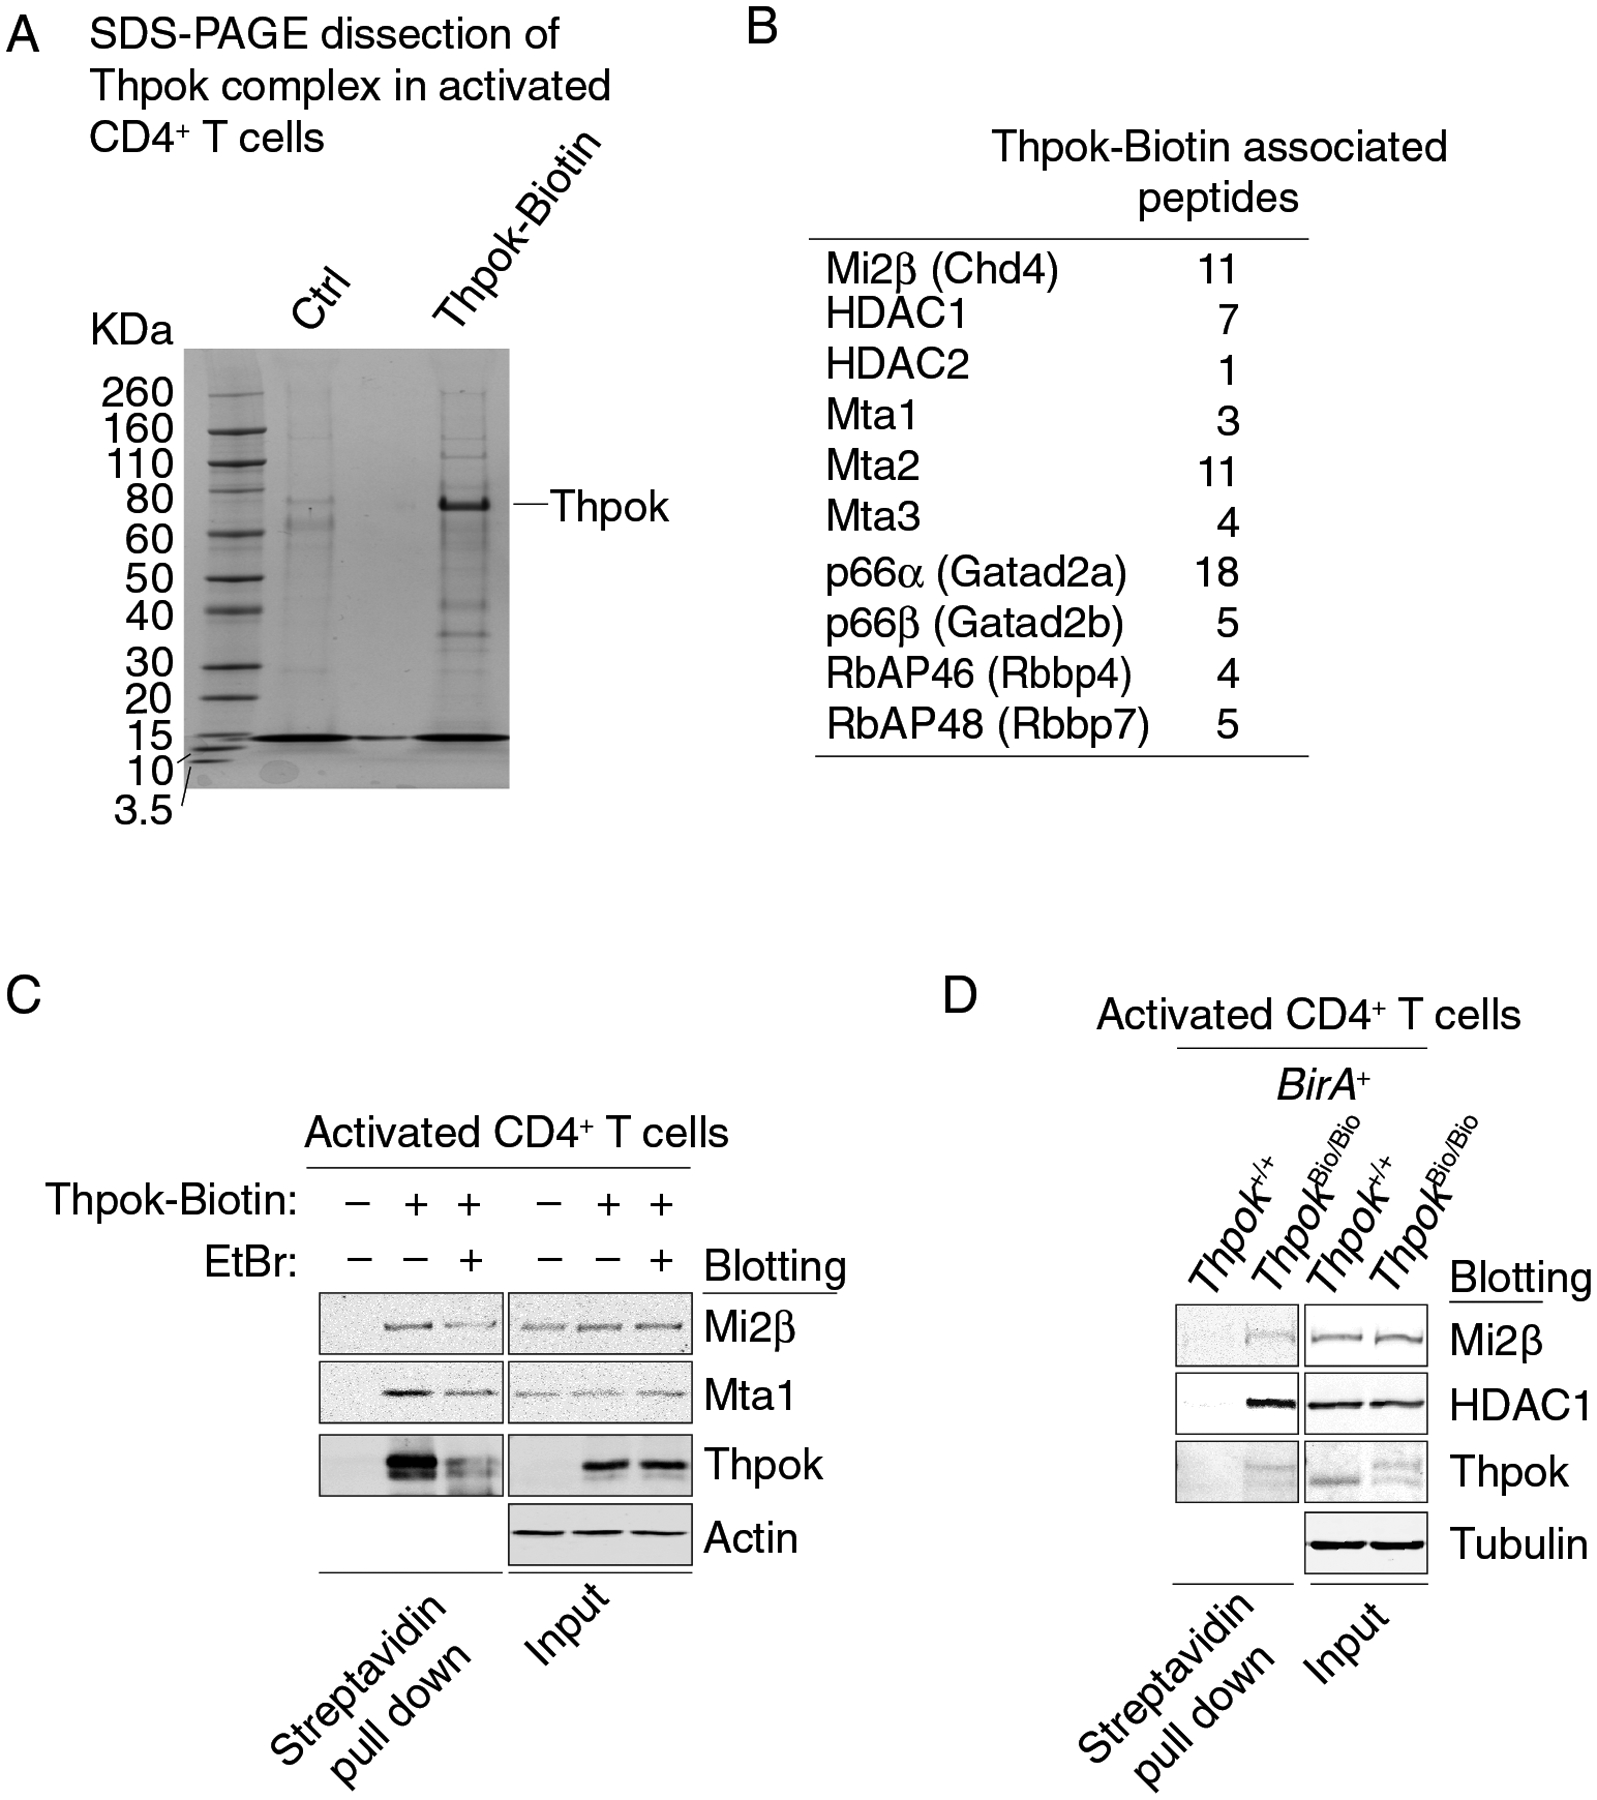
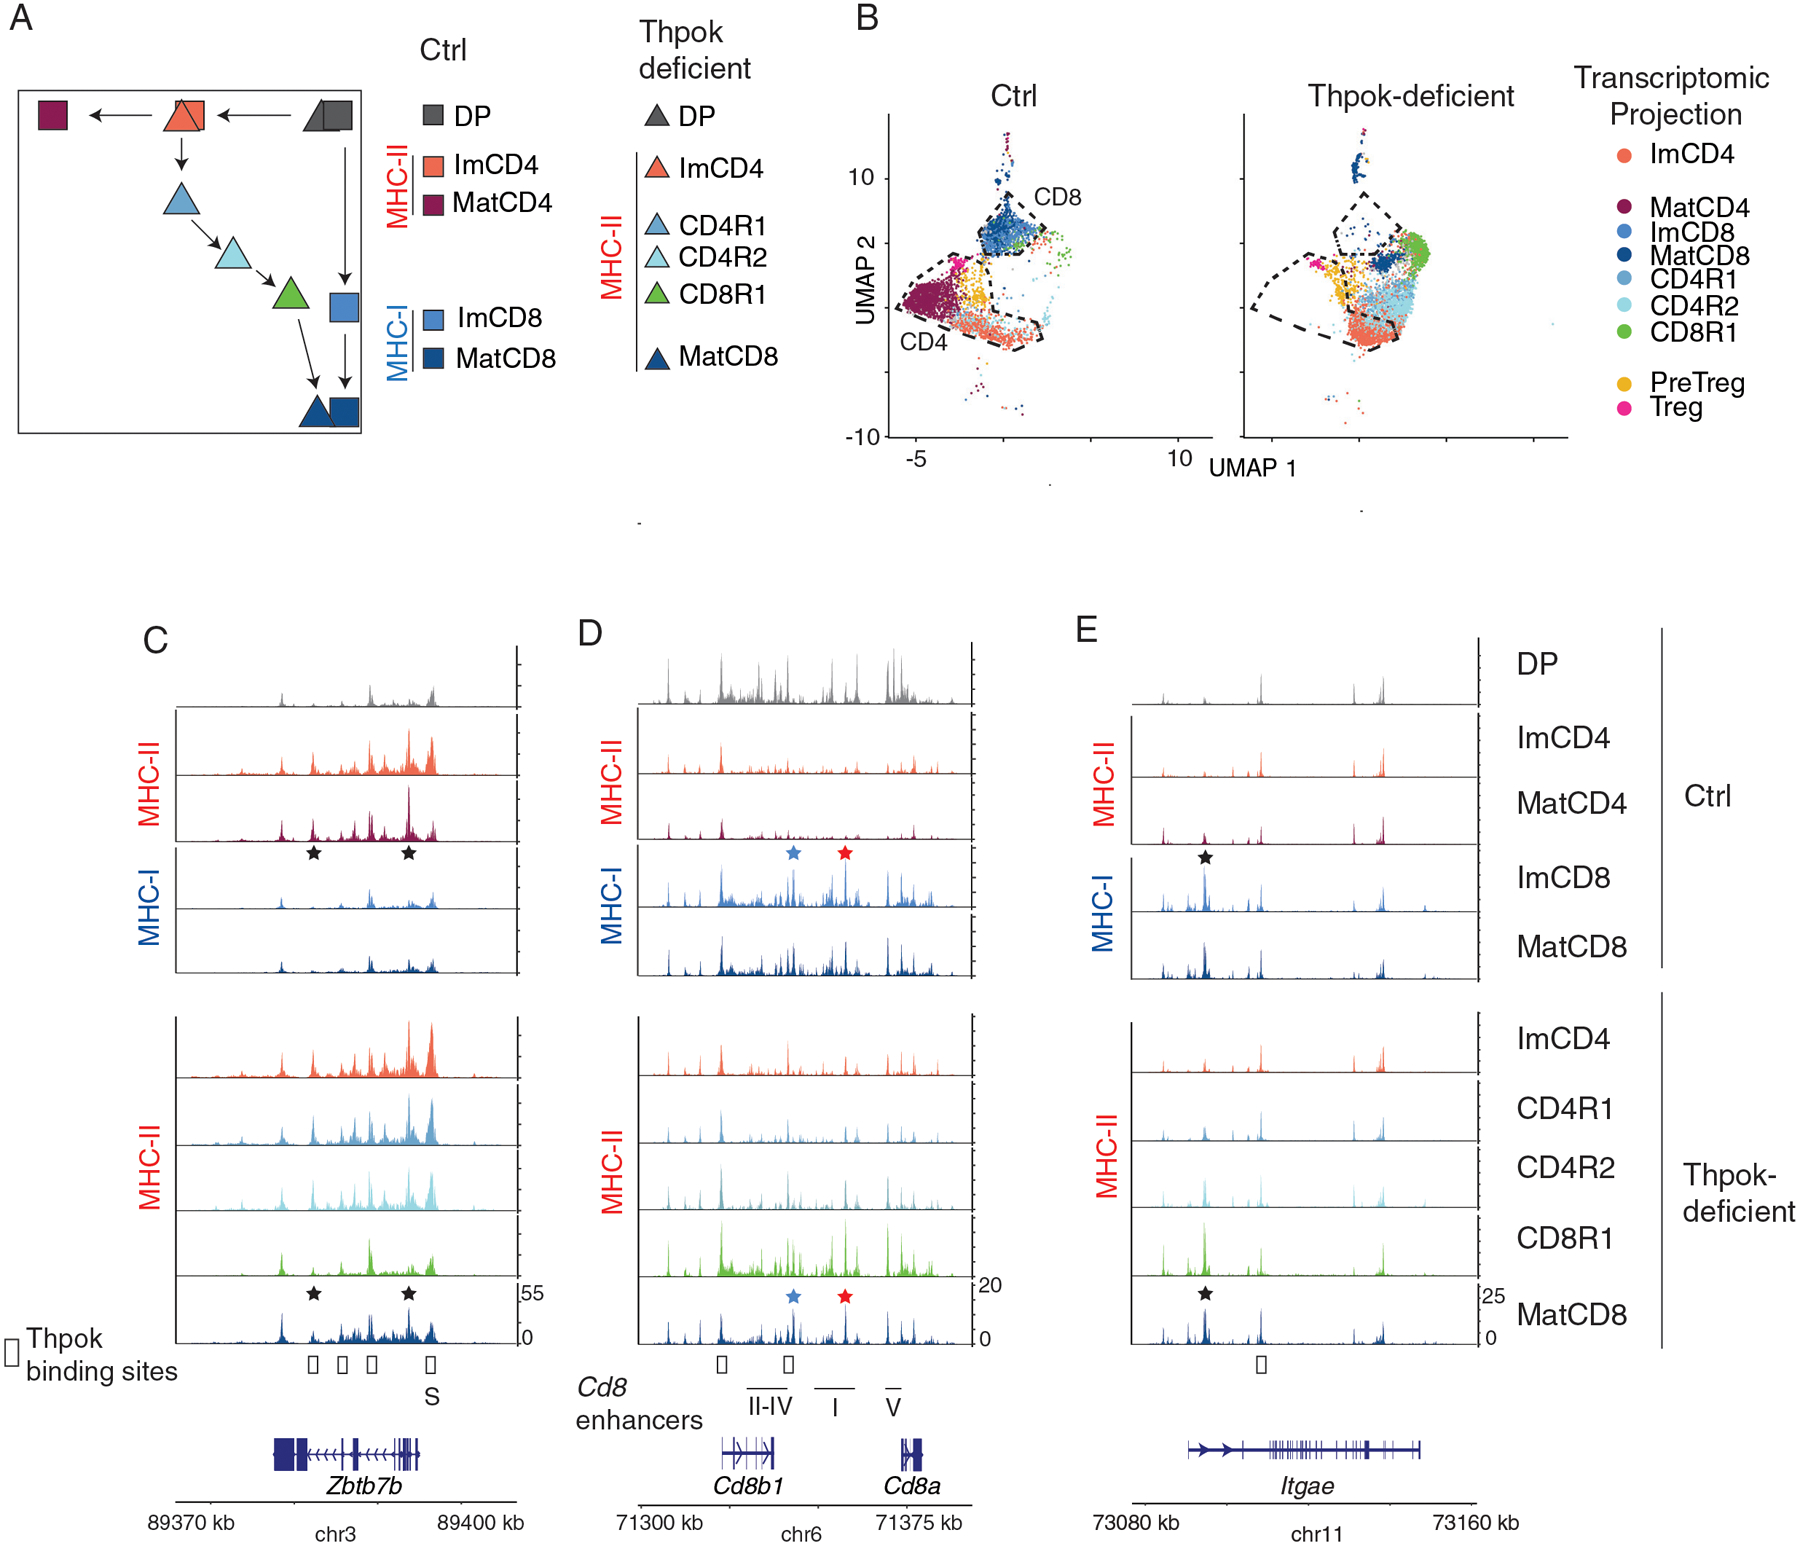
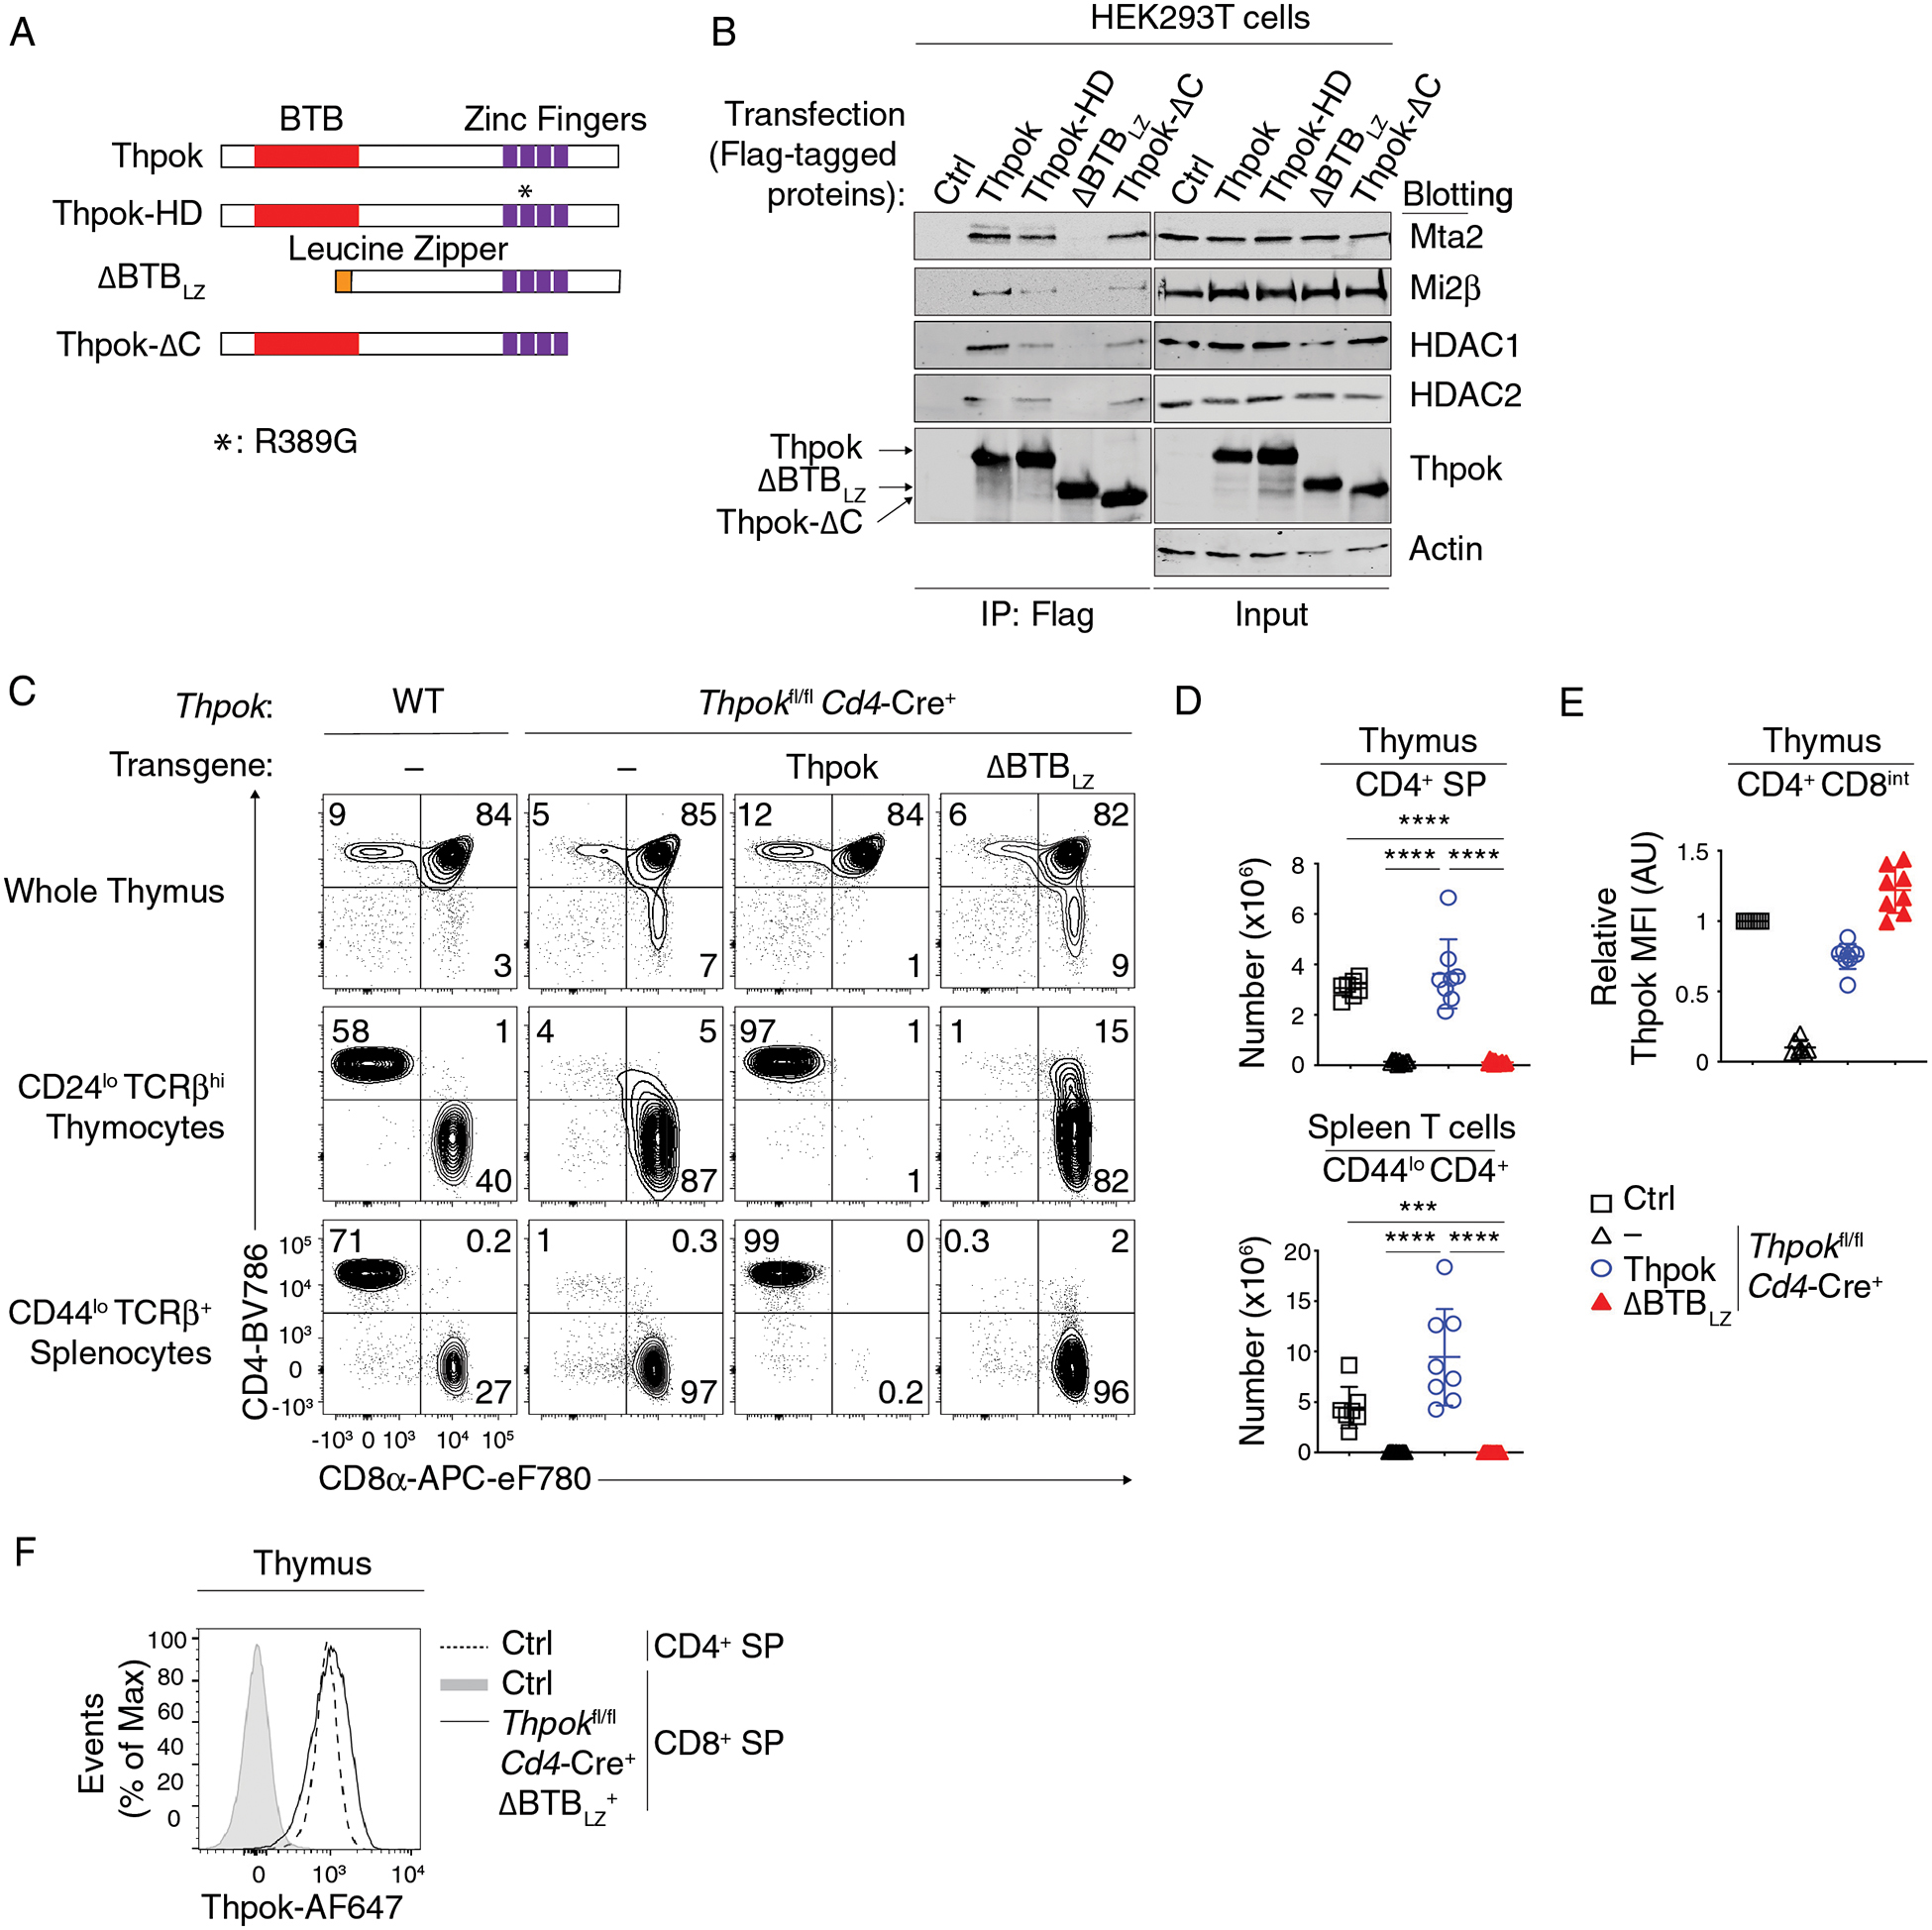
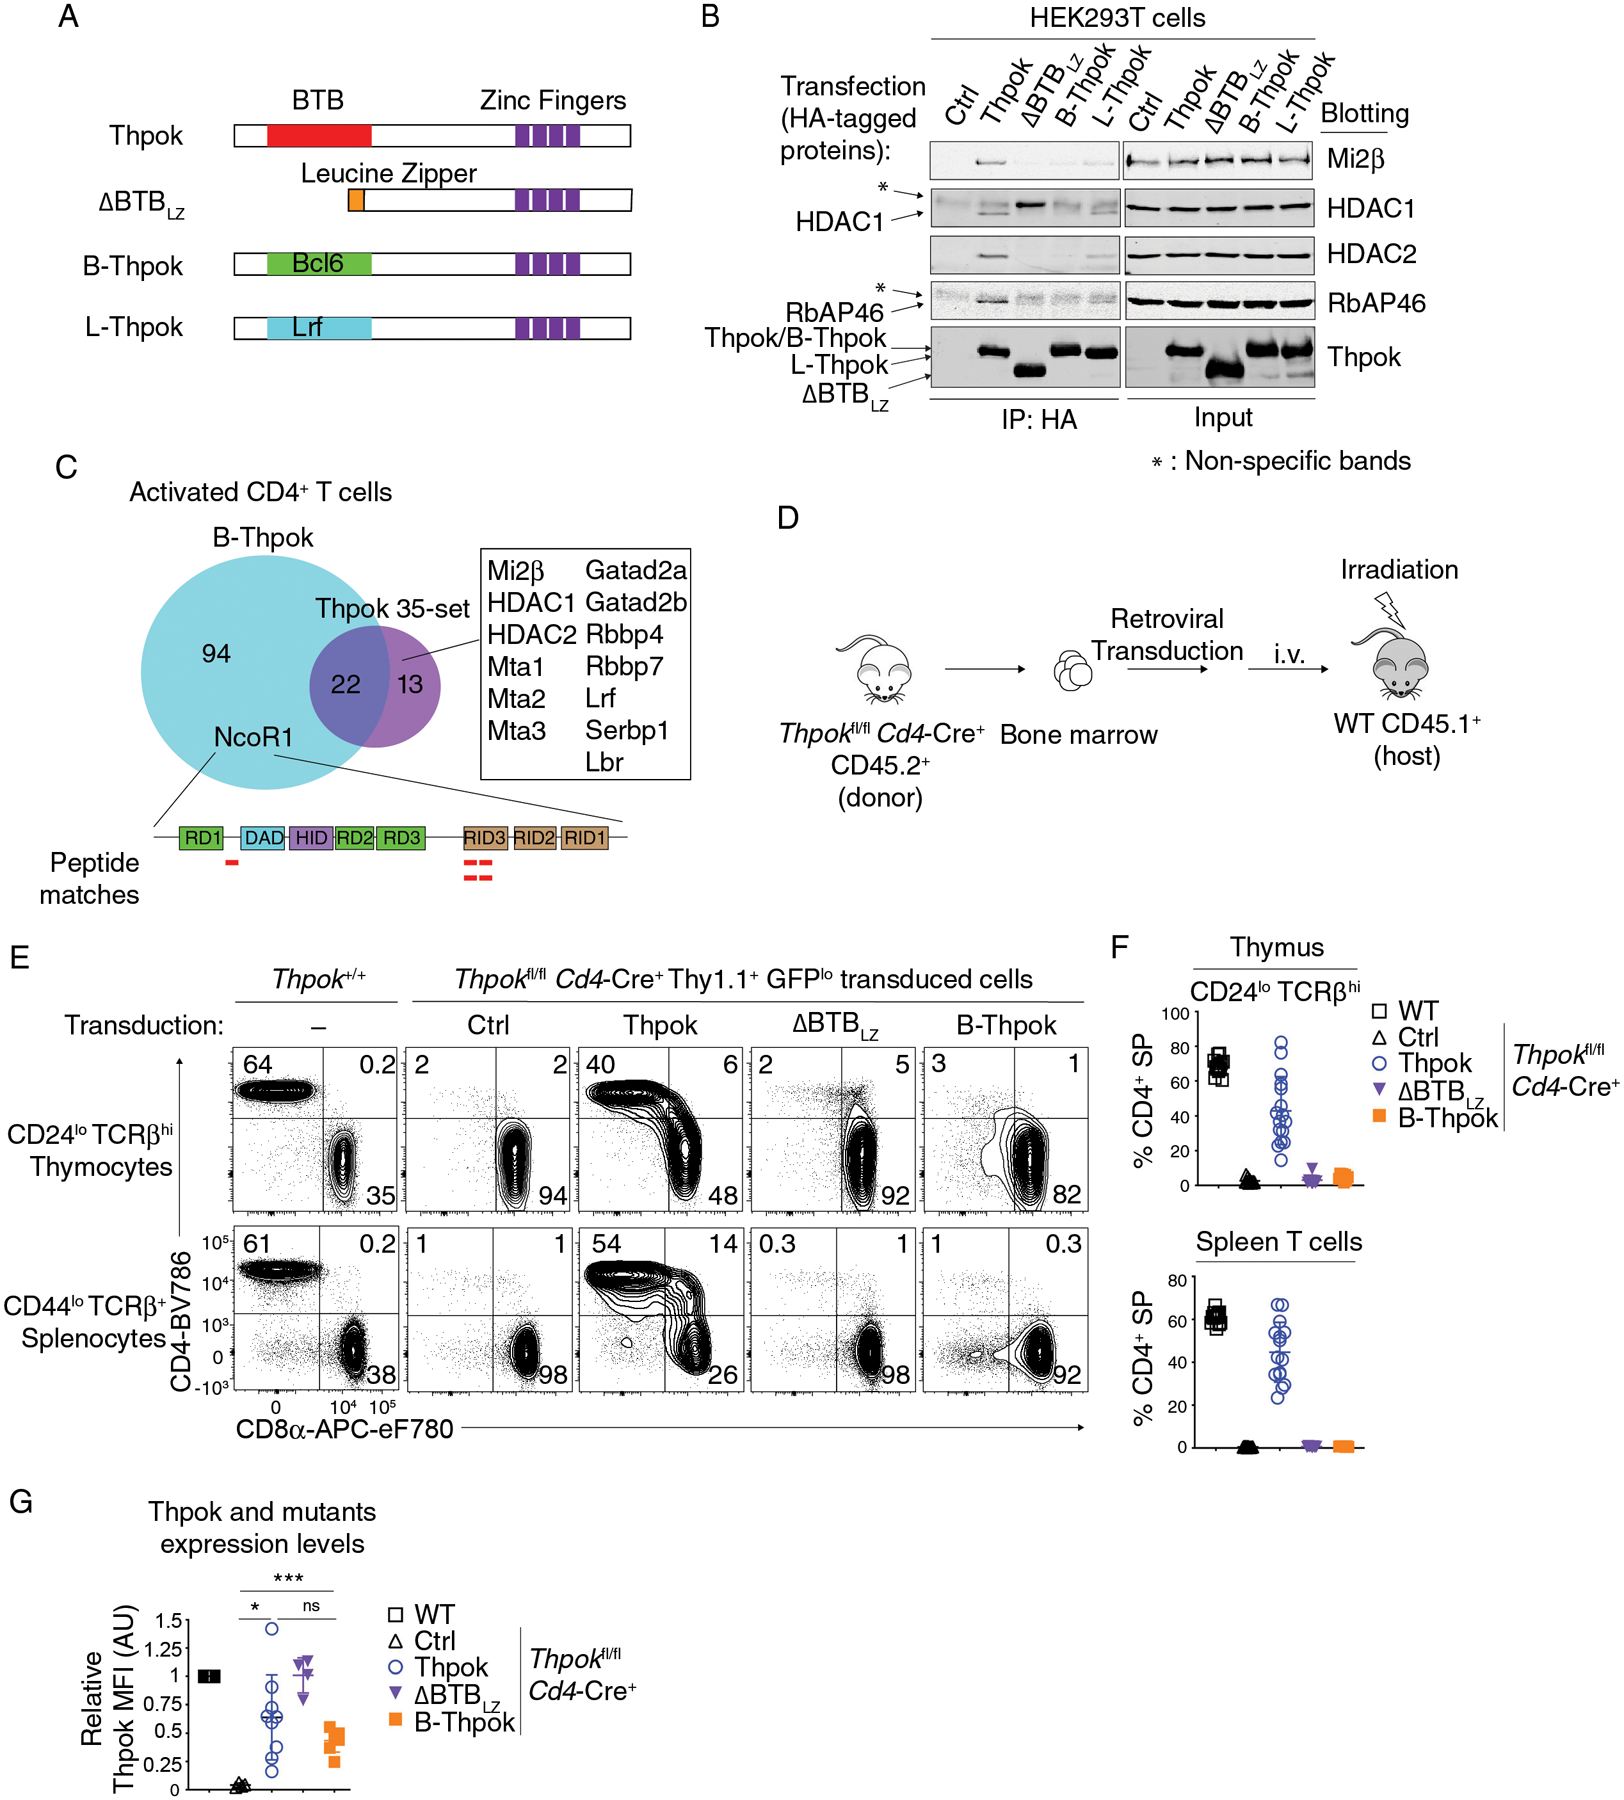
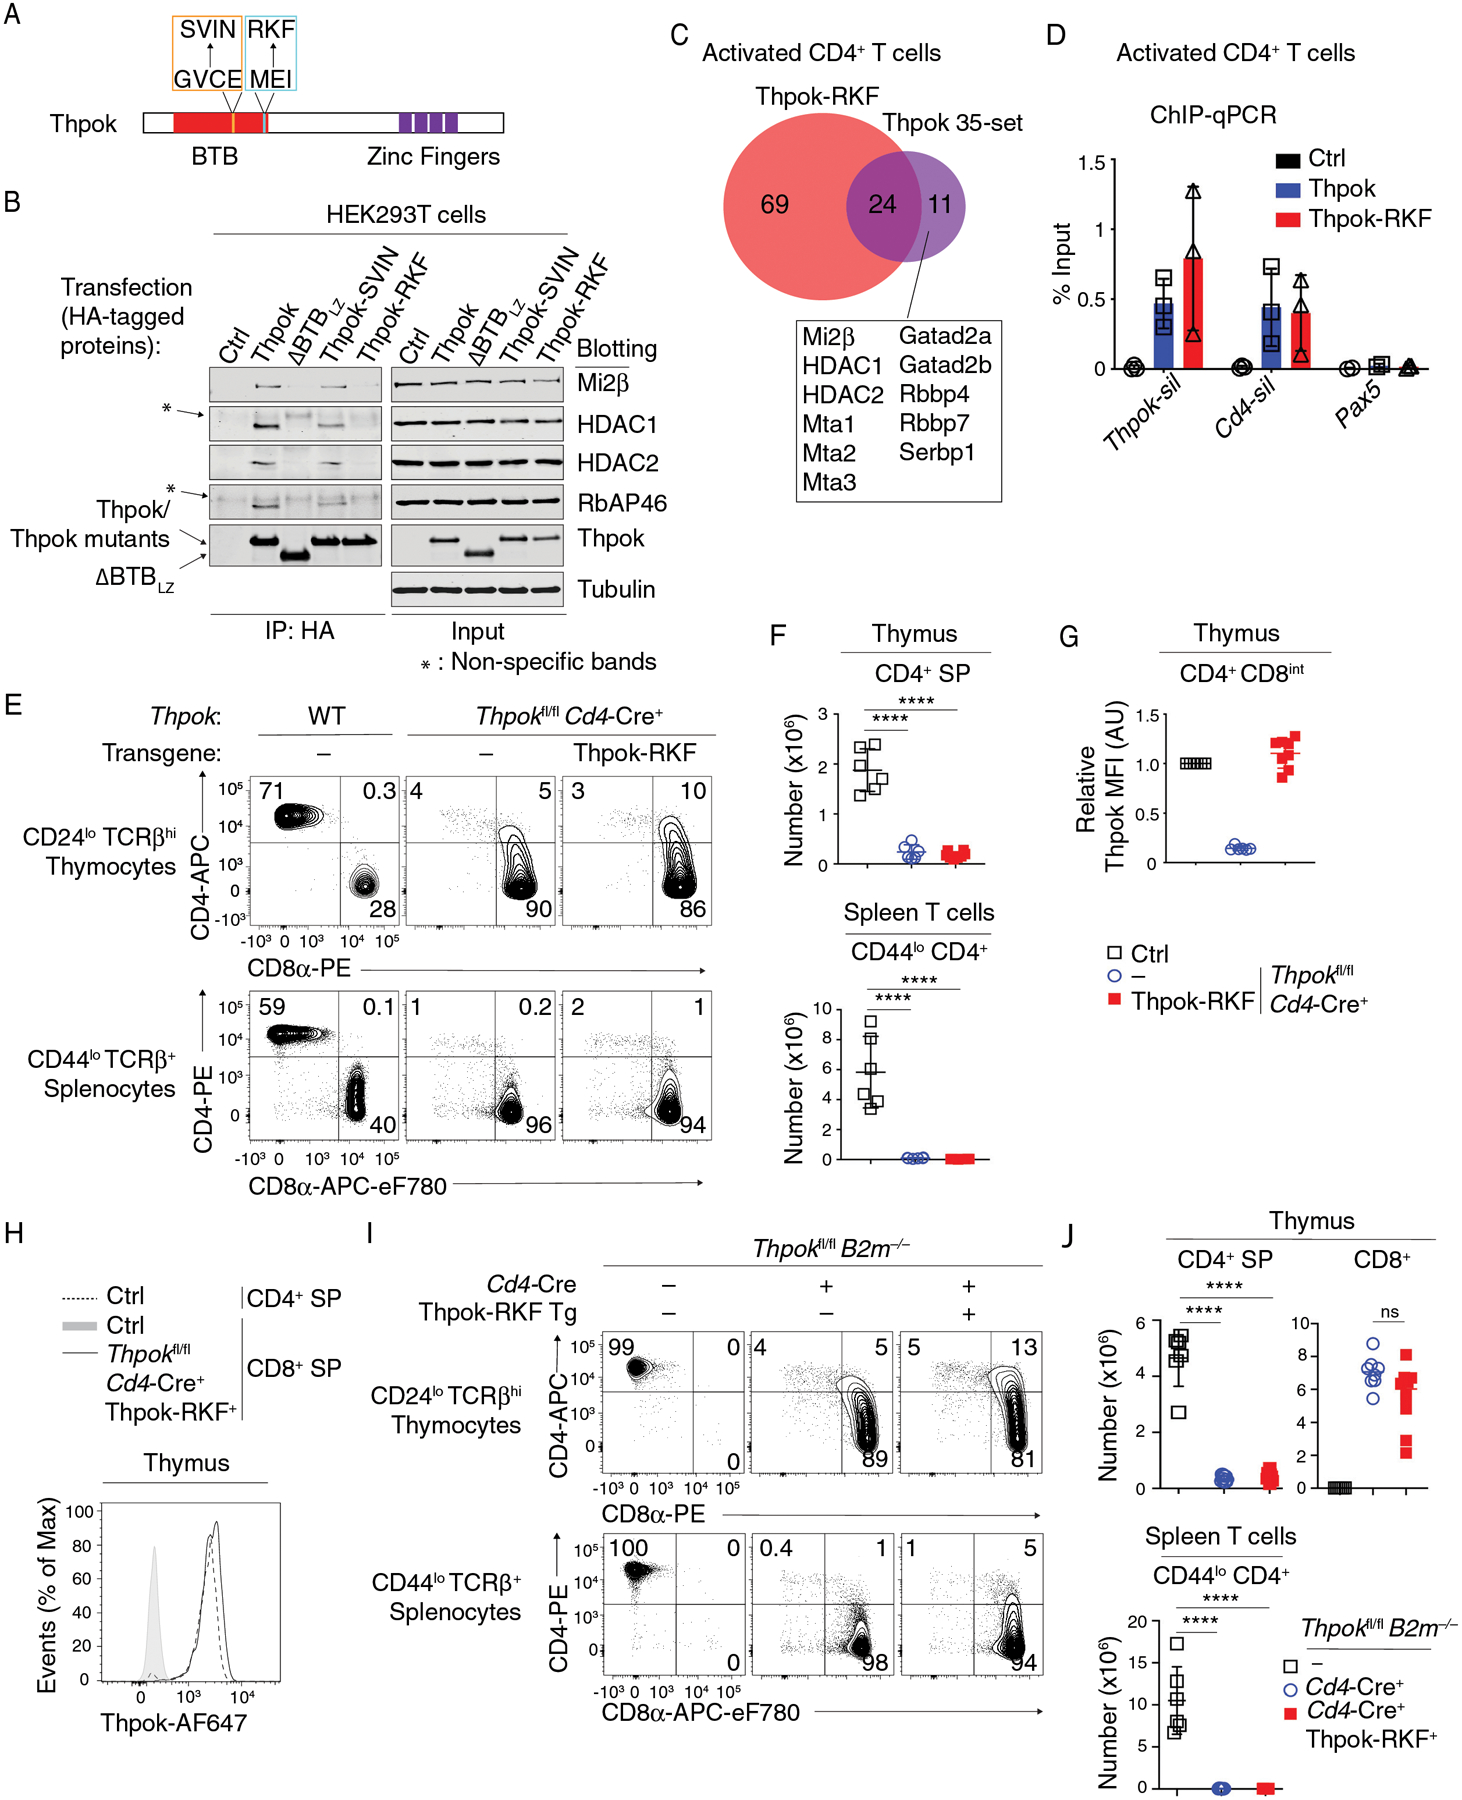
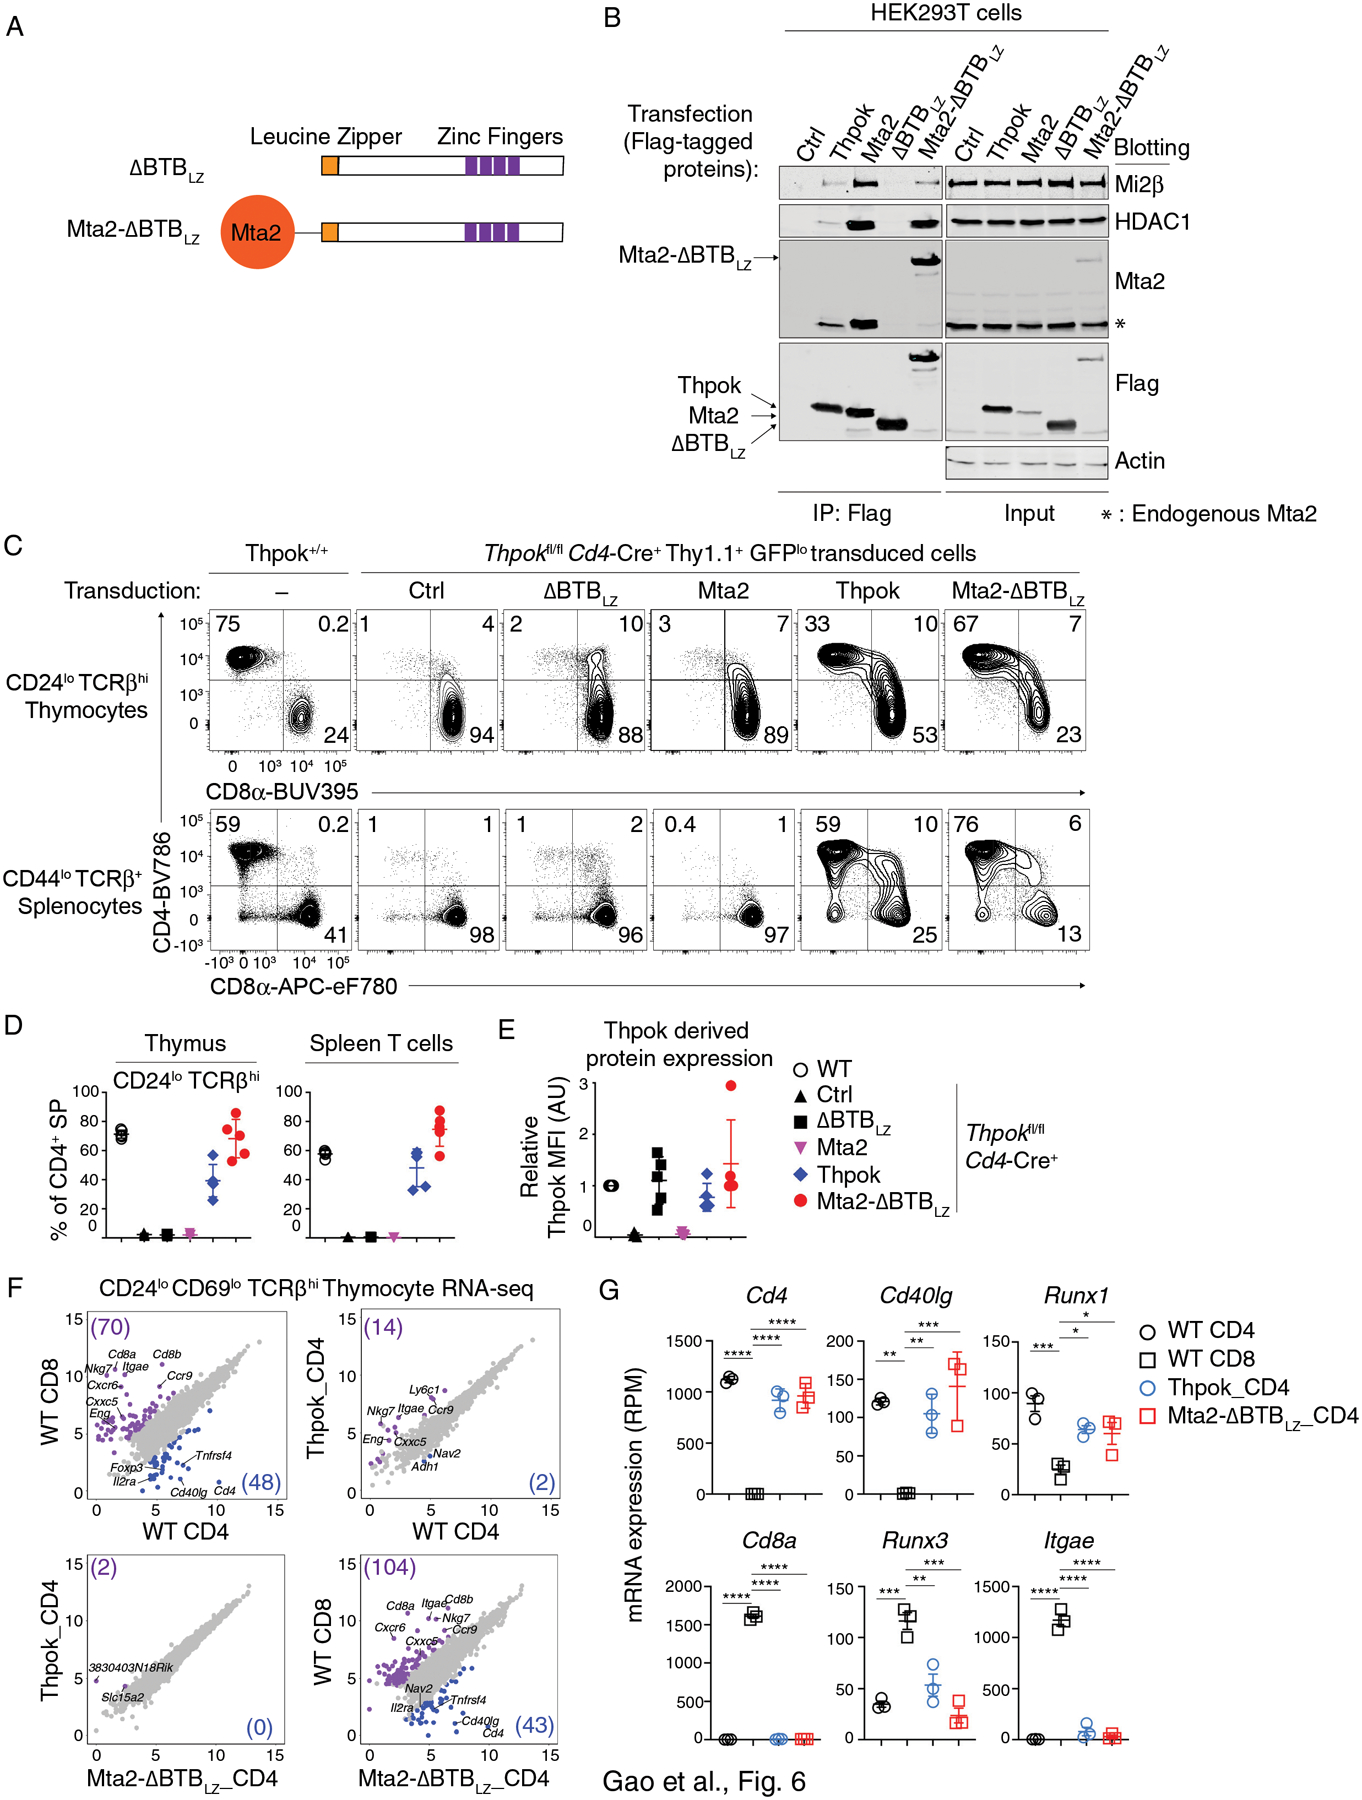
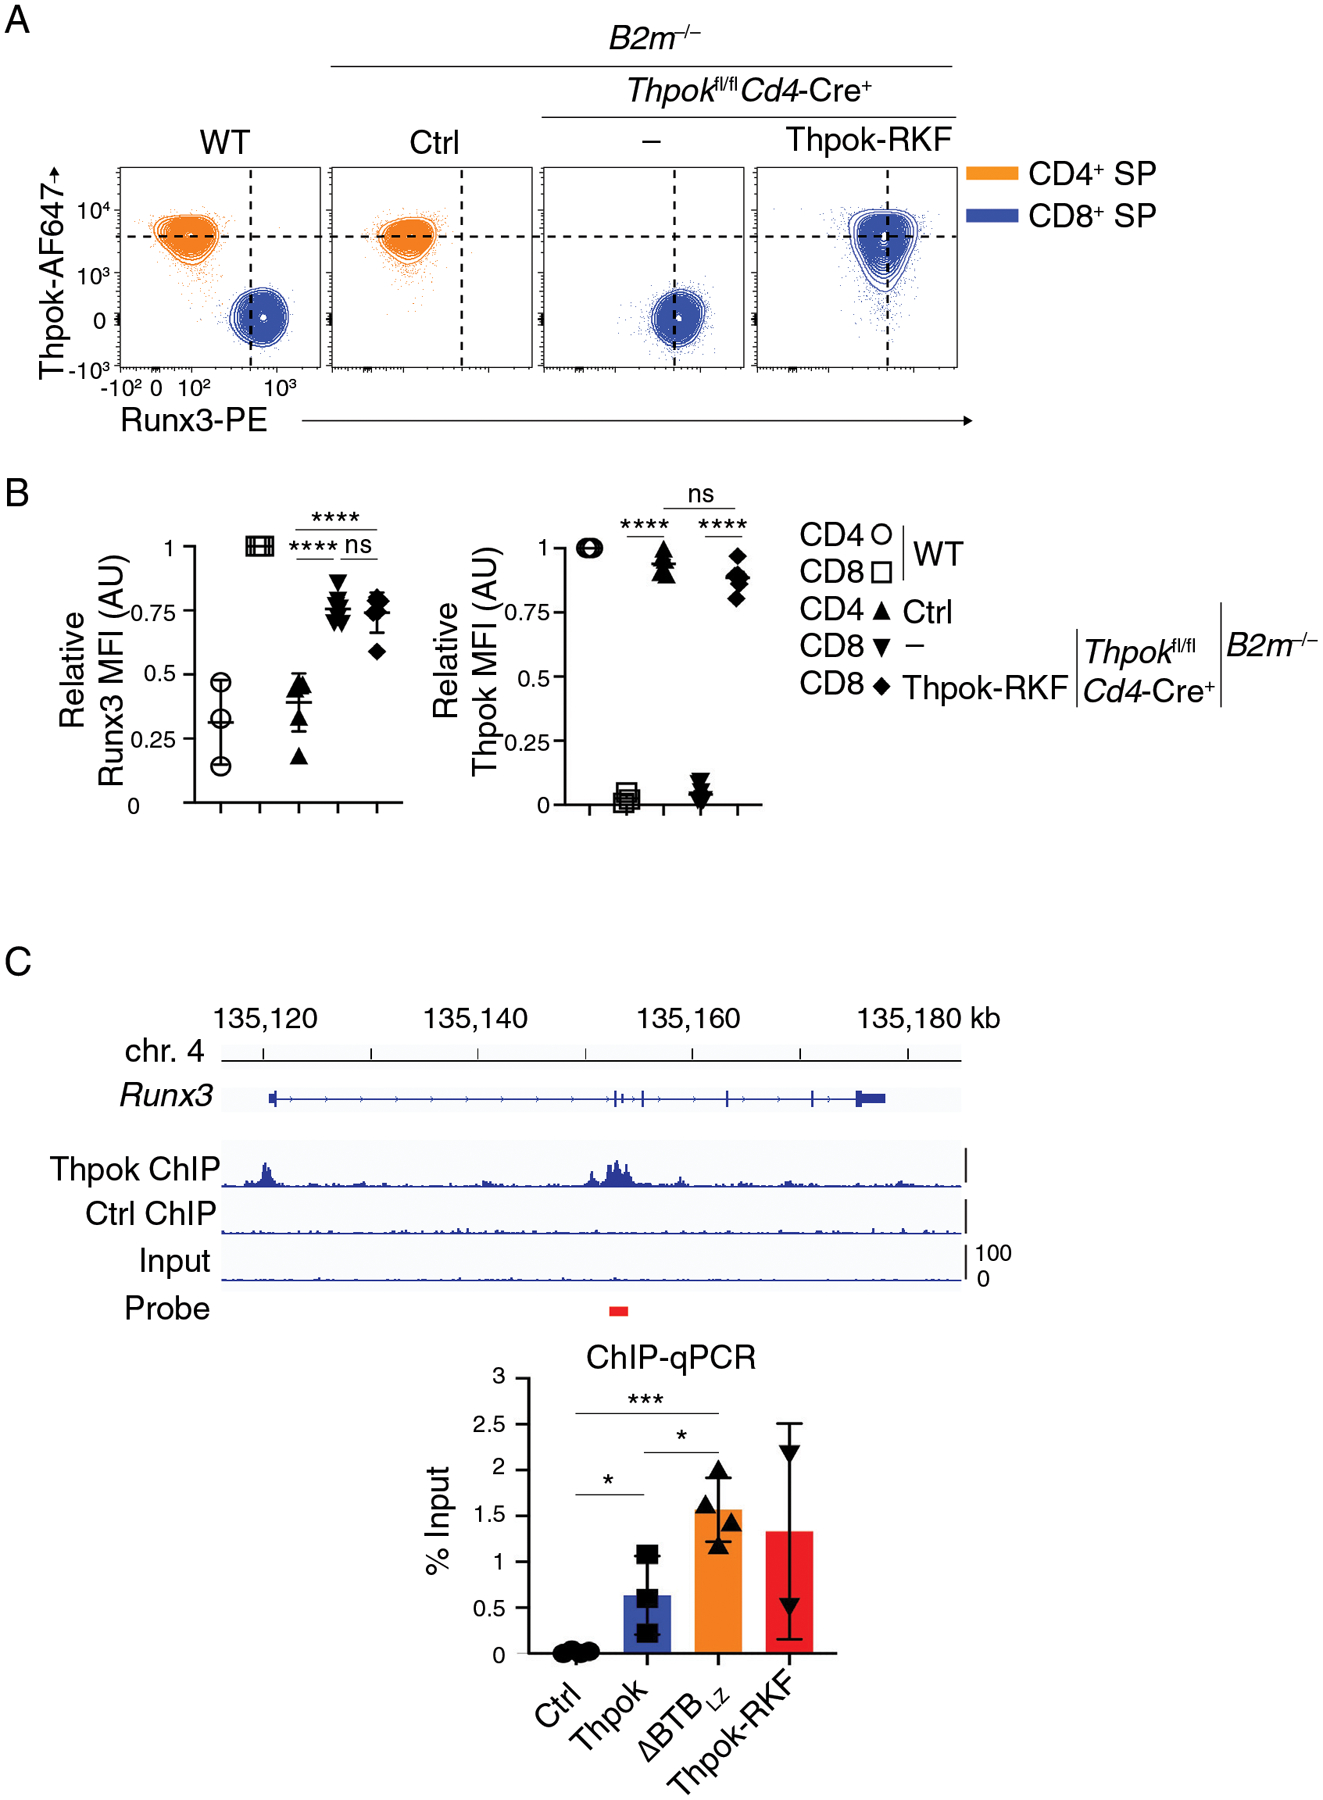
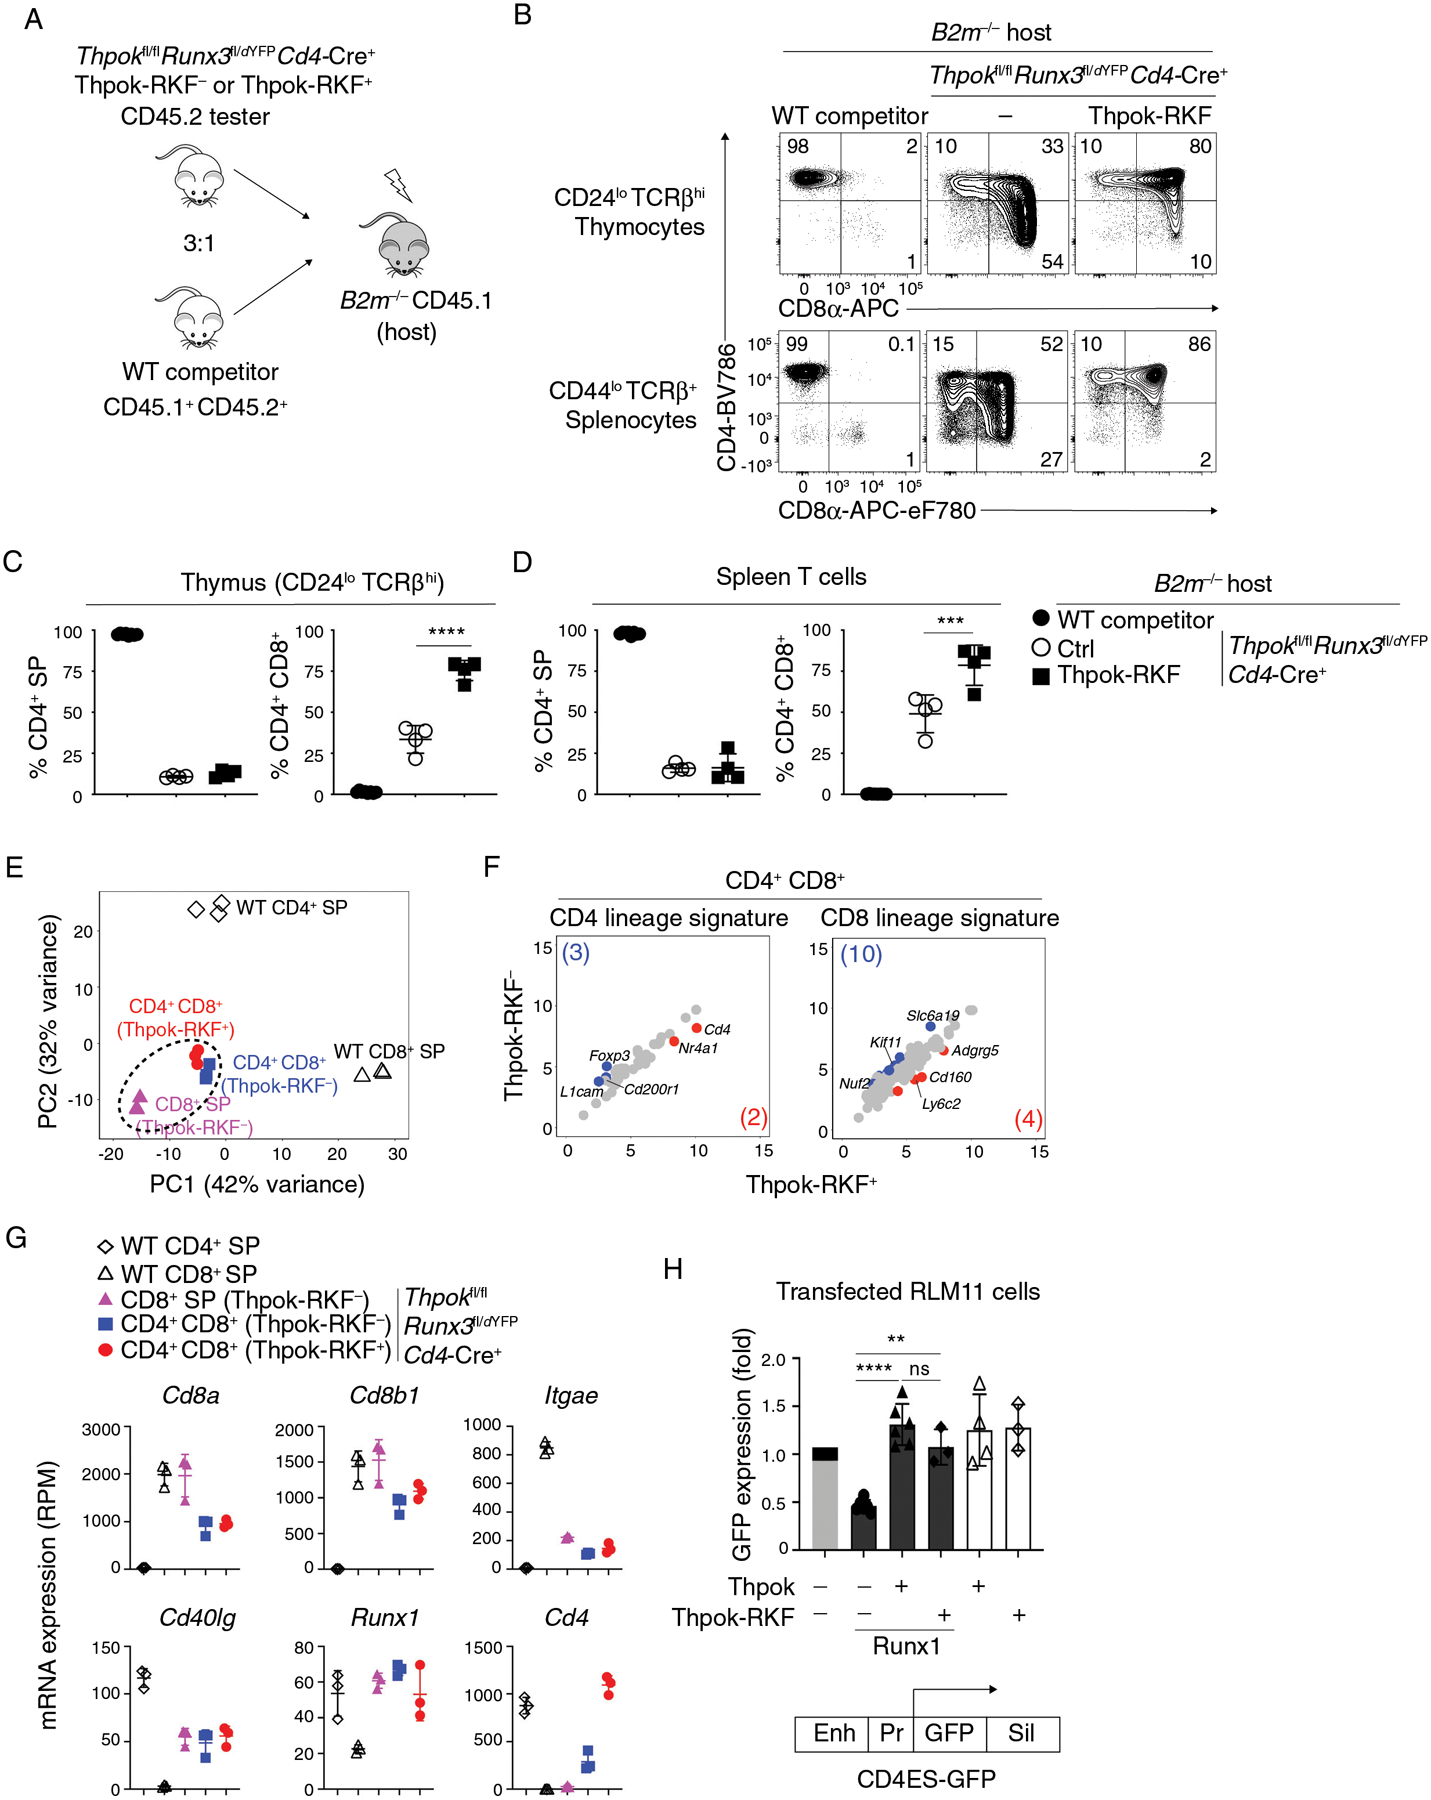
Although BTB-zinc finger (BTB-ZF) transcription factors control the differentiation of multiple hematopoietic and immune lineages, how they function is poorly understood. The BTB-ZF factor Thpok controls intrathymic CD4+ T cell development and the expression of most CD4+ and CD8+ lineage genes. Here, we identify the nucleosome remodeling and deacetylase (NuRD) complex as a critical Thpok cofactor. Using mass spectrometry and coimmunoprecipitation in primary T cells, we show that Thpok binds NuRD components independently of DNA association. We locate three amino acid residues within the Thpok BTB domain that are required for both NuRD binding and Thpok functions. Conversely, a chimeric protein merging the NuRD component Mta2 to a BTB-less version of Thpok supports CD4+ T cell development, indicating that NuRD recruitment recapitulates the functions of the Thpok BTB domain. We found that NuRD mediates Thpok repression of CD8+ lineage genes, including the transcription factor Runx3, but is dispensable for Cd4 expression. We show that these functions cannot be performed by the BTB domain of the Thpok-related factor Bcl6, which fails to bind NuRD. Thus, cofactor binding critically contributes to the functional specificity of BTB-ZF factors, which control the differentiation of most hematopoietic subsets.


Conflict of interest statement

Competing Interests Statement

The authors have no competing interests.

Figures

Figure 1.
Figure 1.. Thpok binds NuRD.
(A) SDS-PAGE and colloidal Coomassie blue staining of streptavidin pull down from activated Thpokfl/fl Ox40-Cre+ Rosa26BirA+ CD4+ T cells retrovirally transduced to express Thpok-Bio or with the empty retroviral vector (pMRx, Ctrl). Molecular markers are shown on the left. (B) Thpok-associated NuRD-related peptides identified by mass spectrometry. (C) Immunoblot analysis of streptavidin pull down (left panel) or whole cell lysates (right panel) from activated CD4+ T cells obtained from Thpokfl/fl Ox40-Cre+ Rosa26BirA+ that had been retrovirally transduced to express Thpok-Bio or with empty pMRx as a control vector (−). EtBr indicates treatment of cell lysates with Ethidium Bromide. Protein blots were probed with antibodies as indicated. (D) Immunoblot analysis of streptavidin pull down (left panel) or whole cell lysates (right panel) from activated CD4+ T cells obtained from Thpok+/+ or ThpokBio/Bio Rosa26BirA+. Protein blots were probed with antibodies as indicated. Data are representative of three independent experiments.
Figure 2.
Figure 2.. Thpok enforces chromatin closure at CD8+-lineage genes.
scATACseq comparison of (i) Ctrl (Thpokfl/fl Cd4-Cre) ThpokGFP+, CD8+ SP and DP thymocytes and (ii) Thpok-deficient (Thpokfl/fl Cd4-Cre+) ThpokGFP+ and DP thymocytes, all from mice carrying a ThpokGFP BAC reporter. Data integrates two biological replicates from each genotype. (A) Schematic CD4-CD8 expression plot showing developmental trajectories of Thpok-sufficient and -deficient thymocytes, and indicating previously identified scRNAseq transcriptomic clusters (43) used for scATACseq analyses. Note that the cluster order shown here, derived from pseudo-time analysis, is consistent with the experimentally determined CD8+-lineage potential of immature Thpok-deficient CD4+ SP thymocytes (109). Imm: immature; Mat: mature; R indicates MHC II-restricted thymocytes undergoing lineage redirection (43). (B) UMAP dimensional reduction plot displaying cells separated by genotype and color-coded as in (A) according to the closest transcriptomic cluster match (43). DP thymocytes were omitted for clarity. Outlines indicate positions of Ctrl CD4+- and CD8+-lineage cells. (C-E) Genome browser tracks show scATACseq signals at indicated genes (bottom), displayed as scaled sequence read density averaged for all cells sharing the indicated transcriptome cluster projection, separated by genotype (noted at the far right) and color-coded as in (A). DP thymocyte tracks are shown for Ctrl cells only. MHC restriction is indicated on the left side of each panel. The positions of Cd8 enhancers E8I-V and of the Thpok silencer (S) are indicated below the gene track (C, D). Stars indicate lineage specific peaks, including CD8+-lineage-specific peaks at Cd8 enhancers E8I (red) E8VI (blue). Open boxes above gene tracks indicate Thpok binding sites (GEO reference GSE148976) (43).
Figure 3.
Figure 3.. The Thpok BTB domain binds NuRD and is needed for CD4+ T cell development.
(A) Schematic diagram of Thpok and mutants thereof. The Thpok BTB domain and zinc finger motifs are depicted by red and purple boxes; the Leucine Zipper sequence (LZ) by the orange box. *: R389G mutation in the ThpokHD mutant (22). (B) Immunoblot analysis of anti-Flag immunoprecipitates (left panel) or whole cell lysates (right panel) from HEK293T cells transfected with control vector (pcDNA3, Ctrl), Flag-tagged Thpok, Thpok-HD, ΔBTBLZ or Thpok-ΔC. Protein blots were probed with antibodies as indicated. Data are representative of more than three independent experiments. (C) Expression of CD4 and CD8 in indicated thymocyte and splenocyte subsets from Thpokfl/fl Cd4-Cre+ mice expressing the indicated Thpok-derived transgene or no transgene (−). (D) Numbers of CD44lo TCRβhi CD24lo CD4+ SP thymocytes (top) and of CD44lo TCRβhi CD4+ splenocytes (bottom) in mice shown in (C). (E) Expression of transgenic Thpok or ΔBTBLZ in CD4+ CD8int TCRβhi CD69+ thymocytes was assessed by intra-cellular staining and flow cytometry and is presented relative to that of Thpok-expressing CD4+ CD8int TCRβhi CD69+ thymocytes in Thpokfl/fl Cd4-Cre littermates (Ctrl), set as 1 in each experiment. (F) Overlaid histograms show expression of transgenic ΔBTBLZ in TCRβhi CD24lo CD4CD8+ thymocytes from Thpokfl/fl Cd4-Cre+ ΔBTBLZ+ mice (plain line) and of endogenous Thpok in CD4+ or CD8+ SP thymocytes from Thpokfl/fl Cd4-Cre (Ctrl) littermates (dotted line and grey-shaded trace, respectively). Data (C-F) are representative of 4 independent experiments totaling n= 7 (Thpokfl/fl Cd4-Cre), 12 (Thpokfl/fl Cd4-Cre+), 8 (Thpokfl/fl Cd4-Cre+ Thpok transgenic) or 14 (Thpokfl/fl Cd4-Cre+ ΔBTBLZ+) mice. One-way ANOVA followed with Tukey multiple comparison tests. ***p<0.001, ****p<0.0001. Error bars indicate standard deviation.
Figure 4.
Figure 4.. Functional specificity of BTB domains.
(A) Schematic diagram of Thpok and chimeric constructs. The Thpok BTB domain and zinc finger motifs are depicted by red and purple boxes; the Leucine Zipper sequence (LZ) by the orange box. The Bcl6 and Lrf BTB domain are depicted by green and cyan box, respectively. (B) Immunoblot analysis of anti-HA immunoprecipitates (left panel) or whole cell lysates (right panel) from HEK293T cells transfected with control vector (pcDNA3, Ctrl), HA-tagged Thpok, ΔBTBLZ, B-Thpok or L-Thpok. Protein blots were probed with antibodies as indicated. * indicates non-specific bands. Data are representative of more than three independent experiments. (C) Venn diagram showing B-Thpok binding partners and Thpok 35-set as detected by mass spectrometry after streptavidin pull down in activated CD4+ T cells. Proteins binding Thpok but not B-Thpok are listed in the box. Peptides from NCoR1 detected in the B-Thpok pull-down are depicted by red lines along the NCoR1 schematic (bottom). RD1–3: Repression Domain; DAD: Deacetylase Activity Domain; HID: Histone Interaction Domain; RID: Receptor Interacting Domain. (D) Schematic diagram of retrogenic mice generation. (E) Expression of CD4 and CD8 in indicated thymocyte and splenocyte subsets from retrogenic mice generated with Ctrl (empty pPMGfIT vector), or Thpok-, ΔBTBLZ- or B-Thpok-expressing pPMGfIT retroviruses. The contour plots are representative of three independent experiments totaling n= 13 (WT, C57BL/6 mice), 12 (Ctrl), 16 (Thpok), 9 (ΔBTBLZ) or 8 (B-Thpok) retrogenic mice. (F) The percentages of CD4+ SP cells in CD44lo CD24lo TCRβhi thymocytes (top) and in CD44lo TCRβ+ splenocytes (bottom) in mice shown in (E). (G) Flow cytometric expression of transduced Thpok, ΔBTBLZ and B-Thpok in CD4+ CD8int TCRβhi CD69+ thymocytes, expressed relative to that of Thpok-expressing CD4+ CD8int TCRβhi CD69+ in WT mice, set as 1 in each experiment. The data are summarized from two independent experiments totaling n= 8 (WT), 4 (Ctrl), 9 (Thpok), 4 (ΔBTBLZ) or 7 (B-Thpok) retrogenic mice. Two-way ANOVA *p<0.05, ***p<0.001, ns: p>0.05. Error bars indicate standard deviation.
Figure 5.
Figure 5.. A NuRD-interacting segment of the Thpok BTB domain is needed for CD4 T cell development.
(A) Schematic diagram of Thpok-SVIN (orange line box) and Thpok-RKF (cyan line box) mutations. (B) Immunoblot analysis of anti-HA immunoprecipitates (left) or whole cell lysates (right) from HEK293T cells transfected with control vector (pcDNA3, Ctrl), HA-tagged Thpok, ΔBTBLZ, Thpok-SVIN or Thpok-RKF. Protein blots were probed with antibodies as indicated. * indicates non-specific bands. Data are representative of three independent experiments. (C) Venn diagram showing Thpok-RKF binding partners and Thpok 35-set as detected by mass spectrometry after streptavidin pull down in activated CD4+ T cells. Proteins binding Thpok but not Thpok-RKF complex are listed in the box. (D) ChIP-qPCR was performed on Thpok and Cd4 silencer elements, and on a region of Pax5 (negative control), from in vitro activated CD4+ T cells from Thpokfl/fl Ox40-Cre+ Rosa26BirA+ that had been retrovirally transduced with empty pMRx (Ctrl), or pMRx expressing Thpok-Bio or Thpok-RKF-Bio. Data are expressed as percent of input DNA. Each symbol represents a separate determination, and the figure summarizes three independent experiments. (E) Expression of CD4 and CD8 in indicated thymocyte and splenocyte subsets from indicated mice. (F) Numbers of CD44lo CD24lo TCRβhi CD4+ SP thymocytes (top) and of CD44lo TCRβ+ CD4+ splenocytes (bottom) in mice shown in (E). (G) Flow cytometric expression of transgenic Thpok-RKF in CD4+ CD8int TCRβhi CD69+ thymocytes, shown relative to that of Thpok-expressing CD4+ CD8int TCRβhi CD69+ in Thpokfl/fl Cd4-Cre littermates (Ctrl), set as 1 in each experiment. (H) Overlaid histograms show expression of transgenic Thpok-RKF in CD24lo TCRβhi CD4 CD8+ thymocytes from Thpokfl/fl Cd4-Cre+ Thpok-RKF+ mice (plain line) and of endogenous Thpok in CD4+ or CD8+ SP thymocytes from Thpokfl/fl Cd4-Cre (Ctrl) littermates (dotted line and grey-shaded trace, respectively). Data (E-H) are representative of three independent experiments totaling n= 6 (Thpokfl/fl Cd4-Cre littermates), 6 (Thpokfl/fl Cd4-Cre+) or 8 (Thpokfl/fl Cd4-Cre+ Thpok-RKF+) mice. One-way ANOVA followed with Tukey multiple comparison tests ****p<0.0001. Error bars indicate standard deviation. (I) Expression of CD4 and CD8 in indicated thymocyte and splenocyte subsets from Thpokfl/fl B2m−/− mice expressing or not the Thpok-RKF transgene. (J) Numbers of CD44lo CD24lo TCRβhi thymocytes, CD4+ CD8 (top left) or CD8+ (including CD4+ and CD4, top right) and of CD44lo TCRβ+ CD4+ CD8 splenocytes (bottom) in mice shown in (I). Data (I-J) are representative three independent experiments totaling n= 6 (Cd4-Cre littermates), 8 (Cd4-Cre+) or 10 (Cd4-Cre+ Thpok-RKF+) mice. One-way ANOVA followed with Tukey multiple comparison tests ****p<0.0001, ns: P>0.05. Error bars indicate standard deviation.
Figure 6.
Figure 6.. NuRD recruitment recapitulates the Thpok BTB domain functions during CD4 T cell development.
(A) Schematic diagram of ΔBTBLZ and Mta2-ΔBTBLZ. (B) Immunoblot analysis of anti-Flag immunoprecipitates (left panel) or whole cell lysates (right panel) from HEK293T cells transfected with empty pcDNA3 (Ctrl), or vectors expressing Flag-tagged versions of Thpok, Mta2, ΔBTBLZ or Mta2-ΔBTBLZ. Protein blots were probed with antibodies as indicated. * indicates endogenous Mta2 protein. Data are representative of three independent experiments. (C) Expression of CD4 and CD8 in indicated thymocyte and splenocyte subsets from retrogenic mice generated with empty pMGfIT (Ctrl), or pMGfIT expressing ΔBTBLZ, Mta2, Thpok, or Mta2-ΔBTBLZ. The contour plots are representative of three independent experiments with 5 mice per transduced vector in each experiment. (D) Percentages of CD4+ CD8 (CD4+ SP) cells among CD44lo CD24lo TCRβhi thymocytes (left panel) and or CD44lo TCRβ+ splenocytes (right panel) from one of three independent experiments with 5 mice per group. (E) Flow cytometric expression of retroviral ΔBTBLZ, Thpok or Mta2-ΔBTBLz in CD4+ CD8int TCRβhi CD69+ thymocytes, presented relative to that of Thpok-expressing CD4+ CD8int TCRβhi CD69+ in WT mice, set as 1 in each experiment. (F) Scatter plots comparing gene expression (log2 RPM [Reads Per Million]) in CD4+ or CD8+ SP thymocytes from wild type mice (WT CD4 and WT CD8, respectively) and in CD4+ SP thymocytes from retrogenic mice (Thpok_CD4 and Mta2-ΔBTBLz_CD4), all purified as CD44lo CD24lo CD69lo TCRβhi as shown in Fig. S7B. Data is from three biological replicates processed separately up to sequencing. Reads mapping to Thpok (endogenous or retrovirally expressed) were omitted from the analyses. Genes with > 4-fold differential expression and FDR < 0.05 between indicated subsets are shown in purple or blue; numbers in corner indicate the count of differentially expressed genes (gene numbers in parentheses). (G) Graphs display expression (RPM) of indicated genes in each cell subset analyzed in (F). Each symbol represents a distinct sample. One-way ANOVA followed with Tukey multiple comparison tests *p<0.05, **p<0.01, ***p<0.001, ****p<0.0001. Error bars indicate standard deviation.
Figure 7.
Figure 7.. Thpok-NuRD binding is needed for Runx3 repression.
(A) Flow cytometric expression of intra-cellular Runx3 and Thpok in CD44lo CD24lo TCRβhi CD4+ SP (orange traces) or CD8+ SP (blue traces) thymocytes from indicated mice. (B) (Left panel) Expression of Runx3 in CD44lo CD24lo TCRβhi CD4+ SP or CD8+ SP thymocytes is presented relative to that of CD44lo CD24lo TCRβhi CD8+ SP in WT mice, set as 1 in each experiment. (Right panel) Expression of transgenic Thpok-RKF in CD44lo CD24lo TCRβhi CD4+ SP or CD8+ SP thymocytes is presented relative to that of endogenous Thpok in CD44lo CD24lo TCRβhi CD4+ SP in WT mice, set as 1 in each experiment. One-way ANOVA followed with Tukey multiple comparison tests. ****p<0.0001, ns: p>0.05. Error bars indicate standard deviation. Data (A, B) are representative of three independent experiments totaling n= 3 (WT), 6 (Cd4-Cre Thpokfl/fl B2m−/−), 7 (Cd4-Cre+ Thpokfl/fl B2m−/−) or 6 (Cd4-Cre+ Thpokfl/fl B2m−/− Thpok-RKF+) mice. (C) (Top) Thpok or Ctrl ChIP-seq traces on the Runx3 loci in activated CD4 T cells (42); the red bar schematizes the PCR probe in experiments below. (Bottom) Bar graph quantifies streptavidin-ChIP of activated CD4+ T cells from Thpokfl/fl Ox40-Cre+ Rosa26BirA+ mice that had been retrovirally transduced with empty pMRx (Ctrl) or with pMRx expressing Thpok-Bio, ΔBTBLZ-Bio or Thpok-RKF-Bio. Data shows the amount of PCR-amplified DNA, expressed as percent of input. Each symbol represents a separate determination, and the figure summarizes three distinct experiments. Unpaired t test. *p<0.05, ***p<0.001. Error bars indicate standard deviation.
Figure 8.
Figure 8.. Runx3-independent function of Thpok-NuRD complexes.
(A) Generation of mixed bone marrow chimeras from CD45.2+ tester (of indicated genotype) and CD45.1+ CD45.2+ (wild-type competitor) cells, analyzed in panels B-G. (B) Expression of CD4 and CD8 in CD44lo TCRβhi CD24lo thymocytes from B2m−/− mixed chimeras generated as in (A). (C, D) Percentage of CD4+ SP (left panel) or CD4+ CD8+ (right panel) cells among tester-derived CD44lo TCRβhi CD24lo thymocytes (C) or CD44lo TCRβ+ splenocytes (D). Data (B-D) are from one set of 4 chimera and are representative of a total of 2 independently generated sets of chimeras with 4–5 mice per group. One-way ANOVA followed with Tukey multiple comparison tests ***p<0.001, ****p<0.0001. Error bars indicate standard deviation. (E-G) RNA-seq analyses of CD44lo CD24lo CD69lo TCRβhi thymocytes of indicated genotypes and purified as in Fig. S8, that were CD4+ SP, CD8+ SP, or CD4+ CD8+. Data is representative of three separate RNA samples for each population (two biological replicates one of which split into two RNA samples subsequently processed separately). (E) Principal-component analysis (PCA) displays cell subsets according to the first two components. Each symbol represents an individual RNAseq sample. (F) Scatter plots comparing CD4 lineage (41 genes) and CD8 lineage signatures (121 genes) (defined as WT CD4+ SP vs WT CD8+ SP, log2 (Fold Change) >2 or <−2, FDR < 0.05, Table S2) in Thpok-RKF and Thpok-RKF+ CD4+ CD8+ thymocytes. X-axis and y-axis present log2 RPM. Genes with 2-fold or greater differential expression between subsets (and FDR < 0.05) are shown in blue and red (gene numbers are shown in parentheses), respectively. (G) Graphs display expression (RPM) of indicated genes in each analyzed cell subset (symbols on top). Each symbol represents a distinct sample. Error bars indicate standard deviation. (H) GFP expression (indicative of Cd4 promoter activity) in RLM-11 cells transfected with (i) a GFP-based reporter plasmid for Cd4 gene expression (schematic at bottom) (ii) a vector expressing Cd8α as an internal control and (iii) expression vectors encoding Runx1, Thpok or Thpok-RKF as indicated. Enh, Pr and Sil indicate the Cd4 proximal enhancer, promoter and silencer, respectively (76, 110). Data are expressed relative to transfection with neither Thpok nor Runx1 vector (leftmost bar) and summarize more than three independent experiments. Each symbol represents a separate transfection. One-way ANOVA followed with Tukey multiple comparison tests. Unpaired t test. **p<0.01, ****p<0.0001, ns, p>0.05. Error bars indicate standard deviation.

Comment in

References

    1. Cheng ZY, He TT, Gao XM, Zhao Y, Wang J, ZBTB Transcription Factors: Key Regulators of the Development, Differentiation and Effector Function of T Cells. Front Immunol 12, 713294 (2021). - PMC - PubMed
    1. Ellmeier W, Taniuchi I, The role of BTB-zinc finger transcription factors during T cell development and in the regulation of T cell-mediated immunity. Current topics in microbiology and immunology 381, 21–49 (2014). - PubMed
    1. Savage AK, Constantinides MG, Han J, Picard D, Martin E, Li B, Lantz O, Bendelac A, The transcription factor PLZF directs the effector program of the NKT cell lineage. Immunity 29, 391–403 (2008). - PMC - PubMed
    1. Kovalovsky D, Uche OU, Eladad S, Hobbs RM, Yi W, Alonzo E, Chua K, Eidson M, Kim HJ, Im JS, Pandolfi PP, Sant’Angelo DB, The BTB-zinc finger transcriptional regulator PLZF controls the development of invariant natural killer T cell effector functions. Nature immunology 9, 1055–1064 (2008). - PMC - PubMed
    1. Masuda T, Wang X, Maeda M, Canver MC, Sher F, Funnell AP, Fisher C, Suciu M, Martyn GE, Norton LJ, Zhu C, Kurita R, Nakamura Y, Xu J, Higgs DR, Crossley M, Bauer DE, Orkin SH, Kharchenko PV, Maeda T, Transcription factors LRF and BCL11A independently repress expression of fetal hemoglobin. Science 351, 285–289 (2016). - PMC - PubMed

Publication types

MeSH terms

Substances