Editorial
. 2022 Sep 6;3(5):428-443.
doi: 10.1158/2643-3230.BCD-21-0075.

Follicular Lymphoma Microenvironment Characteristics Associated with Tumor Cell Mutations and MHC Class II Expression

Affiliations
Editorial

Follicular Lymphoma Microenvironment Characteristics Associated with Tumor Cell Mutations and MHC Class II Expression

Guangchun Han et al. Blood Cancer Discov. .

Abstract

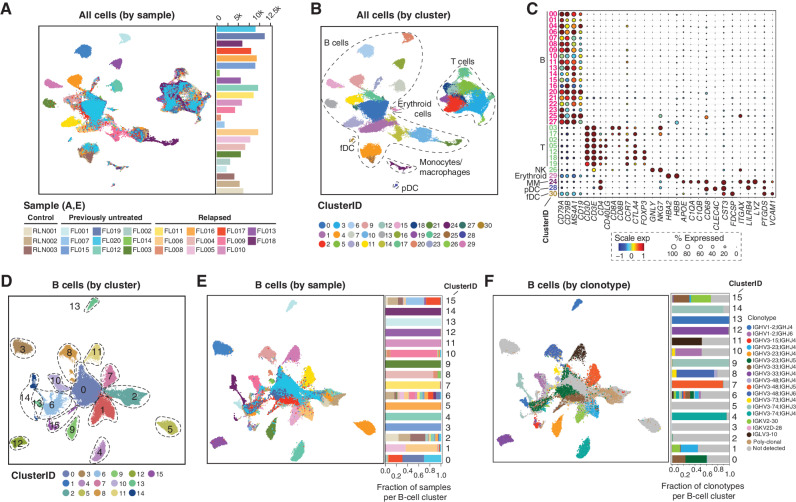
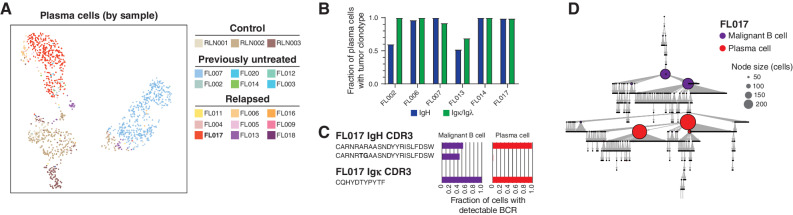
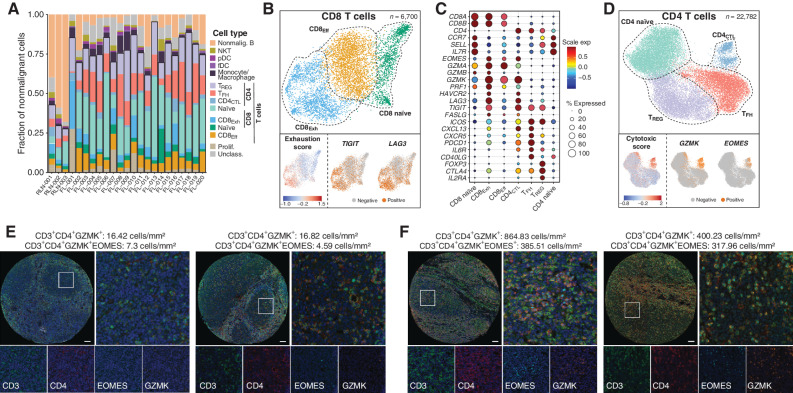
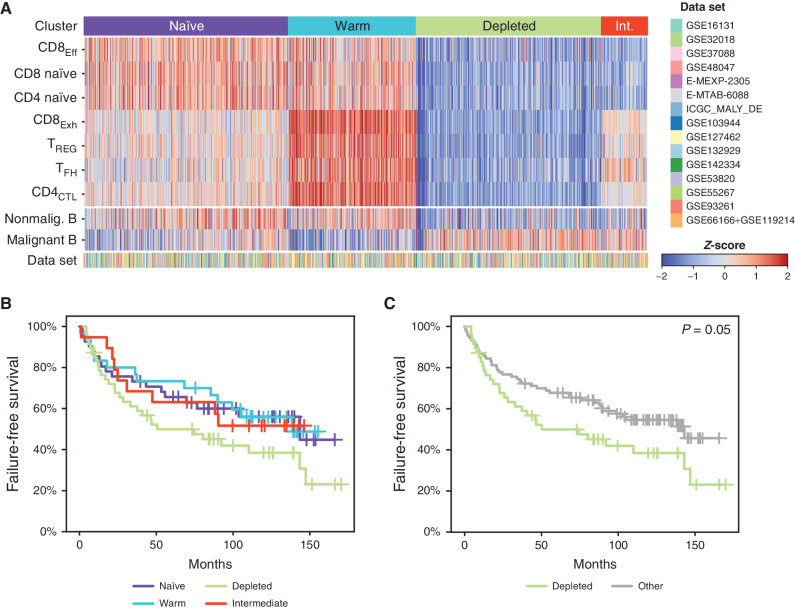
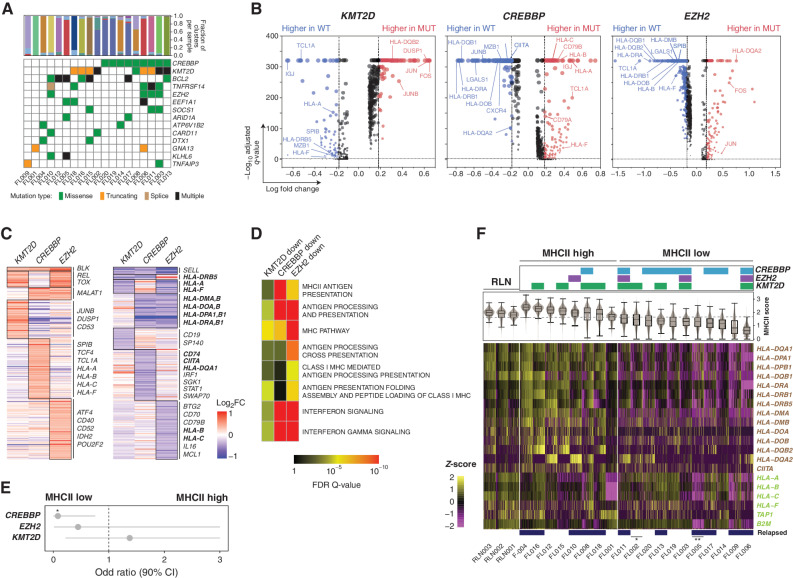
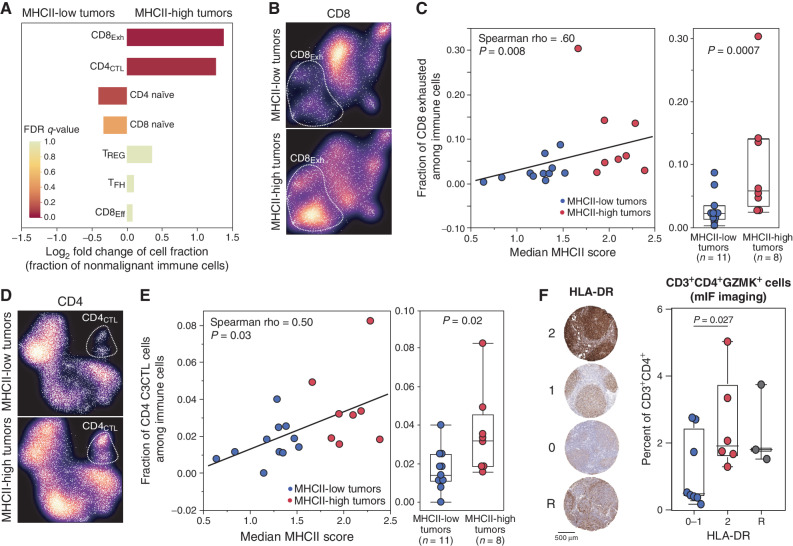
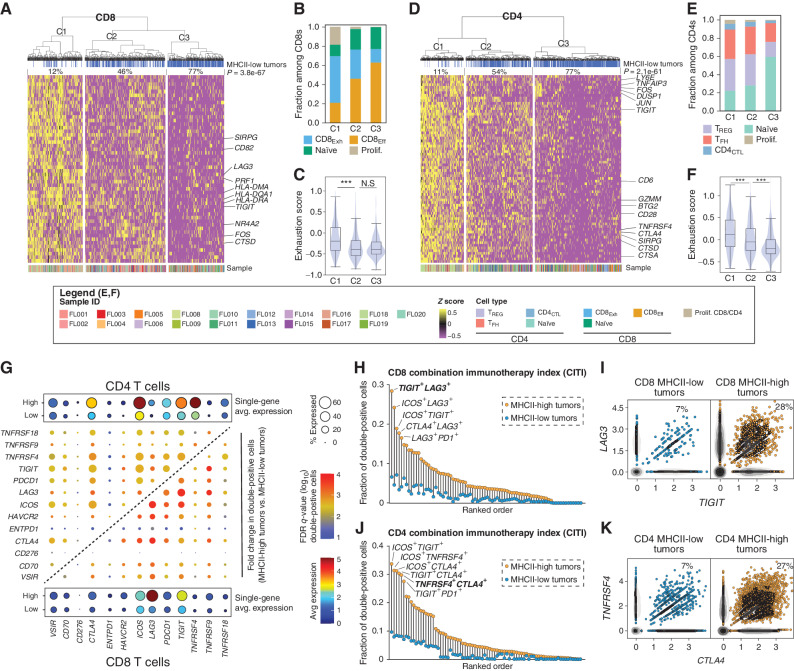
Follicular lymphoma (FL) is a B-cell malignancy with a complex tumor microenvironment that is rich in nonmalignant immune cells. We applied single-cell RNA sequencing to characterize the diverse tumor and immune cell populations of FL and identified major phenotypic subsets of FL T cells, including a cytotoxic CD4 T-cell population. We characterized four major FL subtypes with differential representation or relative depletion of distinct T-cell subsets. By integrating exome sequencing, we observed that somatic mutations are associated with, but not definitive for, reduced MHC expression on FL cells. In turn, expression of MHCII genes by FL cells was associated with significant differences in the proportions and targetable immunophenotypic characteristics of T cells. This provides a classification framework of the FL microenvironment in association with FL genotypes and MHC expression, and informs different potential immunotherapeutic strategies based upon tumor cell MHCII expression.

Significance: We have characterized the FL-infiltrating T cells, identified cytotoxic CD4 T cells as an important component that is associated with tumor cell-intrinsic characteristics, and identified sets of targetable immune checkpoints on T cells that differed from FLs with normal versus low MHC expression. See related commentary by Melnick, p. 374. This article is highlighted in the In This Issue feature, p. 369.


Figures

Figure 1. Overview of major cell types and clusters from scRNA-seq of 20 FL tumors. A and B, UMAP plots show 137,147 cells from 20 FL tumors and 3 RLN controls by sample ID (A) and cluster ID (B). Major cell types are annotated in B. C, Bubble plot of cell lineage marker genes are shown for B-cell, T-cell, NK cell, erythroid, monocyte/macrophage (MM), plasmacytoid dendritic cell (pDC), and follicular dendritic cell (fDC) clusters. D–F, UMAP plots show reclustering of 99,610 B cells by cluster ID (D), sample ID (E), and immunoglobulin clonotype (F). Among B-cell clusters, we identified those corresponding to nonmalignant B cells (C2), proliferating cells (C6), and plasma cells (C15). A malignant B-cell cluster bearing cells from multiple samples was identified (C0). The contribution of each sample to each cluster is shown in the bar graph in E, with many clusters consisting of tumor B cells from a single sample as determined by immunoglobulin clonotype (F) or patterns of inferred CNV (Supplementary Fig. S1).
Figure 1.
Overview of major cell types and clusters from scRNA-seq of 20 FL tumors. A and B, Uniform Manifold Approximation and Projection (UMAP) plots show 137,147 cells from 20 FL tumors and 3 RLN controls by sample ID (A) and cluster ID (B). Major cell types are annotated in B. C, Bubble plot of cell lineage marker genes are shown for B-cell, T-cell, NK-cell, erythroid, monocyte/macrophage (MM), plasmacytoid dendritic cell (pDC), and follicular dendritic cell (fDC) clusters. D–F, UMAP plots show reclustering of 99,610 B cells by cluster ID (D), sample ID (E), and immunoglobulin clonotype (F). Among B-cell clusters, we identified those corresponding to nonmalignant B cells (C2), proliferating cells (C6), and plasma cells (C15). A malignant B-cell cluster bearing cells from multiple samples was identified (C0). The contribution of each sample to each cluster is shown in the bar graph in E, with many clusters consisting of tumor B cells from a single sample as determined by immunoglobulin clonotype (F) or patterns of inferred copy-number variation (Supplementary Fig. S1).
Figure 2.
Figure 2.
Plasma cells linked to malignant FL clones. A, UMAP plot showing reclustering of plasma cells (n = 1,275), colored by sample ID. B, Bar plot showing fractions of plasma cells carrying the same clonal expanded immunoglobulin clonotypes, heavy (IgH) and light (Igk/l) chain, as observed in malignant B cells in 6 FL tumors. C, the IgH and IgK CDR3 sequences for the representative case FL-17 and fractions of malignant B and plasma cells with detectable BCR. D, Reconstruction of the immunoglobin variable region gene lineage tree (igTree) based on somatic hypermutation of immunoglobulin genes using scBCR-seq data. Each tree node represents a single mutation (point mutations, deletions, or insertions) separating the CDR3 sequences and the size of the node corresponds to the number of cells carrying a specific CDR3 sequence.
Figure 3.
Figure 3.
Tumor-infiltrating T-cell populations in FL. A, A bar graph shows the composition of nonmalignant immune cell populations within FL, with the majority of cells belonging to the T-cell lineages. B, UMAP plots from reclustering of 6,700 CD8 T cells show 3 major populations aligning with naïve, effector (eff), and exhausted (exh) states. Single-cell GSVA of a CD8 T-cell exhaustion signature shows the highest expression in the CD8Exh cluster, which is also characterized by high expression of TIGIT and LAG3. C, A bubble plot shows the proportion of cells of CD8 and CD4 T-cell clusters expressing known phenotypic marker genes (size of circles) and their average expression levels (color of circles). D, UMAP plots from reclustering of 22,782 CD4 T cells shows 4 major subpopulations aligning with naïve, Treg, TFH, and CD4CTL states. Single-cell GSVA of a cytotoxic score including immune effector molecules shows high expression in the CD4CTL cluster, which is also characterized by high expression of GZMK and EOMES. E and F, Exemplar multispectral immunofluorescence images show the abundance of cytotoxic CD4 T cells within tumors with low (E) or high (F) abundance within the neoplastic follicle. Scale bar, 50 μm.
Figure 4.
Figure 4.
Deconvolution of T-cell signatures in a large independent series of FL tumors. A, A heat map shows the relative proportions of CD8 and CD4 LME T-cell populations inferred by deconvolution of publicly available bulk gene-expression microarray or RNA-sequencing data sets (n = 1,269 FL tumors from 15 data sets). Unsupervised clustering identified 4 characteristic patterns (naïve, warm, depleted, intermediate (Int.)) with a different relative abundance of tumor-infiltrating T-cell populations. Relative B-cell proportion is shown for reference using the same method but was not used for clustering. B and C, Kaplan–Meier curves of FFS for 137 R-CHOP-treated FL patients are shown according to all LME subtypes (B) or comparing the depleted subtype to others (C). P values were calculated using a log-rank test.
Figure 5.
Figure 5.
Effect of somatic mutations on tumor B-cell expression profiles. A, An oncoplot shows recurrently mutated genes in the 19 FL tumors with available DNAs. B, Volcano plots displaying differentially expressed genes (DEG) between tumor B cells from KMT2D (left), CREBBP (middle), or EZH2 (right) wild-type and mutant tumors. Examples are annotated and the full list is provided in Supplementary Table S6. C, Heat maps displaying DEGs with increased (left) or decreased (right) expression associated with each mutation, with genes encoding cell-surface proteins annotated. Genes highlighted in bold belong to the MHCI and MHCII pathways defined by the KEGG pathway database. D, Pathway enrichment analysis of downregulated DEGs associated with each mutation showing an association between MHCII and CREBBP mutation, MHCI and EZH2 mutation, and IFN signaling with both CREBBP and EZH2 mutations. A full list of pathways is in Supplementary Table S8. E, Odds ratio (± 95% CI) is shown for the association between individual mutations and MHCII status (two-tailed Fisher exact test P = 0.028). F, The expression of MHCII (brown, above) and MHCI genes (green, below) is shown for individual tumor B cells from each tumor with available mutation data. Mutations of CREBBP, EZH2, and KMT2D are annotated at the top. Sample IDs are labeled at the bottom and tumors with additional mutations in *CIITA and **B2M that may also affect MHCII and MHCI expression, respectively, annotated by asterisks.
Figure 6.
Figure 6.
Association between tumor MHCII status and tumor-infiltrating T-cell populations. A, A bar graph shows the fold change in cellular fractions of CD8 and CD4 T-cell populations between MHCII-low and MHCII-high tumors, colored by Fisher exact FDR q-value. The CD8Exh (fold change 3.43, Fisher exact q = 0.05) and CD4CTL (fold change 2.11; Fisher exact q = 0.07) populations are significantly higher in MHCII-high tumors compared with MHCII-low tumors. B, UMAP density plots show the relative representation of CD8Exh between MHCII-low (above) or MHCII-high (below) tumors. C, Scatter plot and bar plot show the quantitative and qualitative association between CD8Exh population and either the expression or status of MHCII on tumor B cells, respectively. D, UMAP density plots show the relative representation of CD4CTL, between MHCII-low (above) or MHCII-high (below) tumors. E, Scatter plot and bar plot show the quantitative and qualitative association between CD4CTL population and either the expression or status of MHCII on tumor B cells, respectively. F, IHC staining of HLA-DR was used to assign tumors into high (2), low (0–1), and reactive (R) groups, which were evaluated for the intrafollicular density of CD3+CD4+GZMK+ cytotoxic CD4 T cells. P values between MHCII-high and -low groups were calculated using a one-tailed t test.
Figure 7.
Figure 7.
Association between tumor MHCII status and targetable features of LME T cells. A, DEGs between CD8 T cells from MHCII-low vs. MHCII-high tumors were subjected to unsupervised hierarchical clustering which identified 3 clusters with significantly different proportions of cells from MHCII-low/-high tumors (top track, P = 3.8 × 10−67). B, A bar graph of cell state composition in each DEG cluster from A, which shows higher fractions of CD8Exh cells in C1 and a higher fraction of CD8Eff cells in C3. C, GSVA showed higher expression of exhaustion signature genes in cells within C1 compared with either C2 or C3. D, DEGs between CD4 T cells from MHCII-low vs. MHCII-high tumors were subjected to unsupervised hierarchical clustering which identified 3 clusters with significantly different proportions of cells from MHCII-low/high tumors (top track, P = 2.1 × 10−61). E, A bar graph of cell state composition in each DEG cluster from D, which shows relatively higher fractions of CD4CTL, TFH, and Tregs in C1 and a higher fraction of CD4 naïve cell in C3. F, GSVA showed higher expression of exhaustion signature genes in cells within C1 compared with either C2 or C3. G, A bubble plot shows the average expression of immune-modulatory genes on CD4 (top left) or CD8 (below right) T cells in MHCII-low or -high tumors. The center grid shows the fold change and significance of pairs of immune-modulatory genes between MHCII-low and MHCII-high tumors for CD4 and CD8 T cells. H, The CITI shows the dual expression of pairs of ICT targets in CD8 T cells from MHCII-low (blue) and MHCII-high (yellow) tumors, in the same ranked order. I, Scatter plots show the coexpression of the ICT targets LAG3 and TIGIT on CD8 T cells from MHCII-low (blue) and MHCII-high (yellow) tumors. J, The CITI shows the dual expression of pairs of ICT targets in CD4 T cells from MHCII-low (blue) and MHCII-high (yellow) tumors, in the same ranked order. K, Scatter plots show the coexpression of the ICT targets TNFRSF4 (OX40) and CTLA4 on CD4 T cells from MHCII-low (blue) and MHCII-high (yellow) tumors.

Comment in

Comment on

References

    1. Kridel R, Sehn LH, Gascoyne RD. Pathogenesis of follicular lymphoma. J Clin Invest 2012;122:3424–31. - PMC - PubMed
    1. Green MR, Alizadeh AA. Common progenitor cells in mature B-cell malignancies: implications for therapy. Curr Opin Hematol 2014;21:333–40. - PubMed
    1. Ennishi D, Takata K, Beguelin W, Duns G, Mottok A, Farinha P, et al. . Molecular and genetic characterization of MHC deficiency identifies EZH2 as therapeutic target for enhancing immune recognition. Cancer Discov 2019;9:546–63. - PubMed
    1. Wang G, Chow RD, Zhu L, Bai Z, Ye L, Zhang F, et al. . CRISPR-GEMM pooled mutagenic screening identifies KMT2D as a major modulator of immune checkpoint blockade. Cancer Discov 2020;10:1912–33. - PMC - PubMed
    1. Milpied P, Cervera-Marzal I, Mollichella ML, Tesson B, Brisou G, Traverse-Glehen A, et al. . Human germinal center transcriptional programs are de-synchronized in B cell lymphoma. Nat Immunol 2018;19:1013–24. - PubMed