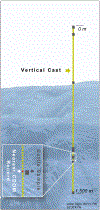
Fluorescence-estimated oil concentration (Foil) in the Deepwater Horizon subsea oil plume
- PMID: 35688067
- PMCID: PMC9972361
- DOI: 10.1016/j.marpolbul.2022.113808
Fluorescence-estimated oil concentration (Foil) in the Deepwater Horizon subsea oil plume
Abstract
Tracking the subsea oil plume during the 2010 Deepwater Horizon Oil Spill (DWH) was conducted using in situ fluorescence via vertical profilers (n = 1157) and discrete sample chemical analyses (n = 7665). During monitoring efforts, discrete samples provided a coarse picture of the oil plume footprint, but the majority of the samples were below standard analytical detection limits for petroleum hydrocarbons. In situ fluorescence data improved the spatial and temporal resolution of the subsea oil plume characterization. Here we synthesized millions of continuous fluorescence data points from hundreds of contemporaneously discrete samples collected to demonstrate how fluorescence could serve as a proxy for Benzene-Toluene-Ethylbenzene-Xylene (BTEX) concentration. Data mined from Gulf Science Data repository were well correlated, and geographically and temporally aligned to provide direct comparisons. Described here are the methods used to calibrate the fluorescence data and to spatially approximate the three-dimensional geographic extent of the oil plume.
Keywords: Deepwater Horizon; Oil spill surveillance; Petroleum hydrocarbons; Submersible fluorescence.
Copyright © 2022. Published by Elsevier Ltd.
Conflict of interest statement
Declaration of competing interest
The authors declare that they have no known competing financial interests or personal relationships that could have appeared to influence the work reported in this paper.
Figures


References
-
- Allen JT, Munoz C, Gardiner J, Reeve KA, Alou-Font E, Zarokanellos N, 2020. Near-automatic routine field calibration/correction of glider salinity data using whitespace maximization image analysis of theta/S data. Front. Mar. Sci 10.3389/fmars.2020.00398. - DOI
-
- American Petroleum Institute, 2016. Technical Report 1154–1: Sunken Oil Detection and Recovery Report, 126pp.
-
- Beegle-Krause J, 2001. General NOAA oil modeling environment (GNOME): a new spill trajectory model. In: Proceedings of the International Oil Spill Conference, Tampa, FL, USA, pp. 865–871. https://meridian.allenpress.com/iosc/article/2001/2/865/138467/GENERAL-N....
-
- Boehm PD, Fiest DL, 1982. Subsurface distribution of petroleum from an offshore well blowout. The Ixtoc-I blowout, Bay of Campeche. Environ. Technol 16, 67–74.
-
- Boehm PD, Murray KJ, Cook LL, 2016. Distribution and attenuation of polycyclic aromatic hydrocarbons in Gulf of Mexico seawater from the Deepwater horizon oil accident. Environ. Sci. Technol 50 (2), 484–492. - PubMed
MeSH terms
Substances
Grants and funding
LinkOut - more resources
Full Text Sources
Medical

