. 2022 Aug:54:102347.
doi: 10.1016/j.redox.2022.102347. Epub 2022 May 25.

The antioxidant enzyme Peroxiredoxin-1 controls stroke-associated microglia against acute ischemic stroke

Affiliations

The antioxidant enzyme Peroxiredoxin-1 controls stroke-associated microglia against acute ischemic stroke

Sinai Kim et al. Redox Biol. 2022 Aug.

Abstract

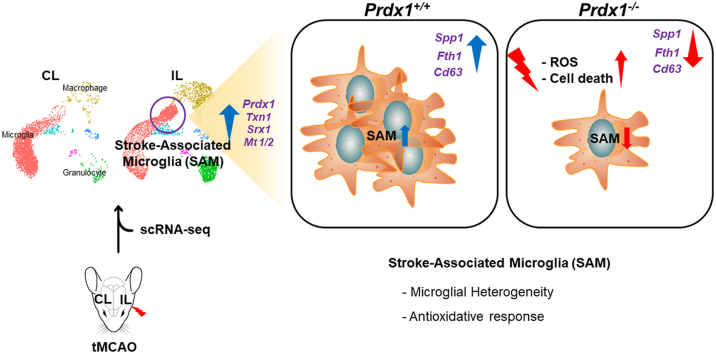
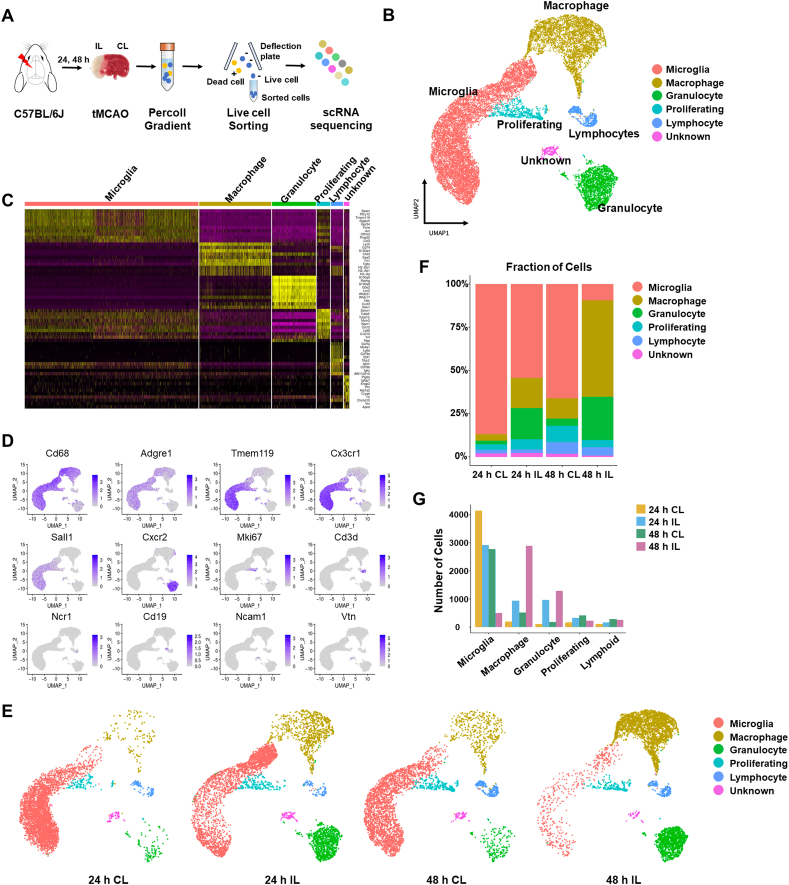
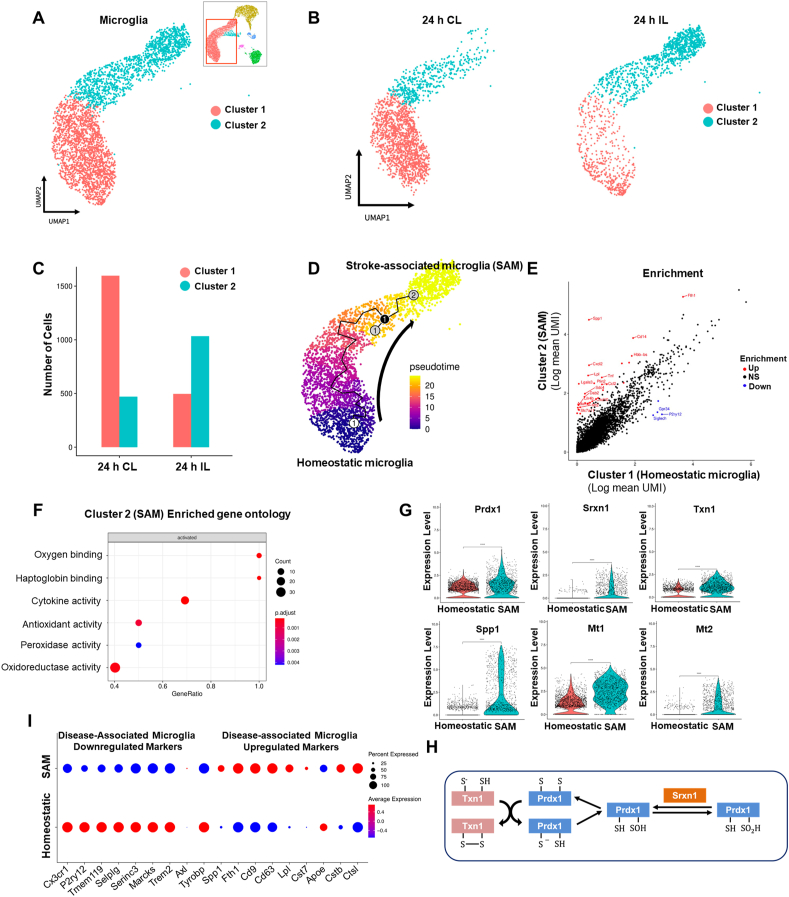
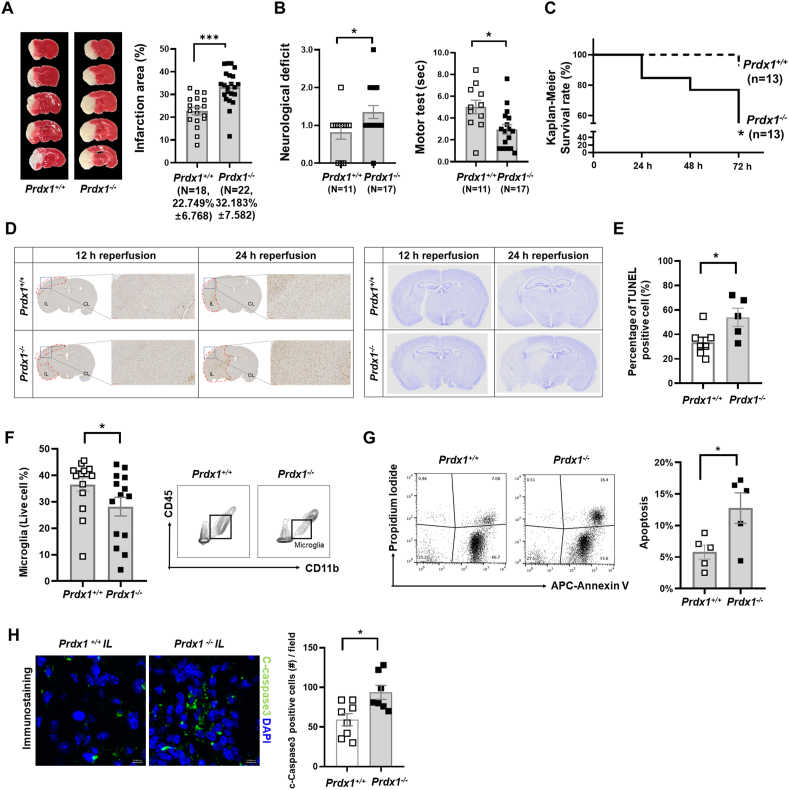
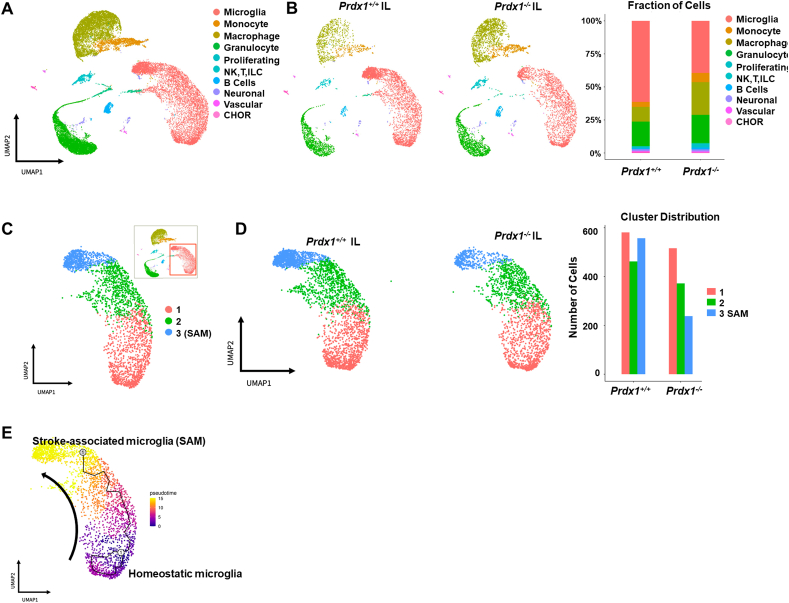
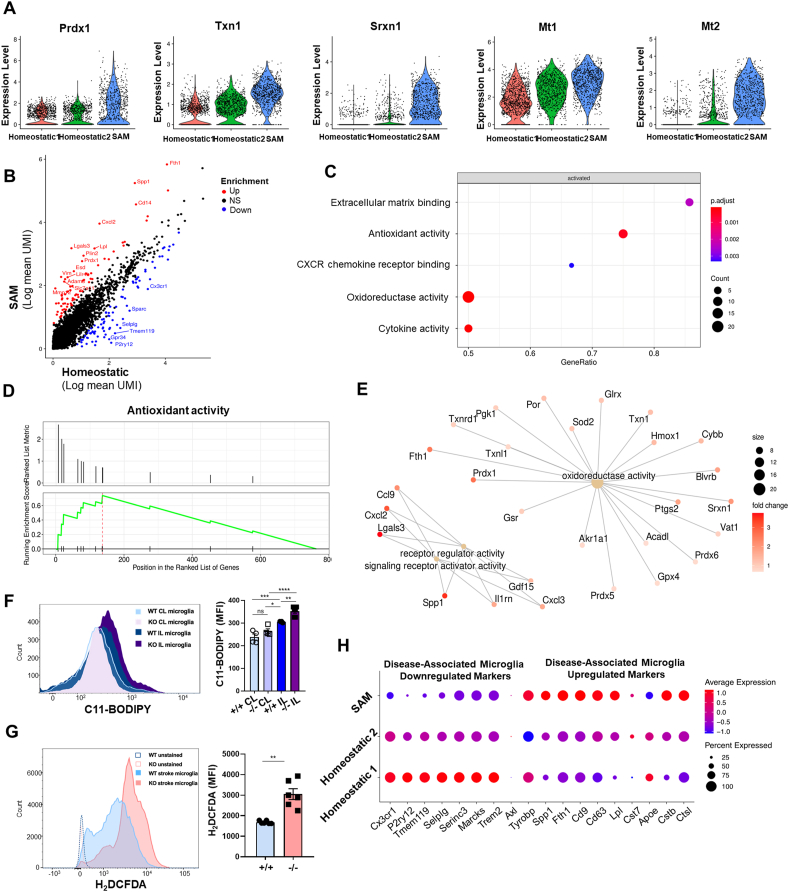
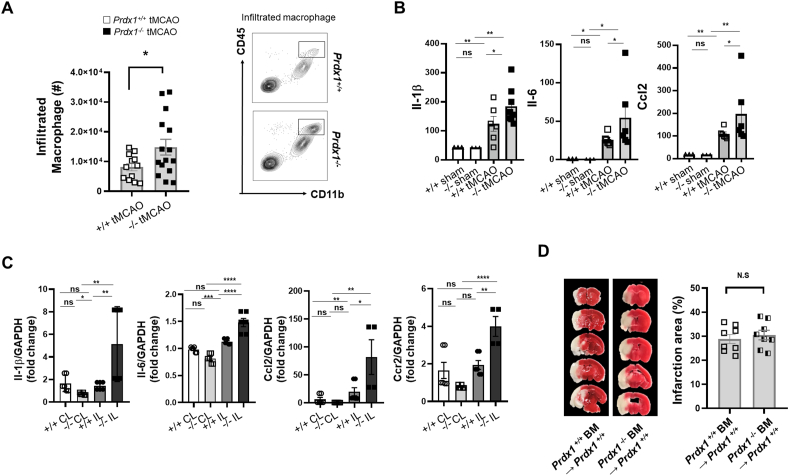
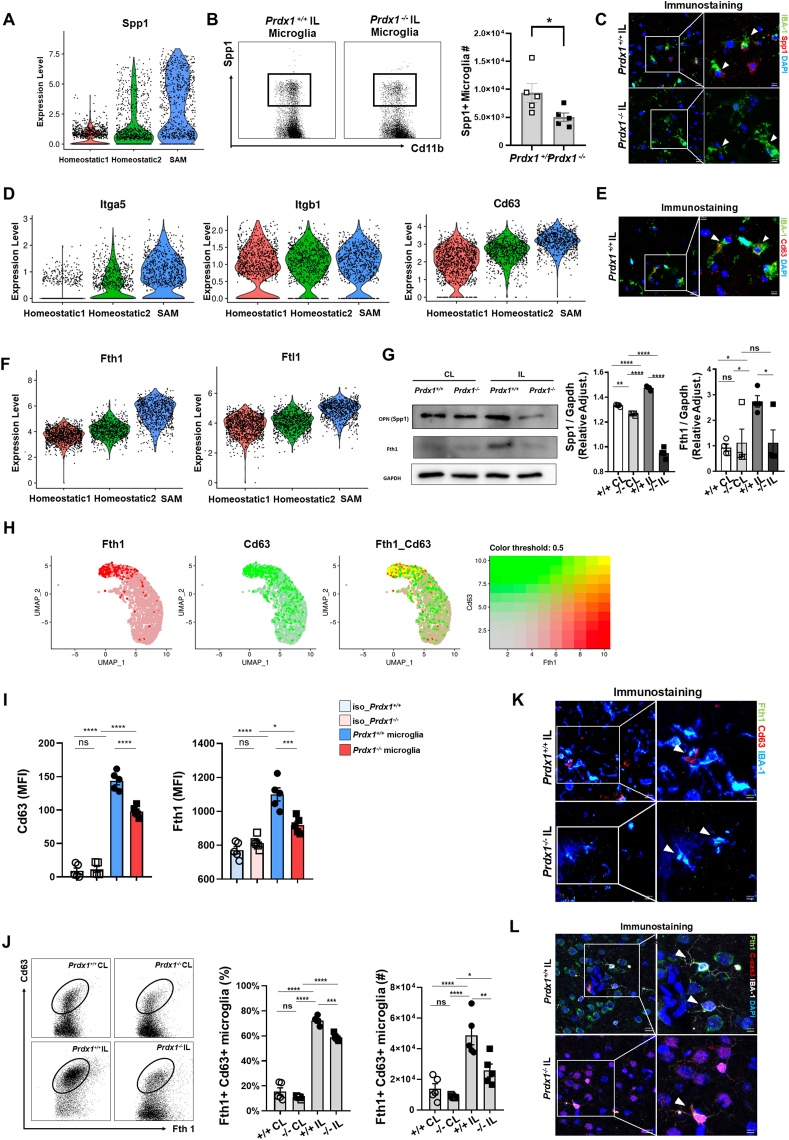
Ischemic stroke is the leading cause of immortal disability and death worldwide. For treatment in the acute phase, it is necessary to control excessive reactive oxygen species (ROS) damage during ischemia/reperfusion (I/R). Microglia are well known to be closely associated with excessive ROS response in the early stage of I/R. However, the precise roles of microglia associated with mitigating ROS damage, and molecular markers of heterogenetic microglia in the I/R damaged brain has not been clarified. Here, we identified a new type of microglia associated with stroke in the I/R injured brain. Single-cell RNA sequencing (scRNA-seq) was used to assess transcriptional changes of microglia and immune cells in the contralateral (CL) and ipsilateral (IL) hemispheres after transient middle cerebral artery occlusion (tMCAO) surgery to mimic ischemic stroke. We classified a unique type of microglia with enhanced antioxidant function and markers similar to those of disease-associated microglia (DAM), designated them as stroke-associated microglia (SAM). The representative antioxidant enzyme, Peroxiredoxin-1 (Prdx1), was predominantly expressed in SAM and mediated ROS defense genes, including Txn1, Srx1, Mt1, and Mt2. In the Prdx1-/- I/R damaged brain, we observed significantly increased infarction, as assessed by TTC staining, and FACS analysis detected severe microglial cell death. Importantly, scRNA transcriptomics data showed that the SAM population was specifically decreased in Prdx1-/- mice and that these mice exhibited decreased ROS damage resistance. Inflammatory responses which were detected by ELISA and qPCR, were also increased in Prdx1-/- IL hemispheres. Finally, Prdx1-dependent antioxidative SAM were found to be essential for increasing the transcription levels of stroke-protective molecules, such as osteopontin and ferritin. A novel microglia type (SAM) is specifically activated in response to stroke I/R injury, and that Prdx1 expression is required for the activation and enhanced antioxidant function of SAM.

Keywords: Ischemic stroke; Peroxiredoxin-1 (Prdx1); Reactive oxygen species (ROS); Single cell RNA sequencing; Stroke-associated microglia (SAM).


Figures

Image 1
Graphical abstract
Fig. 1
Fig. 1
scRNA-seq reveals heterogeneity of immune cells in the stroke brain. (A) Experimental design for scRNA-seq (n = 3 per group). Cells in each group were pooled up to 9000 target cells per hemisphere. (B) UMAP plots showing clusters and annotations of cells identified in stroke brains obtained at 24 h and 48 h after tMCAO. (C) Heatmap showing the relative expression levels of the top marker genes in the six cell types identified by scRNA-seq. (D) UMAP plots showing representative markers for each cell cluster in the ischemic brain. (E) UMAP plot showing clusters of each hemisphere cell population at 24 h and 48 h after tMCAO. (F) Stacked bar graphs showing the proportion of cells identified in each cluster out of the total number of cells at 24 h and 48 h after tMCAO. (G) Bar graphs showing total cell numbers identified in clusters of each hemisphere at 24 h and 48 h after tMCAO.
Fig. 2
Fig. 2
Stroke-associated microglia (SAM) exhibit enhanced antioxidant properties. (A) Subclustering analysis of microglia in the stroke brain. Microglia (10,559 cells) were extracted from CL and IL hemispheres at 24 h and 48 h after tMCAO. (B) UMAP plots showing two microglia clusters from CL (left) and IL (right) hemispheres at 24 h after tMCAO. (C) Stacked bar graph showing numbers of microglia counted from IL and CL hemispheres at 24 h after tMCAO. (D) Projection of microglia on a pseudo-time graph plot displaying the transition from homeostatic microglia (blue) to SAM (yellow). (E) Scatterplot showing scRNA-seq analysis of differentially expressed genes. Red and blue dots indicate genes that were significantly increased and decreased, respectively, in SAM (log2FC>±1.5). (F) Gene ontology analysis of genes found to be differentially expressed in SAM. (G) Violin plots showing the expression of the SAM marker genes, Prdx1, Srxn1, Txn1, Spp1, Mt1, and Mt2 in microglial subclusters. (H) Prdx1-mediated antioxidant pathways against ROS stress. (I) Expression of DAM marker genes in SAM and homeostatic microglia. Red and blue lines respectively indicate up- and down-regulated marker genes of DAM. Increased or decreased gene expression in SAM versus homeostatic microglia is indicated by red or blue dots, respectively. . (For interpretation of the references to colour in this figure legend, the reader is referred to the Web version of this article.)
Fig. 3
Fig. 3
Peroxiredoxin1 (Prdx1) deficiency exacerbates brain damage after stroke onset. (A) Representative images of TTC stained brain slices of Prdx1+/+ (n = 18) and Prdx1−/− (n = 22) mice. Bar graph showed quantification of infarct volume. (B) Neurologic scores (see Methods) for Prdx1+/+ (n = 11) and Prdx1−/− (n = 17) mice (left panel). Motor test scores (sec) for Prdx1+/+ (n = 11) and Prdx1−/− (n = 17) mice. (C) Kaplan-Meier Survival rates (Gehan-Breslow-Wilcoxon test) of Prdx1+/+ (n = 13) and Prdx1−/− (n = 13) mice at 24 h, 48 h, and 72 h after reperfusion. (D) TUNEL assay (left panel) and crystal violet staining (right panel) of ischemic brain at 12 h and 24 h after ischemic stroke (Prdx1+/+: n = 7, Prdx1−/−: n = 5). (E) Bar graphs displaying the percentage of TUNEL-positive cells in Prdx1+/+ and Prdx1−/− mouse brains. (F) FACS analysis showing the proportion of microglia in the whole live cells of IL hemispheres of Prdx1+/+ (n = 13) and Prdx1−/− (n = 14) mice. (G) FACS analysis showing Annexin V/PI staining in Prdx1+/+ (n = 5) and Prdx1−/− (n = 5) ipsilateral microglia population. The bar graph showing the ration of apoptosis among in Prdx1+/+ and Prdx1−/− microglia. (H) Representative immunofluorescence images (X400) of c-caspase3 staining in the infarction regions of Prdx1+/+ and Prdx1−/− mice. (A), (B), (E), (F), (G) and (H) mice were used at 24 h after ischemia. Data were presented mean SEM analyzed by unpaired two-tailed Student t-test *P<0.05, **P<0.01, ***P<0.001. (For interpretation of the references to colour in this figure legend, the reader is referred to the Web version of this article.)
Fig. 4
Fig. 4
Prdx1 is essential for SAM activation after stroke damage. (A) UMAP plots showing clusters and annotations of cells identified in Prdx1+/+ and Prdx1−/− IL hemispheres after tMCAO. (39,956 cells) (B) UMAP plots showing immune cells clusters in Prdx1+/+ (WT IL) or Prdx1−/− (KO IL) IL hemispheres at 24 h after tMCAO (left panel). Bar plot showing the relative distribution of each cluster identified in the Prdx1+/+ (WT) and Prdx1−/− IL (KO) hemispheres at 24 h after tMCAO (right panel). (C) Subclustering analysis of the microglia identified in (A). (D) UMAP plots of microglial subclusters in the Prdx1+/+ (WT IL) and Prdx1−/− IL (KO IL) hemispheres (left panel). Stacked bar graph showing the number of microglia counted from the Prdx1+/+ (WT) and Prdx1−/− IL (KO) hemispheres at 24 h after tMCAO (left panel). (E) Projection of microglia on a pseudo-time graph plot displaying the transition from homeostatic microglia (clusters 1 and 2, blue) to SAM (cluster 3, yellow). (For interpretation of the references to colour in this figure legend, the reader is referred to the Web version of this article.)
Fig. 5
Fig. 5
SAM exhibit enhanced antioxidative activity along with several DAM markers. (A) Violin plots showing gene expression levels of the indicated genes in homeostatic clusters 1 and 2 and SAM. (B) Scatterplot showing scRNA-seq analysis of differentially expressed genes. Red and blue dots indicate genes that were significantly increased and decreased in SAM, respectively (log2FC>±1.5). (C) Dot plots indicating activated pathways of SAM in the IL hemisphere. (D) GSEA pathway analysis of differentially expressed genes in SAM. (E) KEGG pathway analysis showing enriched pathways in SAM. (F, G) FACS analysis showing BODIPY 581/591 MFI (Mean Fluorescence Intensity) of Prdx1+/+ IL and Prdx1−/− IL microglia (F) and H2DCFDA of Prdx1+/+ IL and Prdx1−/− IL microglia staining (G) after 24 h in stroke microglia. Data are presented as mean ± SEM and were analyzed by the 2-way ANOVA test and unpaired two-tailed Student’s t-test, *P<0.05, **P<0.01, ***P<0.001. (H) Expression of DAM marker genes in SAM and homeostatic microglia obtained from the Prdx1+/+ and Prdx1−/− IL hemispheres at 24 h after tMCAO. Red or blue lines respectively indicate up-regulated or down-regulated marker genes of DAM. Increased or decreased gene expression in SAM versus homeostatic microglia is indicated by red or blue dots, respectively. . (For interpretation of the references to colour in this figure legend, the reader is referred to the Web version of this article.)
Fig. 6
Fig. 6
Prdx1 expression of resident microglia is required for protecting the brain against acute stroke damage. (A) FACS analysis of CD45hi, CD11b + infiltrated macrophages in the Prdx1+/+ (n = 12) and Prdx1−/− (n = 15) IL hemispheres. (B) ELISA (n > 5 per group) and (C) real-time PCR (n = 3 per group) analyses of inflammatory cytokines and chemokines, including Il-1, Il6, Ccl2, and Ccr2. Data were presented mean SEM and analyzed by 2-way ANOVA test. (D) Representative images of TTC stained brain slices from bone marrow transplantation (BMT) mice. BM from Prdx1+/+ (n = 8) and Prdx1−/− (n = 8) mice were transplanted into WT recipients. Bar graph showed quantification of infarct area for BM from Prdx1+/+ and Prdx1−/−. All of mice were used at 24 h after tMCAO. Data were presented mean SEM and analyzed by unpaired two-tailed Student t-test, *P<0.05, **P<0.01, ***P<0.001.
Fig. 7
Fig. 7
SAM are potential protective microglia associated with ischemic stroke. (A) Violin plots showing the expression of Spp1 in homeostatic clusters 1 and 2 and SAM. (B) FACS analysis of Spp1 positive microglia population in the IL hemisphere of Prdx1+/+ (n = 5) and Prdx1−/− (n = 5) mice after tMCAO. (C) Representative IHC images for Spp1 positive SAM population in the ipsilateral hemisphere of Prdx1+/+ and Prdx1−/− mice. (D,F) Violin plots showing gene expression levels of the indicated genes in homeostatic clusters 1 and 2 and SAM. (E) Representative IHC images for Cd63 positive SAM population in the ipsilateral hemisphere of Prdx1+/+ mice. (G) Immunoblot analysis of Spp1 and Fth1 in CL and IL hemispheres of Prdx1+/+ and Prdx1−/− mice at 24 h after tMCAO (n = 4). Bar graph showing quantification of blotting images. (H) UMAP plots showing co-expression of Fth1 (red) and Cd63 (green). (I) FACS analysis showing Cd63 and Fth1 expression of Prdx1+/+ IL microglia and Prdx1−/− IL microglia the indicated conditions. Data are presented as Mean Fluorescence Intensity (MFI). (J) FACS analysis of Fth1, Cd63 double positive SAM population proportion and numbers in the IL hemisphere of Prdx1+/+ (n = 5) and Prdx1−/− (n = 5) mice. (K) Representative IHC images for Cd63, Fth1 double positive SAM population in the IL hemisphere of Prdx1+/+ and Prdx1−/− mice. (L) Representative IHC images for Fth1 and c-Caspase3 in infarct regions of Prdx1+/+ and Prdx1−/− microglia (IBA-1). All of mice were used at 24 h after tMCAO. Data were presented mean SEM and analyzed by 2-way ANOVA test or the unpaired two-tailed Student’s t-test, *P<0.05, **P<0.01, ***P<0.001. (For interpretation of the references to colour in this figure legend, the reader is referred to the Web version of this article.)

References

    1. Campbell B.C.V., et al. Ischaemic stroke. Nat. Rev. Dis. Prim. 2019;5(1):70. - PubMed
    1. Allen C.L., Bayraktutan U. Oxidative stress and its role in the pathogenesis of ischaemic stroke. Int. J. Stroke. 2009;4(6):461–470. - PubMed
    1. Rojo A.I., et al. Redox control of microglial function: molecular mechanisms and functional significance. Antioxidants Redox Signal. 2014;21(12):1766–1801. - PMC - PubMed
    1. Mathys H., et al. Single-cell transcriptomic analysis of Alzheimer's disease. Nature. 2019;570(7761):332–337. - PMC - PubMed
    1. Jordao M.J.C., et al. Single-cell profiling identifies myeloid cell subsets with distinct fates during neuroinflammation. Science. 2019;363(6425) - PubMed

LinkOut - more resources