. 2022 Jul 7;185(14):2559-2575.e28.
doi: 10.1016/j.cell.2022.05.013. Epub 2022 Jun 9.

Mapping information-rich genotype-phenotype landscapes with genome-scale Perturb-seq

Affiliations

Mapping information-rich genotype-phenotype landscapes with genome-scale Perturb-seq

Joseph M Replogle et al. Cell. .

Abstract

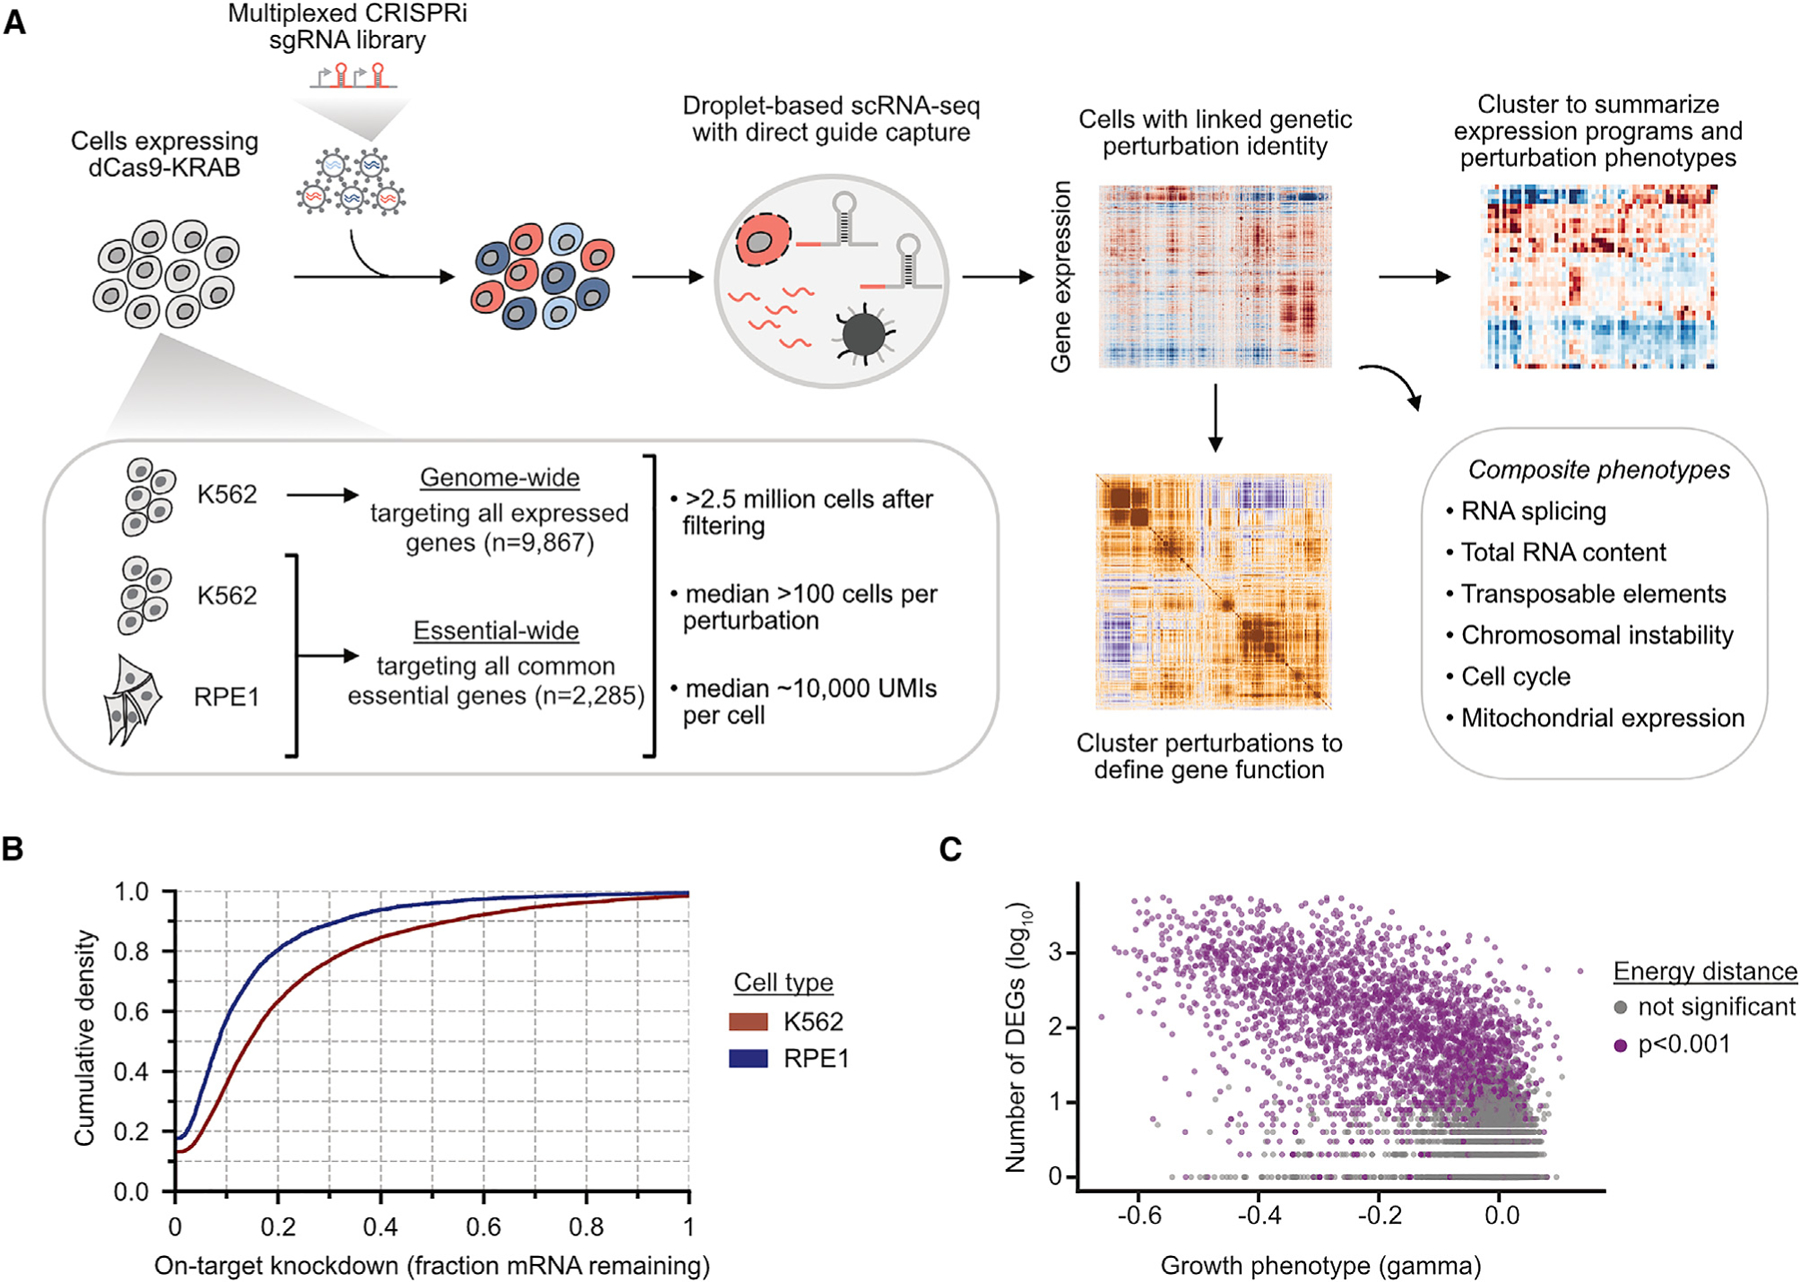
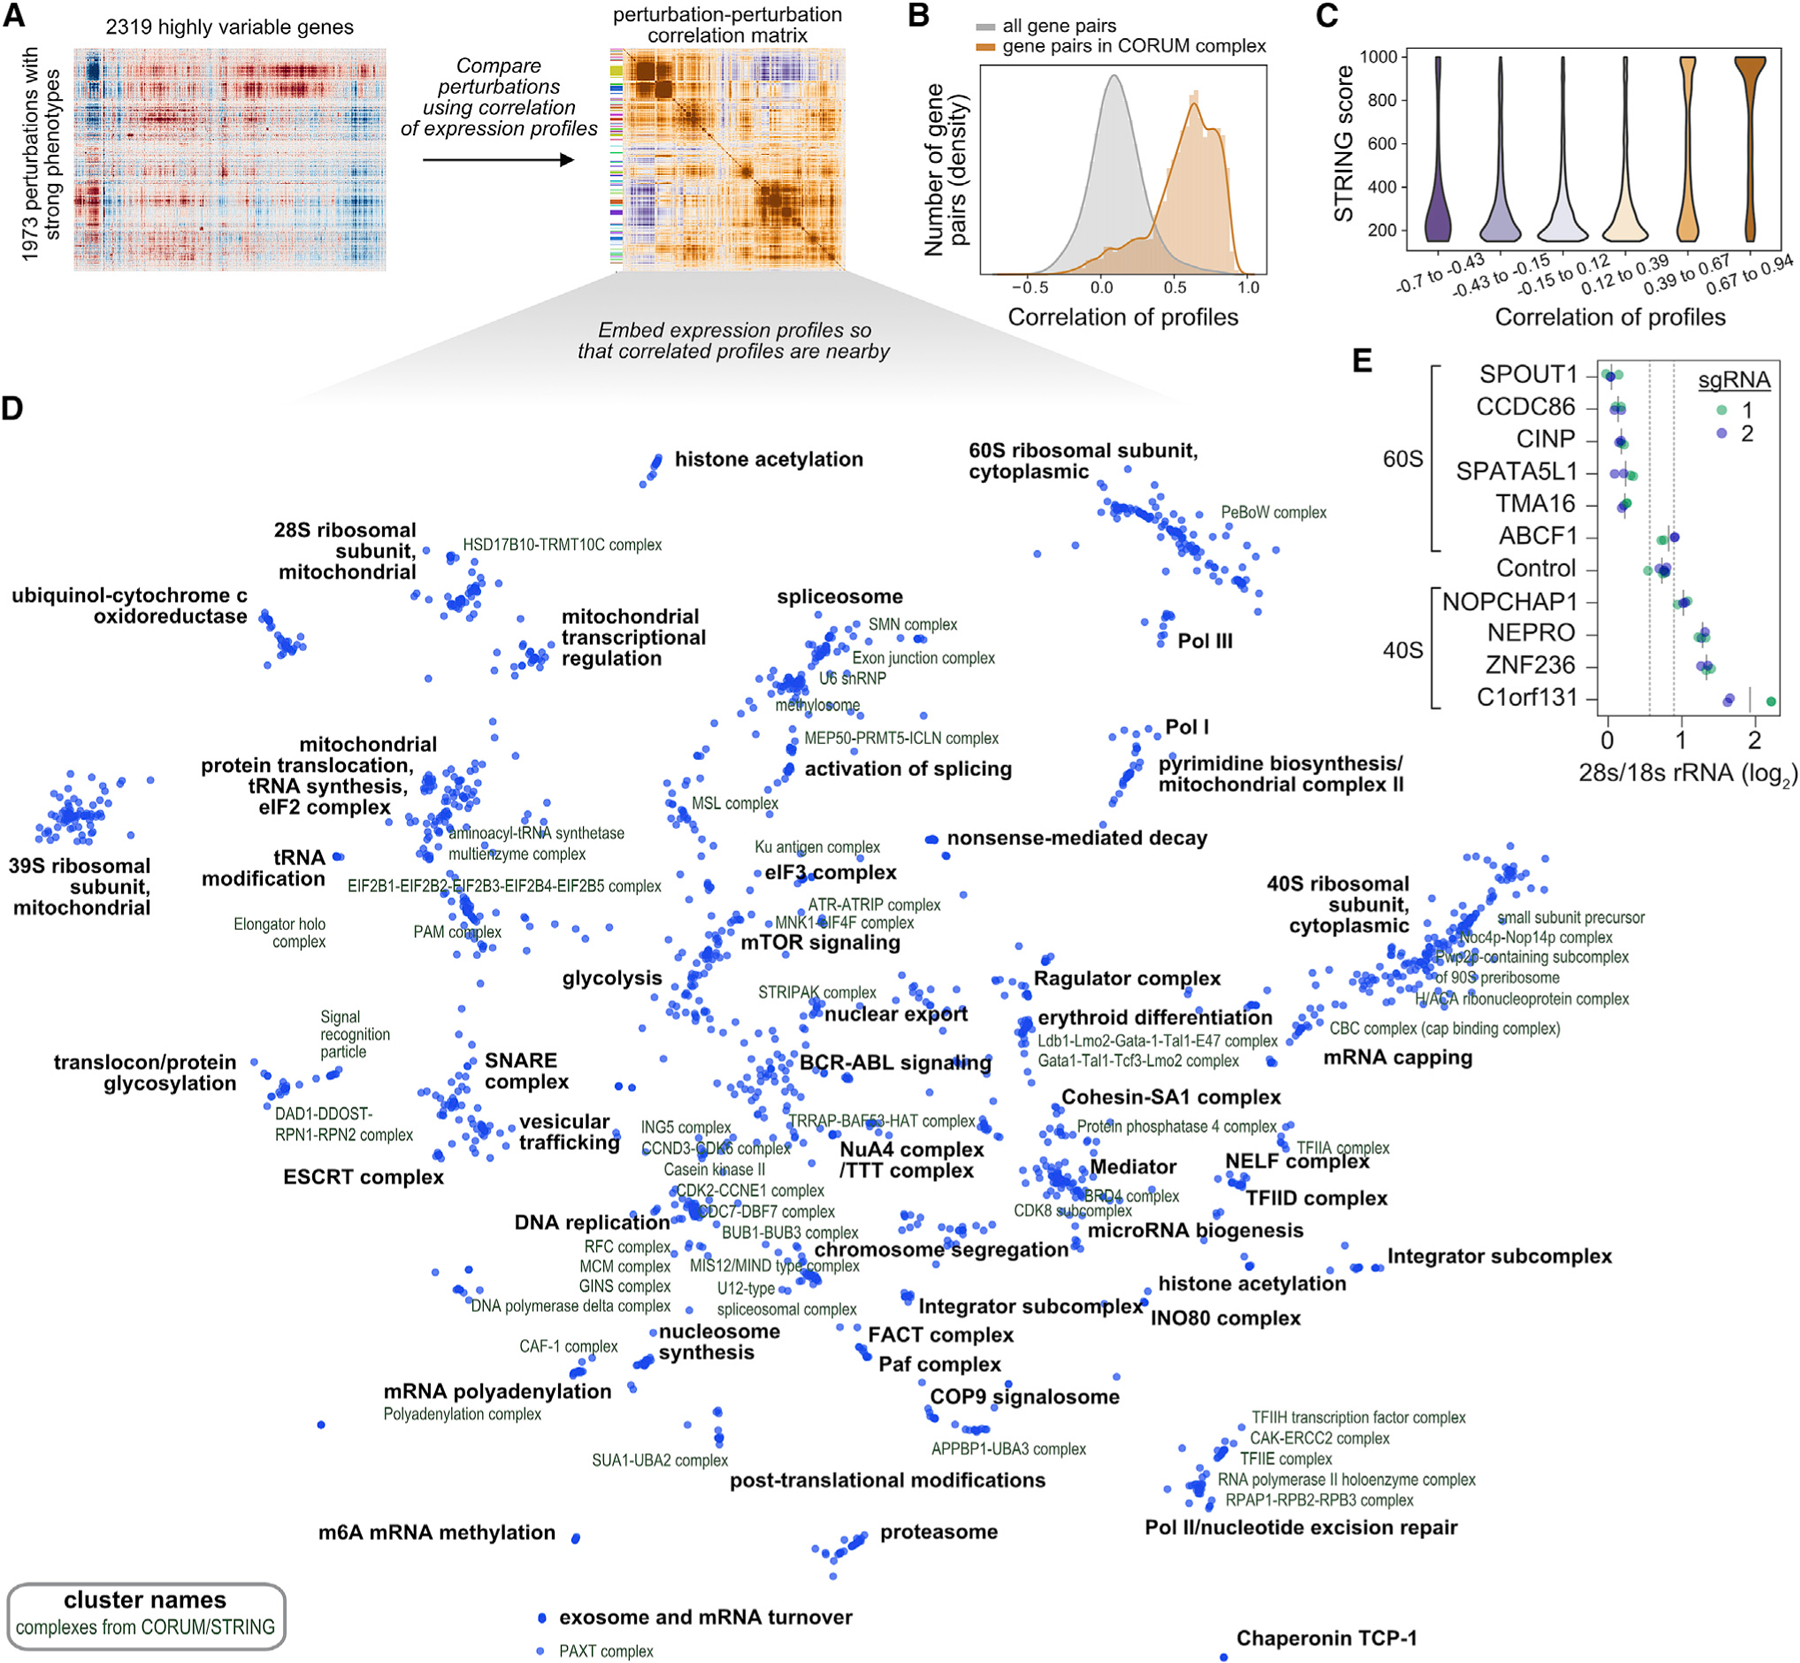
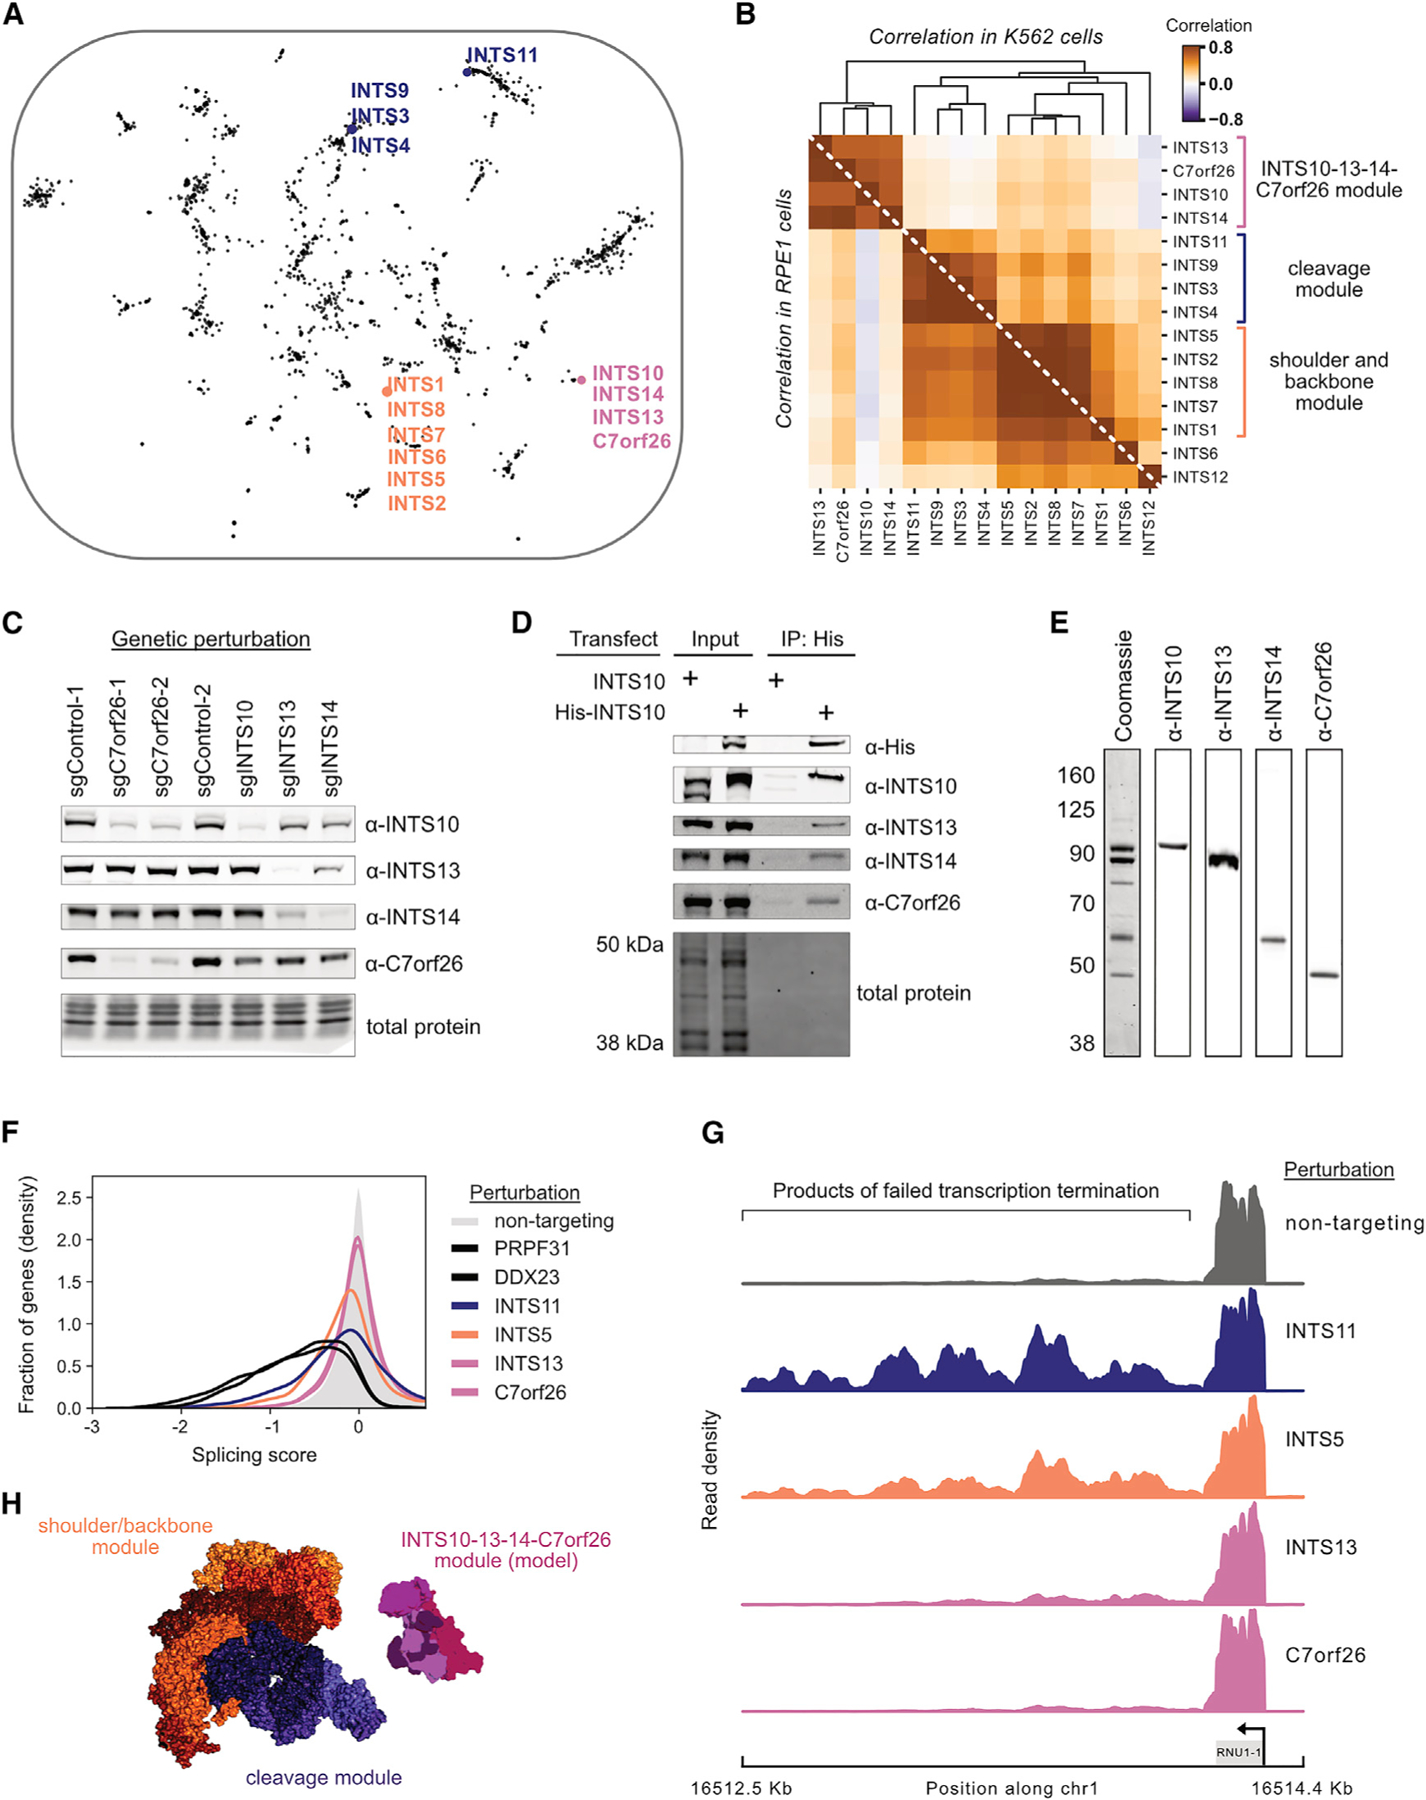
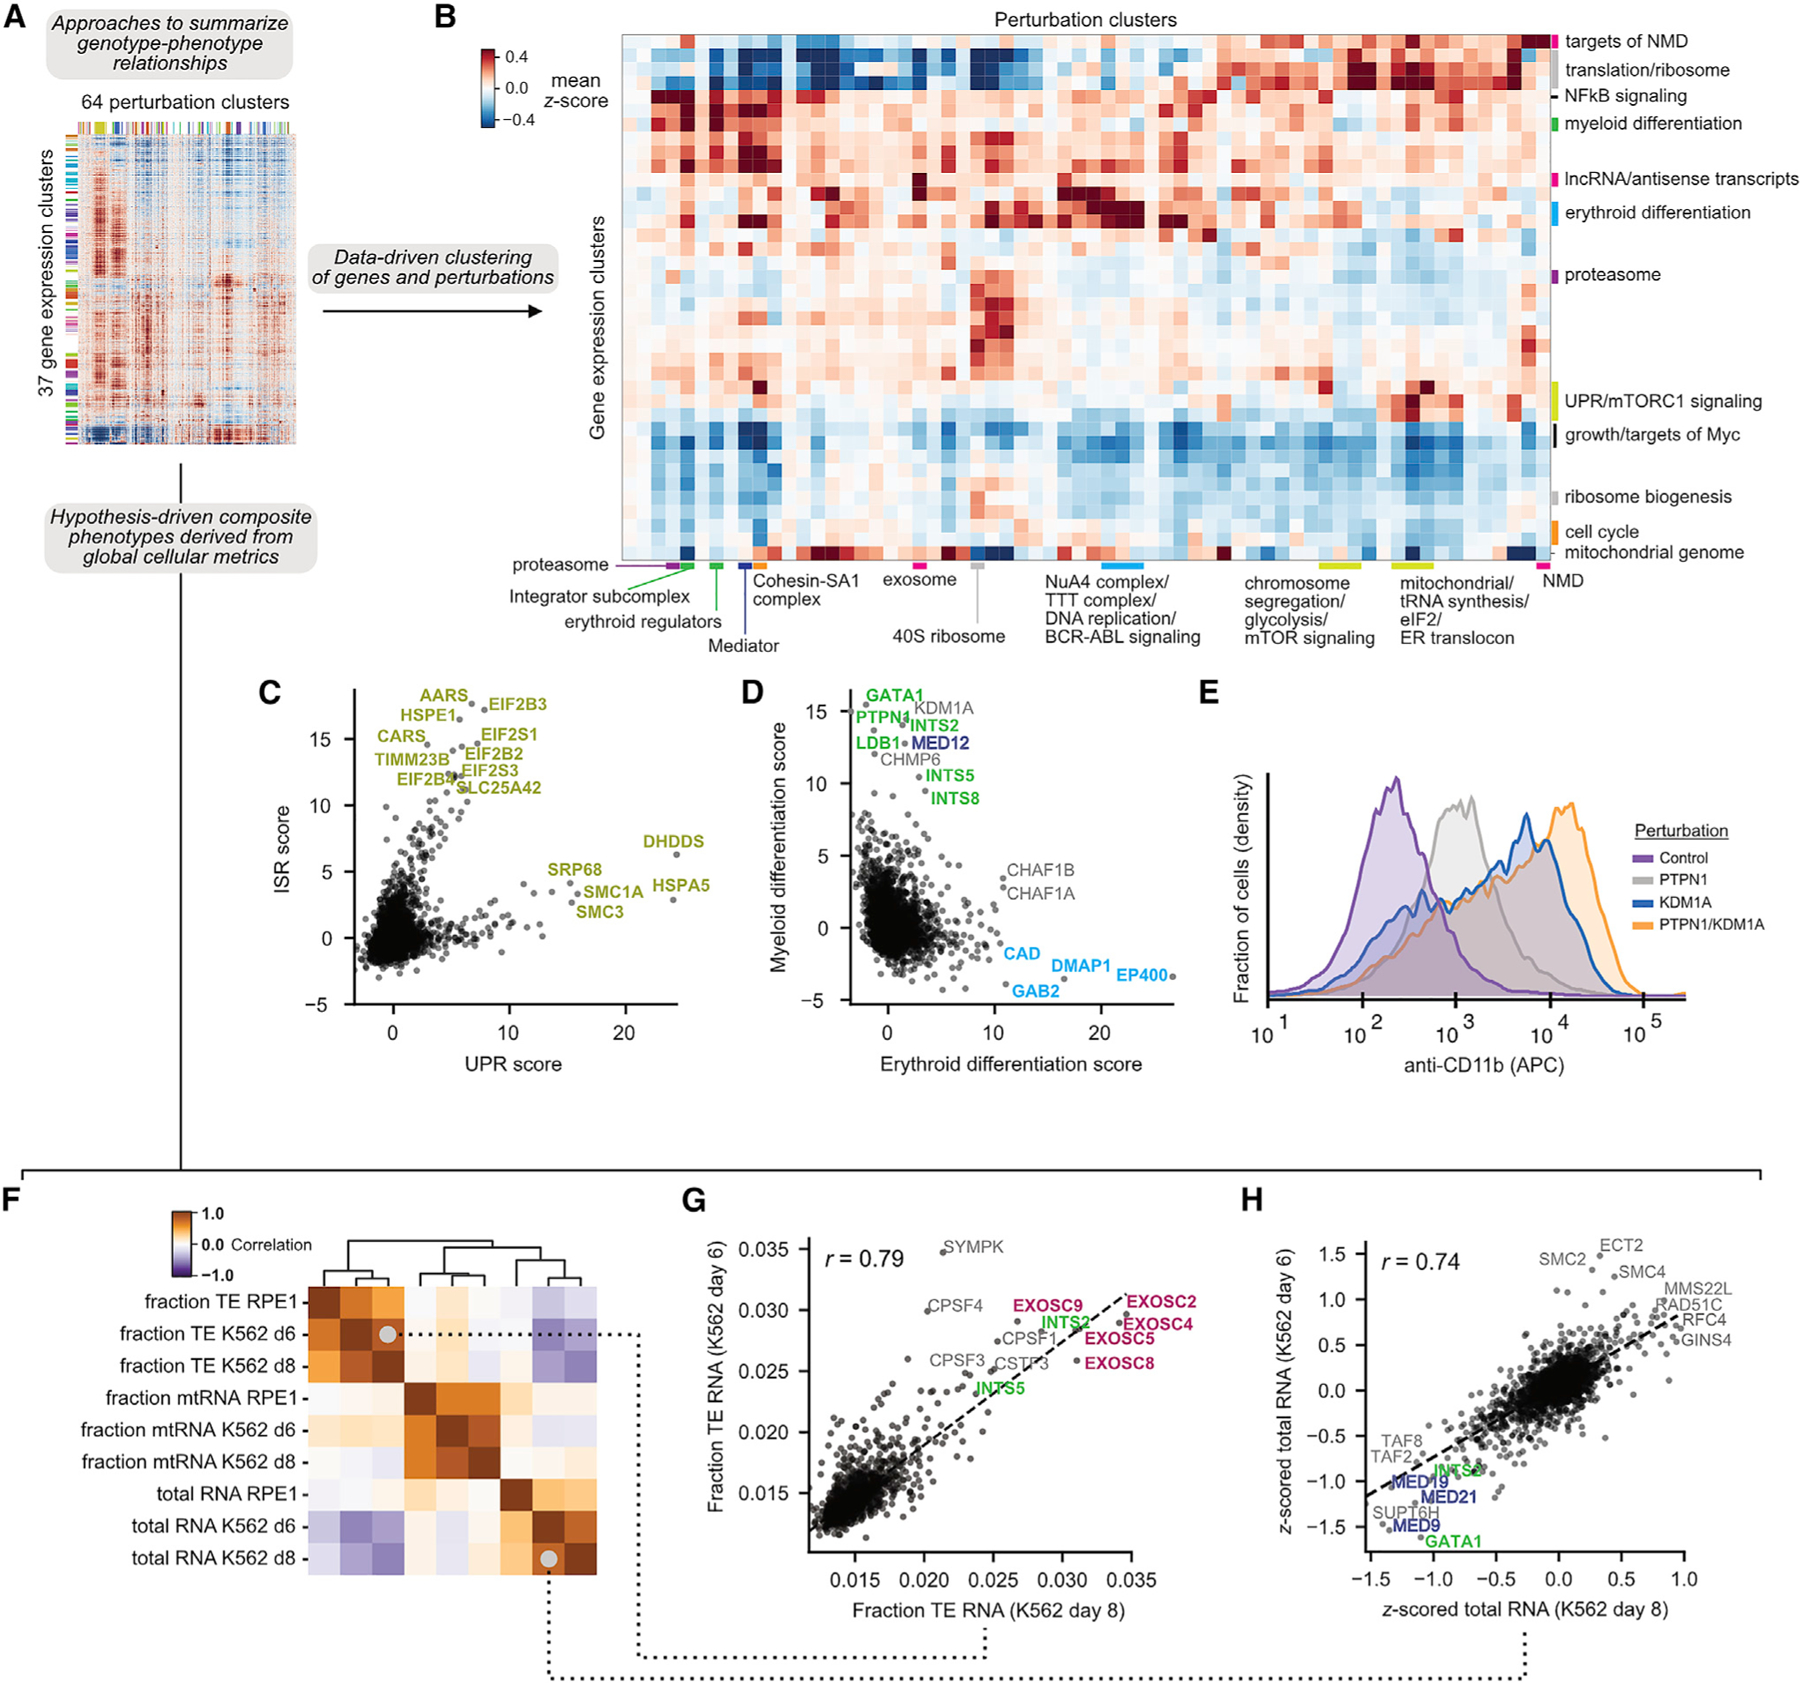
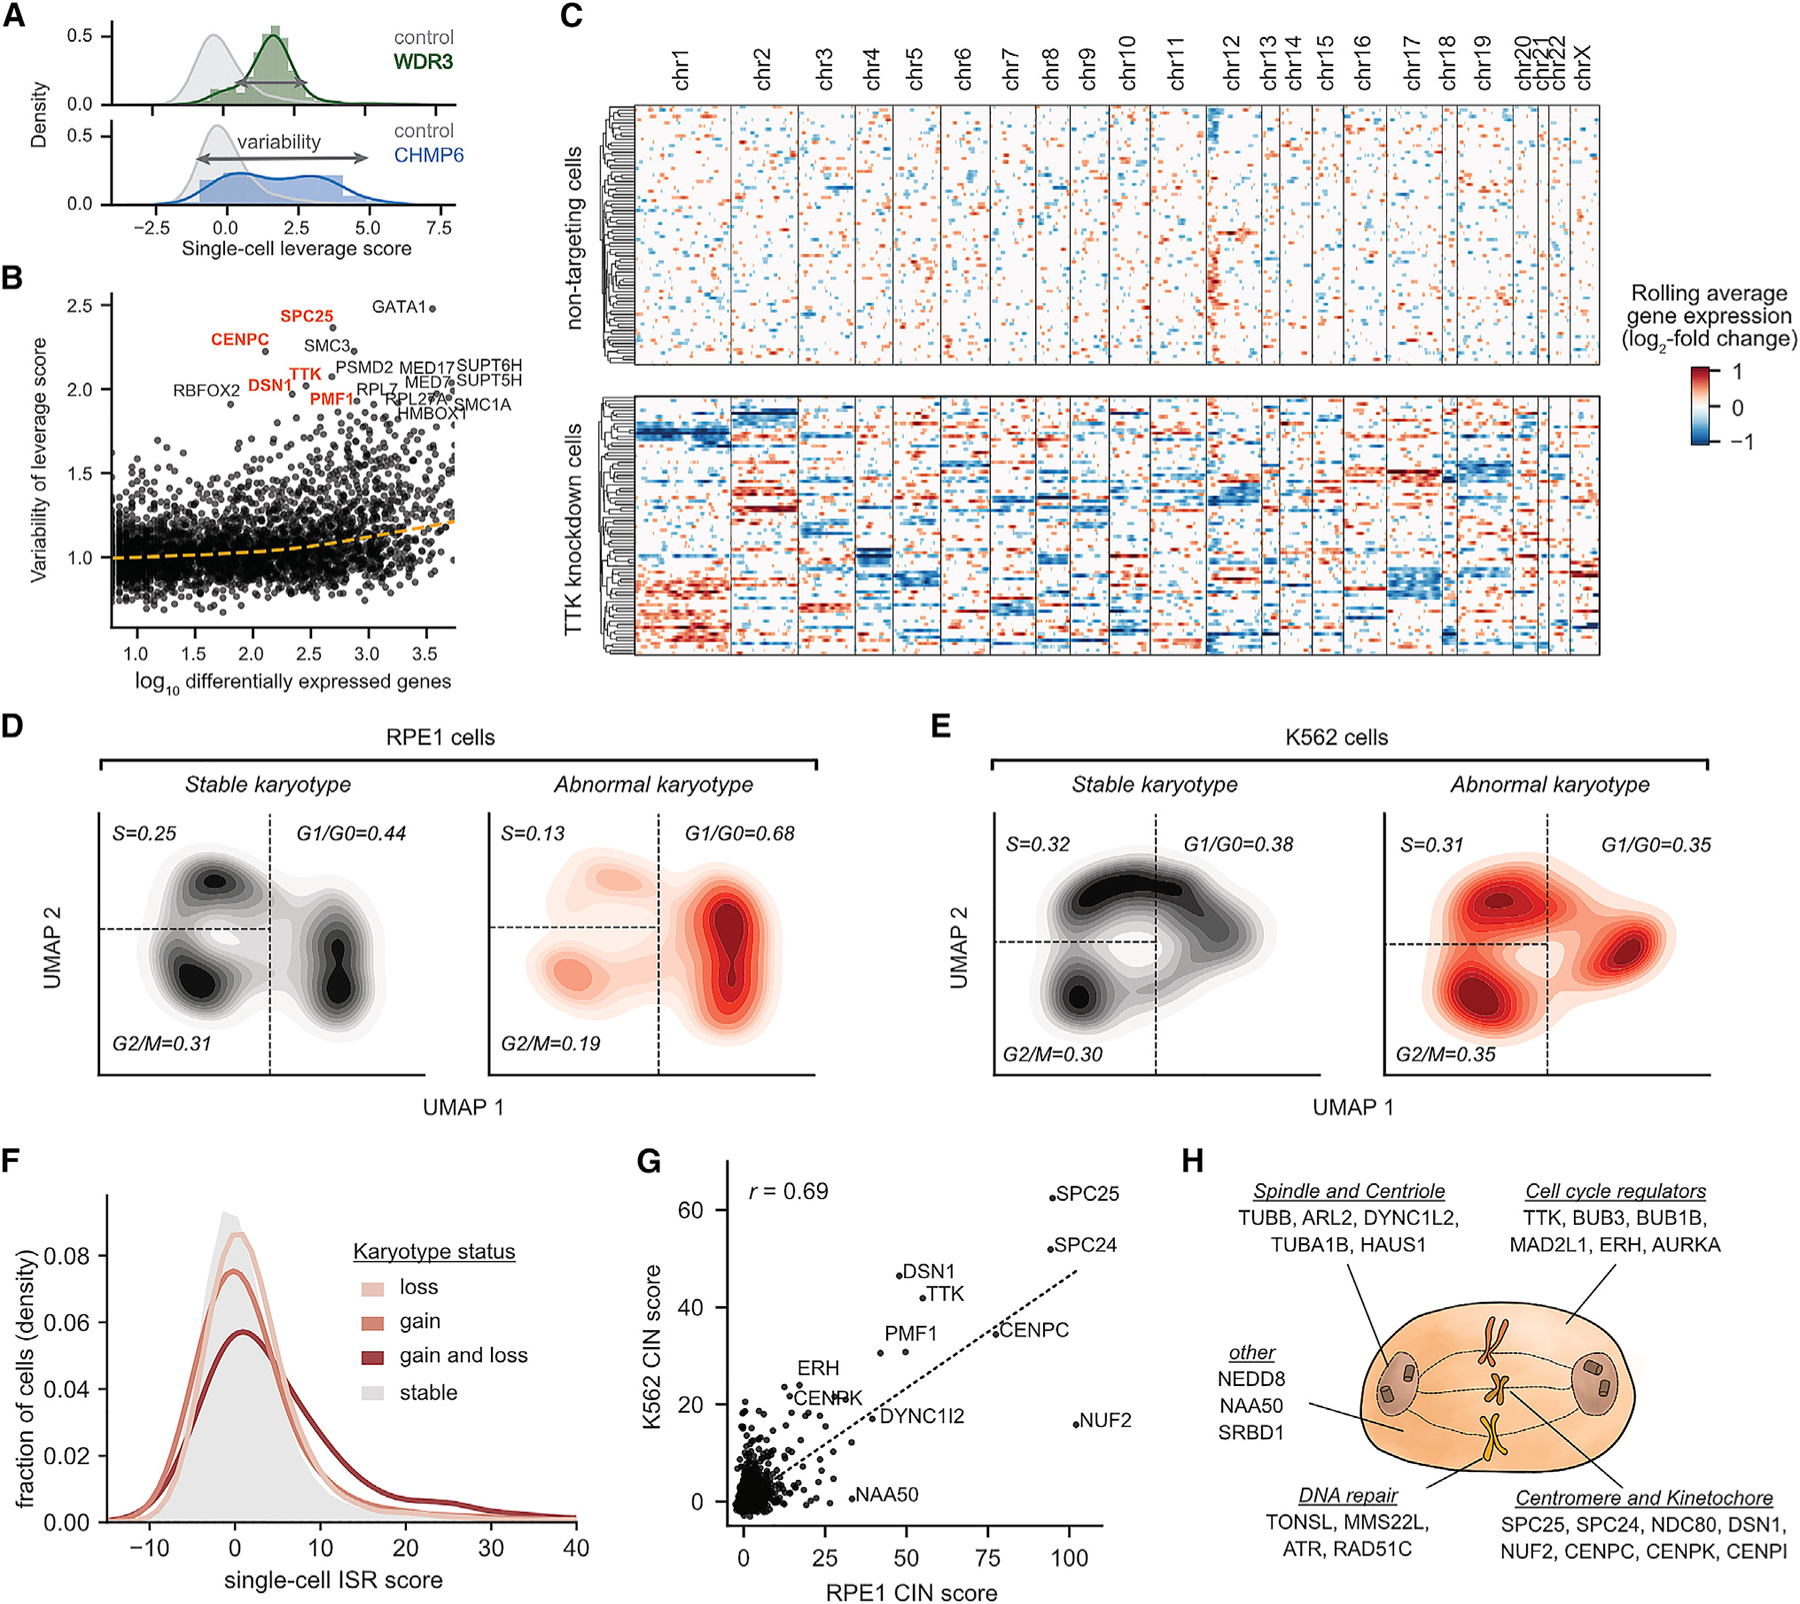
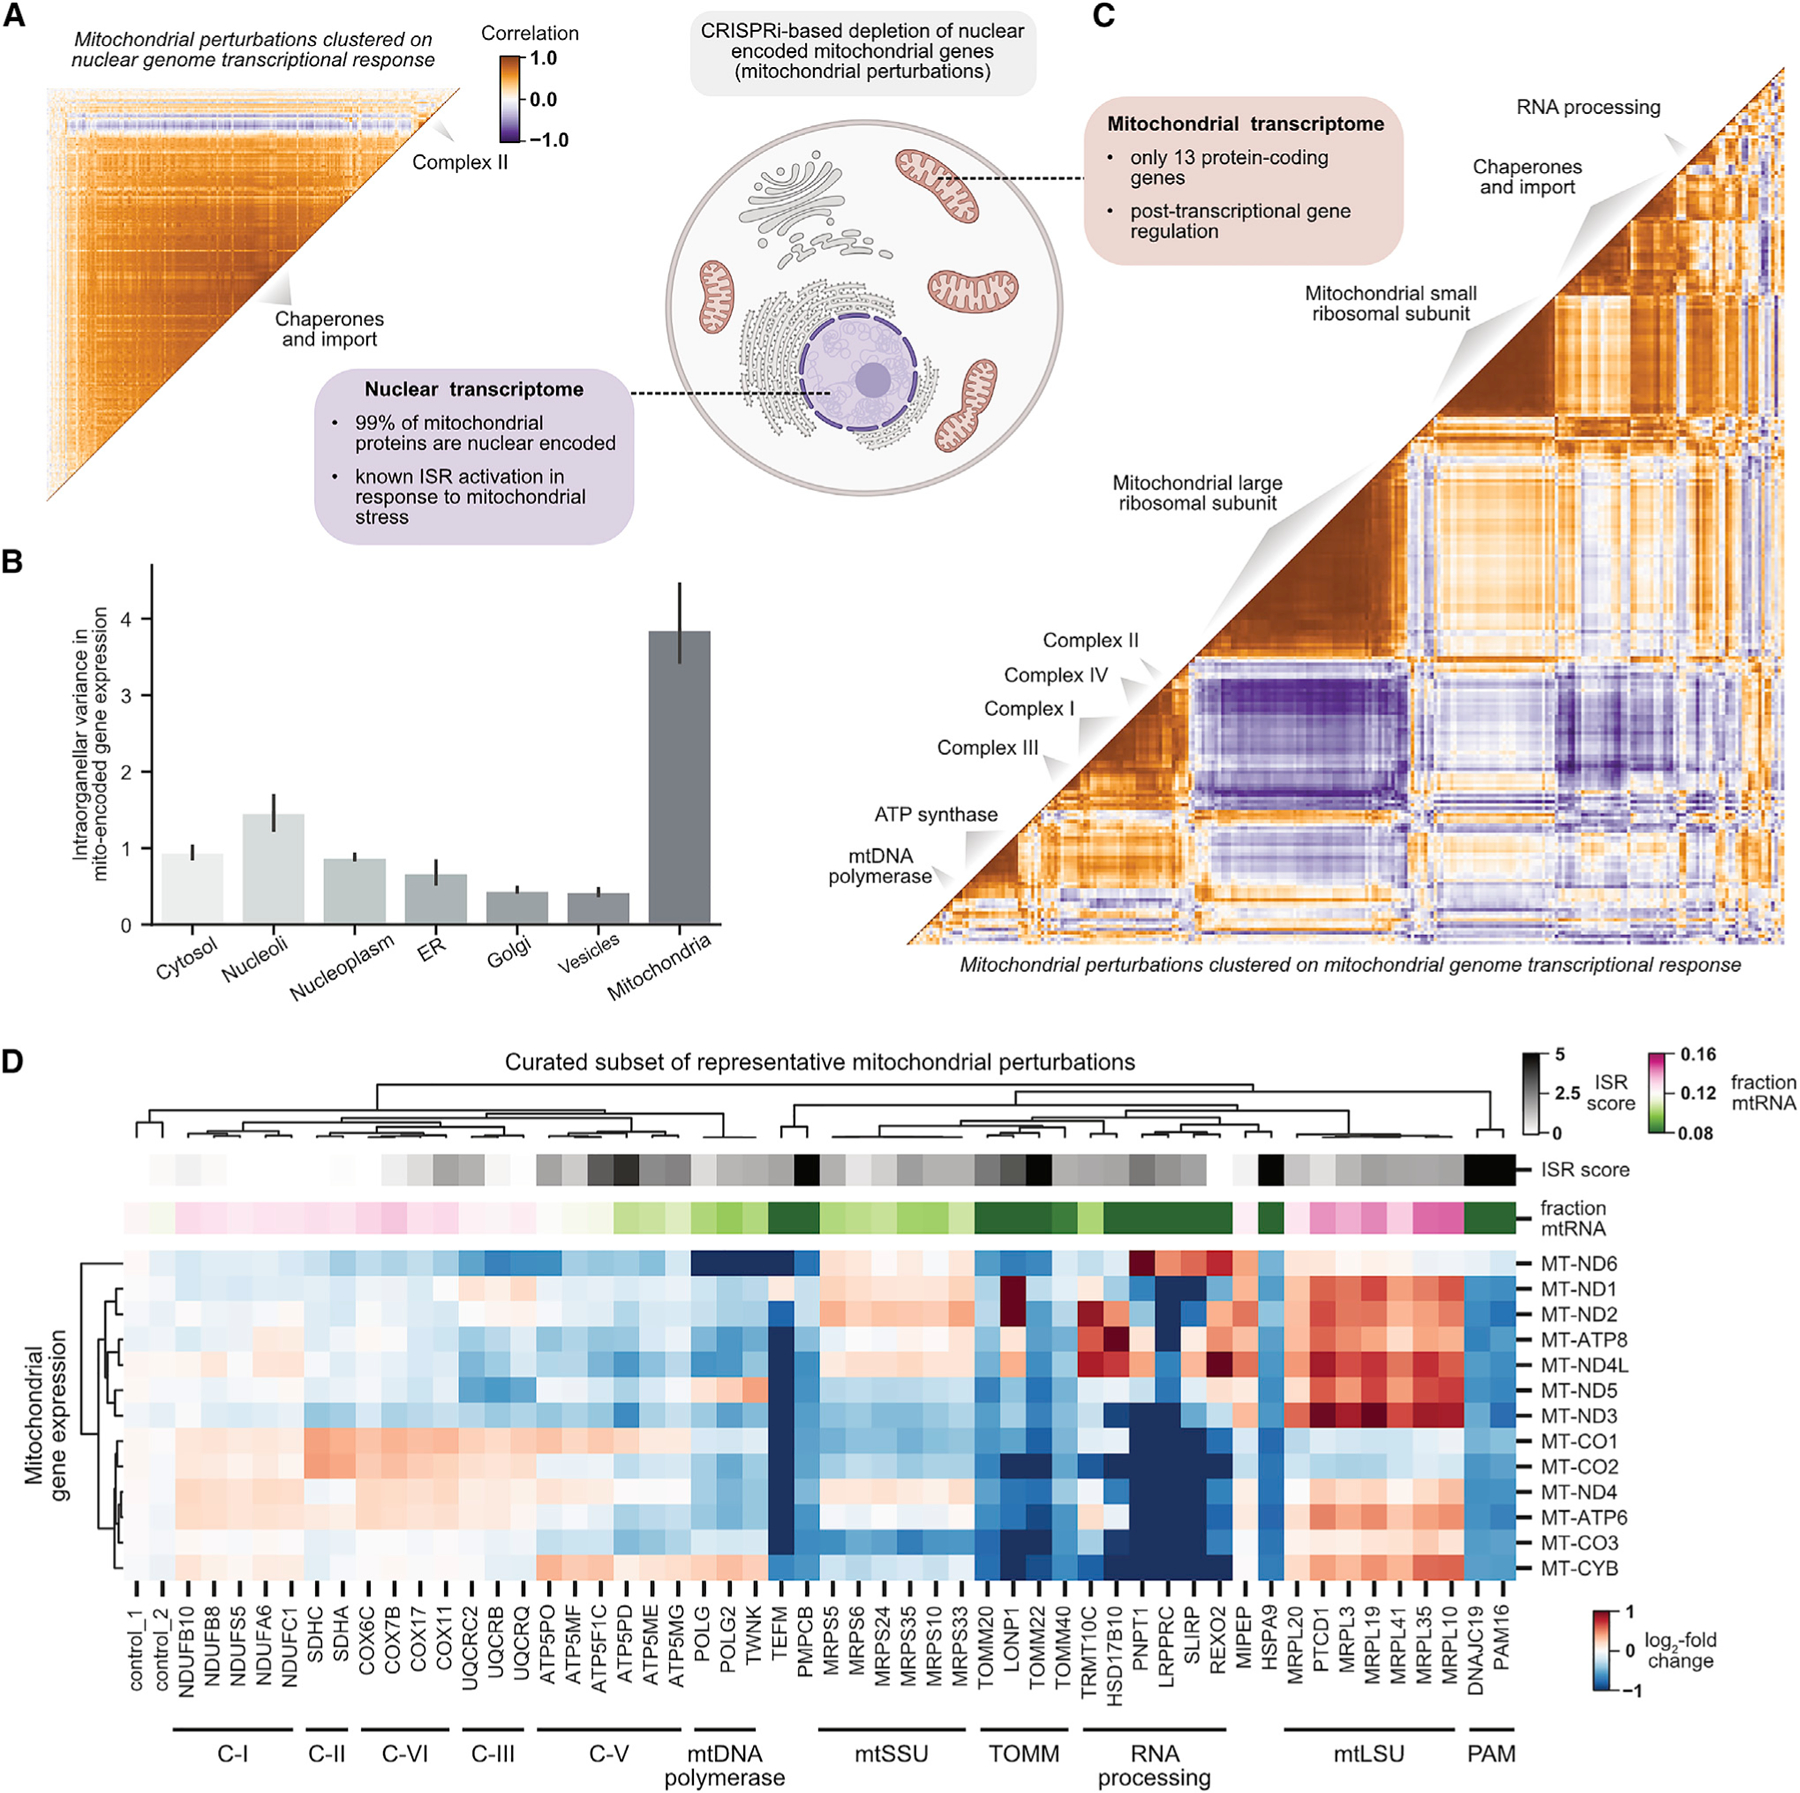
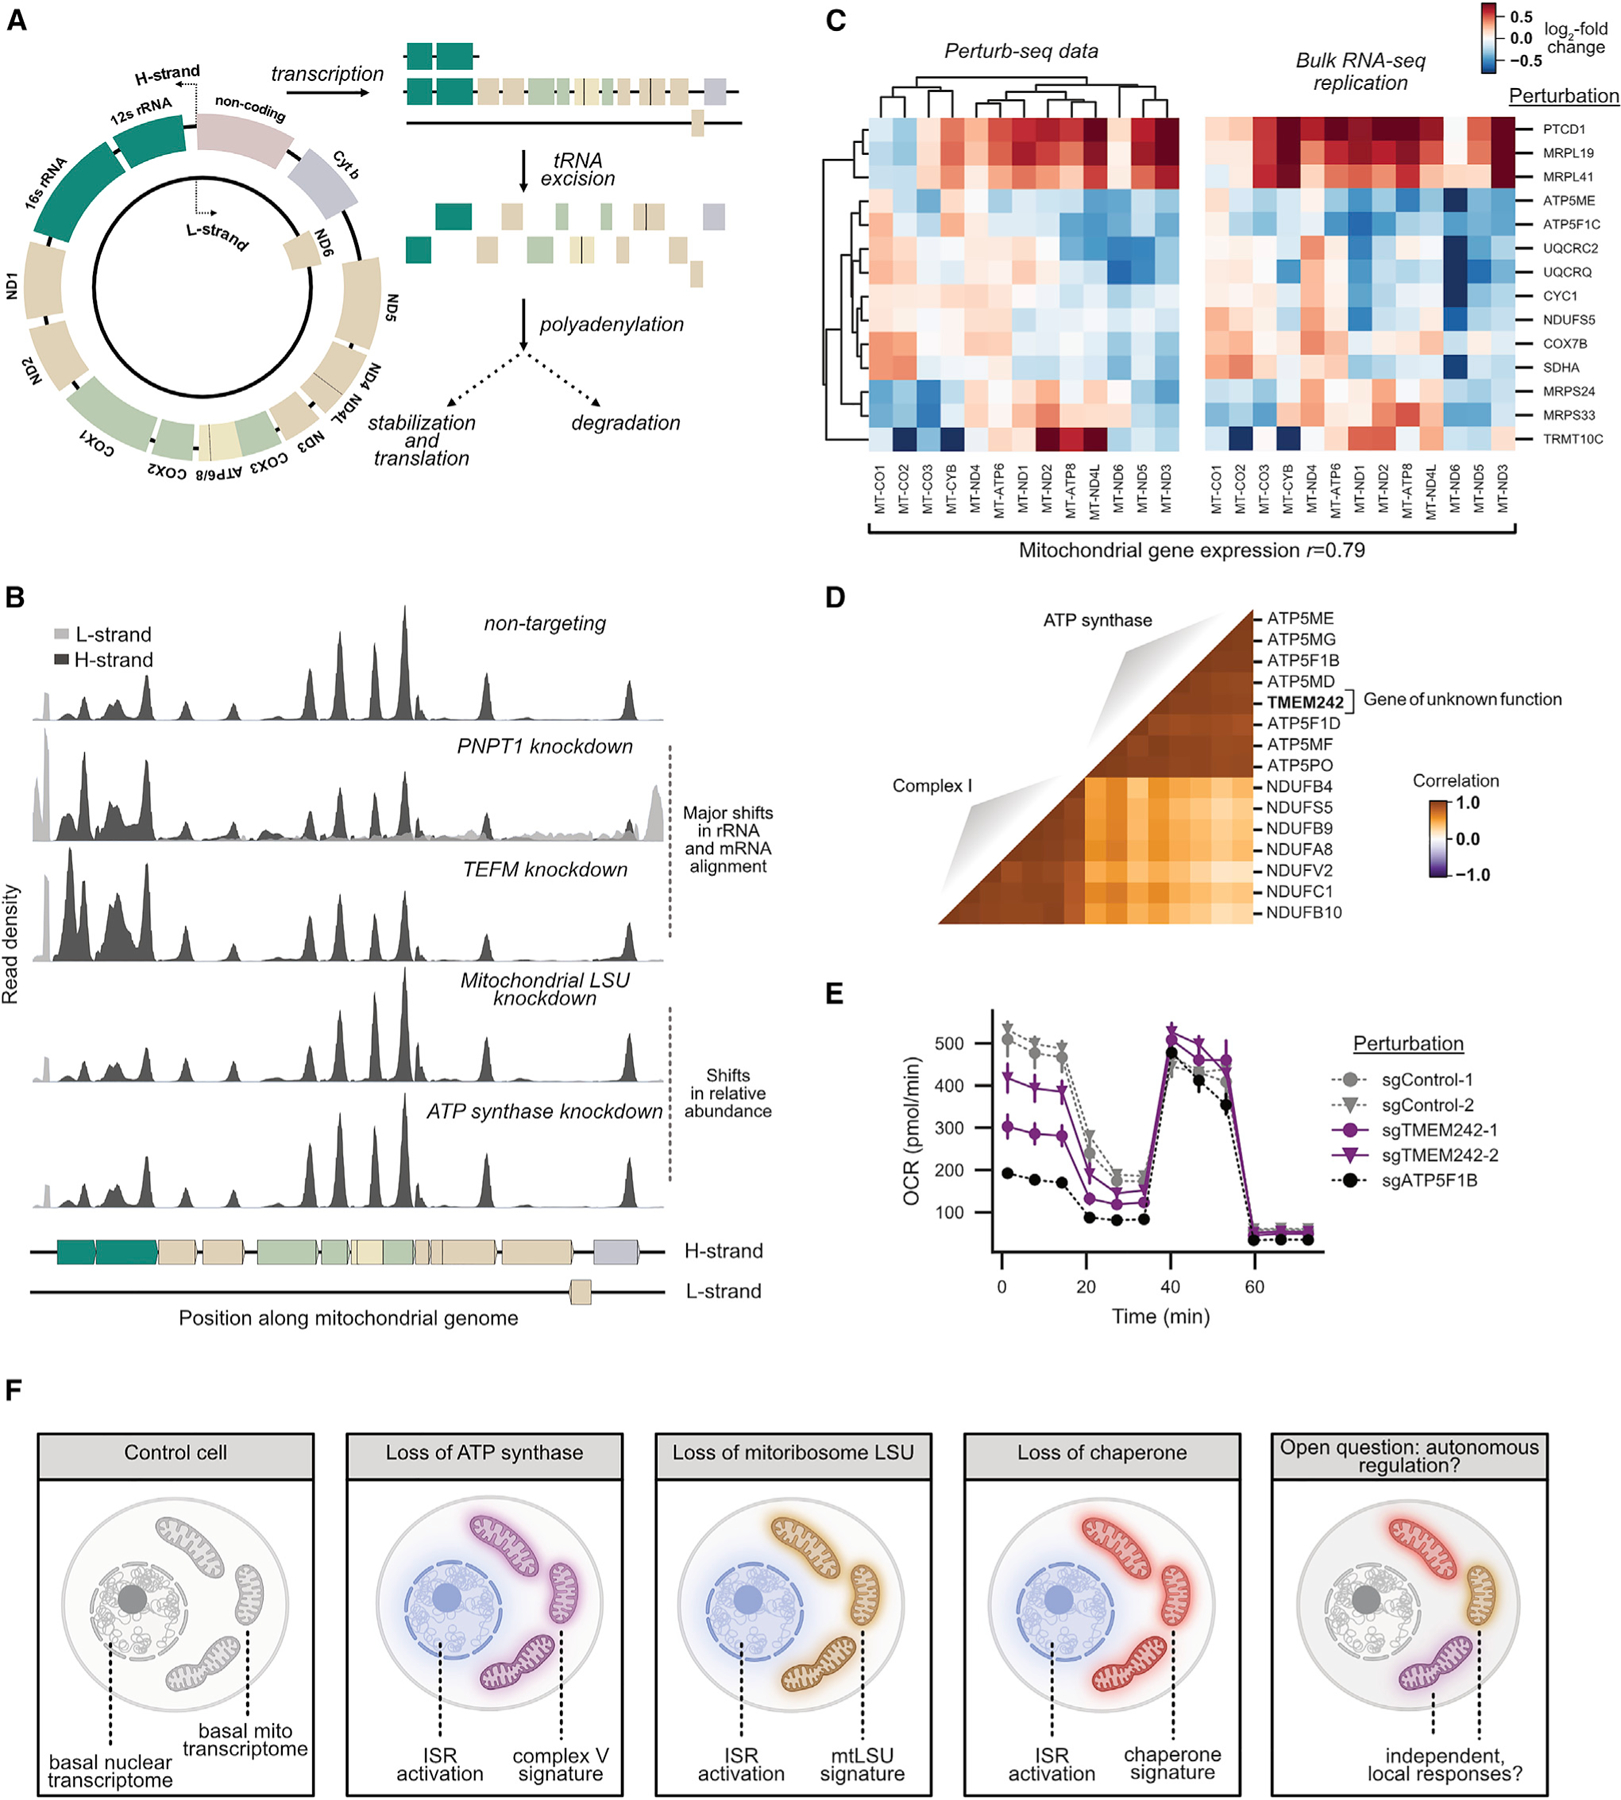
A central goal of genetics is to define the relationships between genotypes and phenotypes. High-content phenotypic screens such as Perturb-seq (CRISPR-based screens with single-cell RNA-sequencing readouts) enable massively parallel functional genomic mapping but, to date, have been used at limited scales. Here, we perform genome-scale Perturb-seq targeting all expressed genes with CRISPR interference (CRISPRi) across >2.5 million human cells. We use transcriptional phenotypes to predict the function of poorly characterized genes, uncovering new regulators of ribosome biogenesis (including CCDC86, ZNF236, and SPATA5L1), transcription (C7orf26), and mitochondrial respiration (TMEM242). In addition to assigning gene function, single-cell transcriptional phenotypes allow for in-depth dissection of complex cellular phenomena-from RNA processing to differentiation. We leverage this ability to systematically identify genetic drivers and consequences of aneuploidy and to discover an unanticipated layer of stress-specific regulation of the mitochondrial genome. Our information-rich genotype-phenotype map reveals a multidimensional portrait of gene and cellular function.

Keywords: CRISPR; Integrator complex; Perturb-seq; cell biology; chromosomal instability; genetic screens; genotype-phenotype map; mitochondrial genome stress response; single-cell RNA sequencing.


Conflict of interest statement

Declaration of interests J.M.R. consults for Maze Therapeutics and is a consultant for and equity holder in Waypoint Bio. R.A.S. consults for Maze Therapeutics. K.A. is a consultant for Syros Pharmaceuticals, is on the SAB of CAMP4 Therapeutics, and received research funding from Novartis not related to this work. G.L.-Y., N.I., F.O., and D.L. are employees and shareholders of Ultima Genomics. M.J. consults for Maze Therapeutics and Gate Bioscience. T.M.N. consults for Maze Therapeutics. J.S.W. declares outside interest in 5AM Ventures, Amgen, Chroma Medicine, KSQ Therapeutics, Maze Therapeutics, Tenaya Therapeutics, Tessera Therapeutics, and Third Rock Ventures. The Regents of the University of California with R.A.S., T.M.N., M.J., and J.S.W. as inventors have filed patent applications related to CRISPRi/a screening and Perturb-seq.

Figures

Figure 1.
Figure 1.. Genome-scale Perturb-seq via multiplexed CRISPRi
(A) Experimental strategy. (B) On-target knockdown statistics in K562 cells (red) and RPE1 cells (blue). (C) Comparing growth phenotype versus the number of differentially expressed genes (DEGs) in K562 cells. Growth phenotypes are reported as the log2 guide enrichment per cell doubling (gamma). See also Figures S1, S2, and S3.
Figure 2.
Figure 2.. Data-driven inference of gene function from transcriptional phenotypes
(A) Analysis schematic. Genetic perturbations that elicited strong responses were clustered by correlation of expression of highly variable genes. (B) Distributions of pairwise expression profile correlations among all possible gene-gene pair versus among genes in 327 CORUM3.0 protein complexes that have at least two thirds of complex subunits within the dataset. (C) Kernel density estimates (KDEs) of STRING scores divided into bins based on expression profile correlation. (D) Minimum distortion embedding where each dot represents a genetic perturbation. Manual annotations (black labels) of cluster function are placed near the median location of genes within the cluster. CORUM complexes or STRING clusters (green labels) are annotated. (E) Quantification of 28S to 18S rRNA ratio after knockdown of indicated genes by CRISPRi. rRNA was measured by Bioanalyzer in biological duplicate with two distinct sgRNAs per gene (green and blue; solid gray lines represent mean). Dotted gray lines represent two standard deviations above and below the mean of non-targeting controls. See also Figure S4.
Figure 3.
Figure 3.. Discovery of a novel gene member and functional submodules of the Integrator complex
(A) Location of Integrator complex members in the minimum distortion embedding. (B) Relationship between Integrator complex members and C7orf26 in K562 cells and RPE1 cells. The heatmap shows the Pearson correlation between gene expression profiles of Integrator complex members. (C) Co-depletion of Integrator complex members. Integrator complex members were depleted by CRISPRi in K562 cells. Lysates were probed by western blot. (D) Co-immunoprecipitation of endogenous C7orf26 with His-INTS10. HEK293T were transfected with His-INTS10 or INTS10. Lysates were affinity purified and probed by western blot. (E) Purification of a INTS10-13-14-C7orf26 complex. His-INTS10, INTS13, INTS14, and C7orf26 were overexpressed, affinity purified, separated via SEC, and probed by western blot. (F) Effects of Integrator modules on gene-level splicing scores from Perturb-seq data. (G) Density of PRO-seq reads at the snRNA RNU1-1 locus mapping actively engaged RNA polymerase II. (H) Structure of the Integrator complex colored by Perturb-seq functional modules. The endonuclease (blue) and shoulder/backbone (orange) modules were obtained from the cryo-EM structure (Zheng et al., 2020). The model of the newly discovered INTS10-13-14-C7orf26 module was built by docking the crystal structure of INTS13-INTS14 (Sabath et al., 2020) with an AlphaFold multimeric model of INTS10 and C7orf26.
Figure 4.
Figure 4.. Summarizing genotype-phenotype relationships with Perturb-seq
(A) Analysis schematic. (B) Heatmap of the genotype-phenotype map. The heatmap represents the mean Z scored expression for gene expression and perturbation clusters labeled with manual annotations. (C) Comparison of ISR and UPR scores for perturbations. (D) Comparison of erythroid and myeloid differentiation scores for genetic perturbations. Genetic perturbations are colored to reflect cluster identity. (E) CD11b surface expression (measured by flow cytometry) upon knockdown of PTPN1 or KDM1A in K562 cells. (F) Correlation of composite phenotypes across time points and cell types. Fraction TE represents the number of non-intronic reads mapped to TEs over total, averaged over all cells bearing each perturbation. Fraction mtRNA represents the mean number of reads mapped to mitochondrial genome protein-coding genes over total. Total RNA represents the mean total RNA content. (G) Comparison of TE expression across time points. (H) Comparison of total RNA content across time points. See also Figure S5.
Figure 5.
Figure 5.. Exploring acute consequences and genetic drivers of aneuploidy in single cells
(A) Schematic of heterogeneity statistic. Single-cell leverage scores quantify how outlying each cell is relative to control cells with single-cell heterogeneity quantified as the standard deviation of leverage scores. (B) Identifying heterogeneous perturbations by comparison of single-cell heterogeneity to number of differentially expressed genes. (C) Heatmap of chromosome copy-number inference from Perturb-seq data. For expressed genes, the log-fold change in expression is calculated with respect to the average of control cells, and genes are ordered along the genome. A weighted moving average is used infer copy-number changes (columns) in single cells (rows). Cells are ordered by hierarchical clustering based on correlation of chromosome copy-number profiles. (D and E) Comparison of cell-cycle occupancy upon acute karyotypic changes. Abnormal karyotypic cells were defined as having ≥1 chromosome with evidence of changes in chromosome copy number for >80% of the chromosome length. Cell-cycle occupancy is shown as a 2D KDE of a random subset of 1,000 cells per karyotypic status. (F) Comparison of CIN status on ISR score in RPE1 cells. (G) Comparison of the effect of genetic perturbations on the CIN score across cell types. The perturbation CIN score is calculated as the mean single-cell sum of squared CIN values, z-normalized relative to control perturbations. (H) Schematic of a subset of genetic perturbations that drive CIN. See also Figures S6 and S7.
Figure 6.
Figure 6.. Global organization of the transcriptional response to mitochondrial stress
(A) Clustering perturbations of nuclear-encoded genes whose protein products are targeted to mitochondria (mitochondrial perturbations) by nuclear transcriptional response. Mitochondrial perturbations were annotated by MitoCarta3.0 and subset to those with a strong transcriptional phenotype (n = 268). The heatmap displays the Pearson correlation between mean normalized gene expression profiles of mitochondrial perturbations in K562 cells clustered by HDBSCAN. (B) Variability in the mitochondrial transcriptome by perturbation localization. For each of the 13 mitochondrially encoded genes, the variance in mean normalized expression profiles was calculated between all perturbations with the same localization (in the Human Protein Atlas). Barplots represent the average across genes with 95% confidence interval obtained by bootstrapping. (C) Clustering mitochondrial perturbations by mitochondrial transcriptional response. Mitochondrial perturbations were defined as in (A). Gene expression profiles were restricted to the 13 mitochondrial-encoded genes. Heatmap is displayed and clustered as in (A). Clusters were manually annotated. (D) Heatmap visualizing the mitochondrial genome transcriptional response to diverse mitochondrial stressors. The expression of the 13 mitochondrially encoded genes (relative to controls) is shown for a subset of representative mitochondrial perturbations. See also Figure S8.
Figure 7.
Figure 7.. Investigating regulation of the mitochondrial genome in stress
(A) Mitochondrial transcriptome schematic. (B) Density of Perturb-seq reads along the mitochondrial genome for select genetic perturbations. Reads are aligned to both the H-strand (dark gray) and L-strand (light gray). (C) Comparison of mitochondrial gene expression profiles between Perturb-seq and bulk RNA-seq. Heatmap displays changes in expression of the 13 mitochondria-encoded genes (columns) for perturbations (rows) in Perturb-seq and bulk total RNA-seq data collected from K562 cells. (D) Clustering of TMEM242 genetic perturbation based on the mitochondrial transcriptome. Genetic perturbations to members of ATP synthase and complex I of the respiratory chain were compared with knockdown of TMEM242, a mitochondrial gene of unknown function. Gene expression profiles were restricted to the 13 mitochondrially encoded genes. The heatmap displays the Pearson correlation between pseudobulk z-normalized gene expression profiles of mitochondrial perturbations in K562 cells. (E) Effect of TMEM242 knockdown on mitochondrial respiration. A Seahorse analyzer was used to monitor oxygen consumption rate (OCR) through a Mito stress test. Data are presented as average ± SEM, n = 6. (F) Schematic diagram of mitochondrial stress response. See also Figure S8.

Comment in

Similar articles

Cited by

References

    1. Adamson B, Norman TM, Jost M, Cho MY, Nuñez JK, Chen Y, Villalta JE, Gilbert LA, Horlbeck MA, Hein MY, et al. (2016). A multiplexed single-cell CRISPR screening platform enables systematic dissection of the unfolded protein response. Cell 167, 1867–1882.e21. 10.1016/j.cell.2016.11.048. - DOI - PMC - PubMed
    1. Alerasool N, Segal D, Lee H, and Taipale M (2020). An efficient KRAB domain for CRISPRi applications in human cells. Nat. Methods 17, 1093–1096. 10.1038/s41592-020-0966-x. - DOI - PubMed
    1. Allen JF (2017). The CoRR hypothesis for genes in organelles. J. Theor. Biol 434, 50–57. 10.1016/j.jtbi.2017.04.008. - DOI - PubMed
    1. Anderson AP, Luo X, Russell W, and Yin YW (2020). Oxidative damage diminishes mitochondrial DNA polymerase replication fidelity. Nucleic Acids Res 48, 817–829. 10.1093/nar/gkz1018. - DOI - PMC - PubMed
    1. Ben-David U, and Amon A (2020). Context is everything: aneuploidy in cancer. Nat. Rev. Genet 21, 44–62. 10.1038/s41576-019-0171-x. - DOI - PubMed

Publication types