. 2022 Jun 21;3(6):100657.
doi: 10.1016/j.xcrm.2022.100657. Epub 2022 Jun 9.

The immune cell atlas of human neuroblastoma

Affiliations

The immune cell atlas of human neuroblastoma

Bronte Manouk Verhoeven et al. Cell Rep Med. .

Abstract

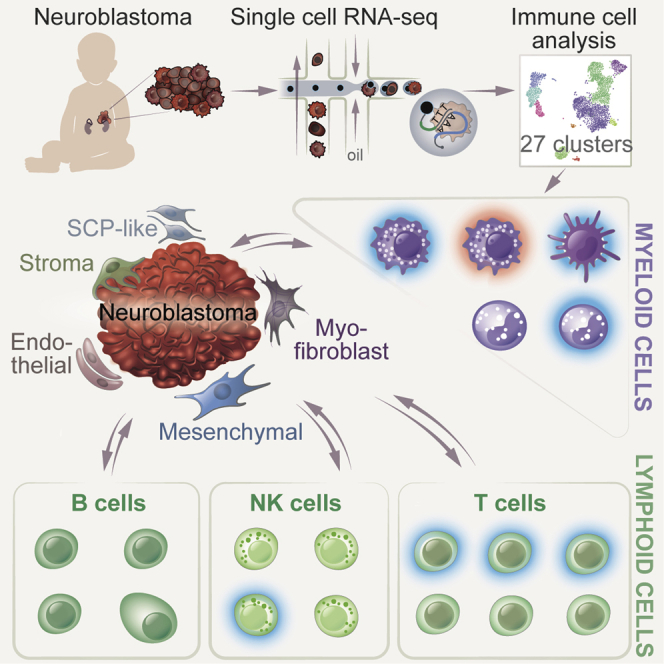
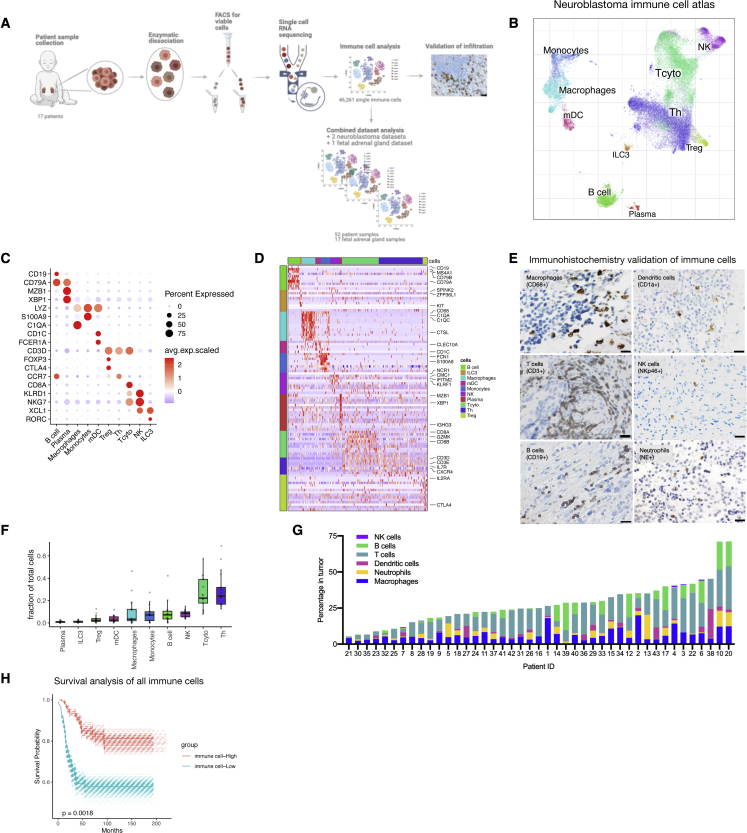
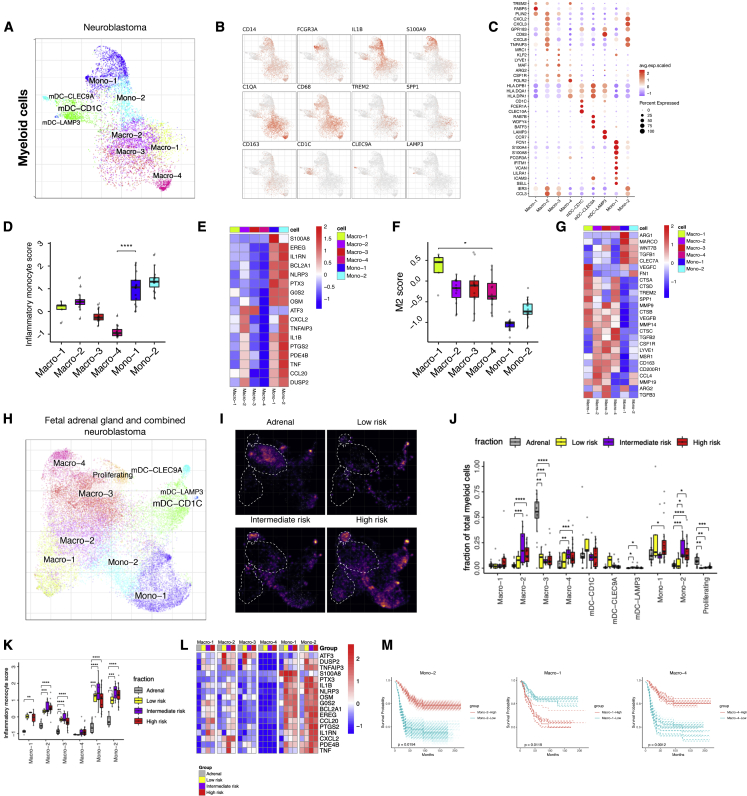
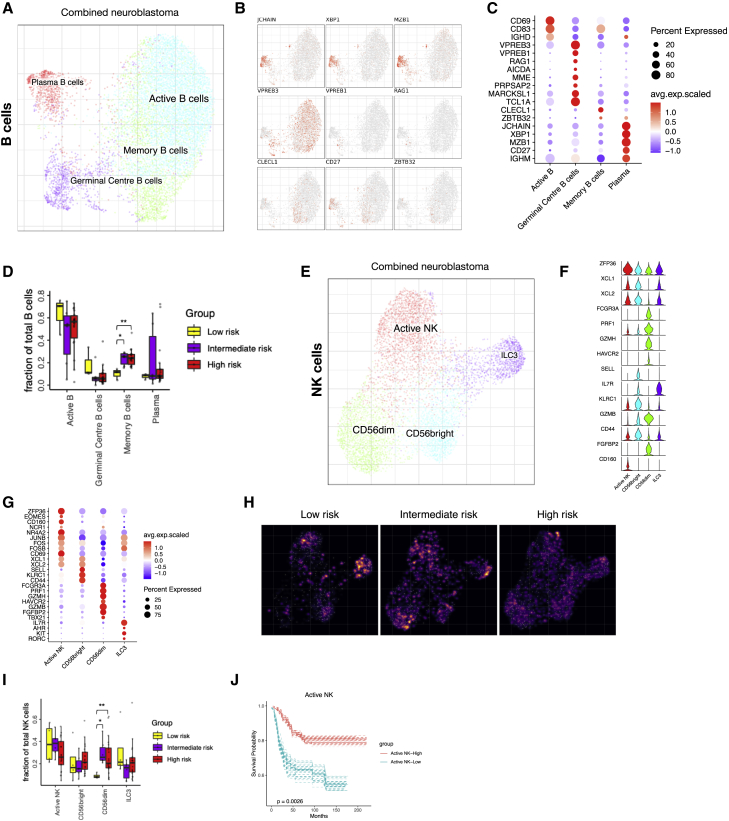
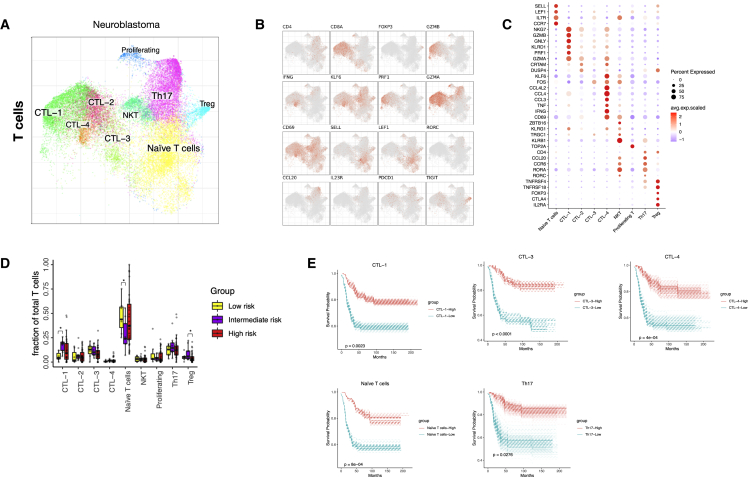
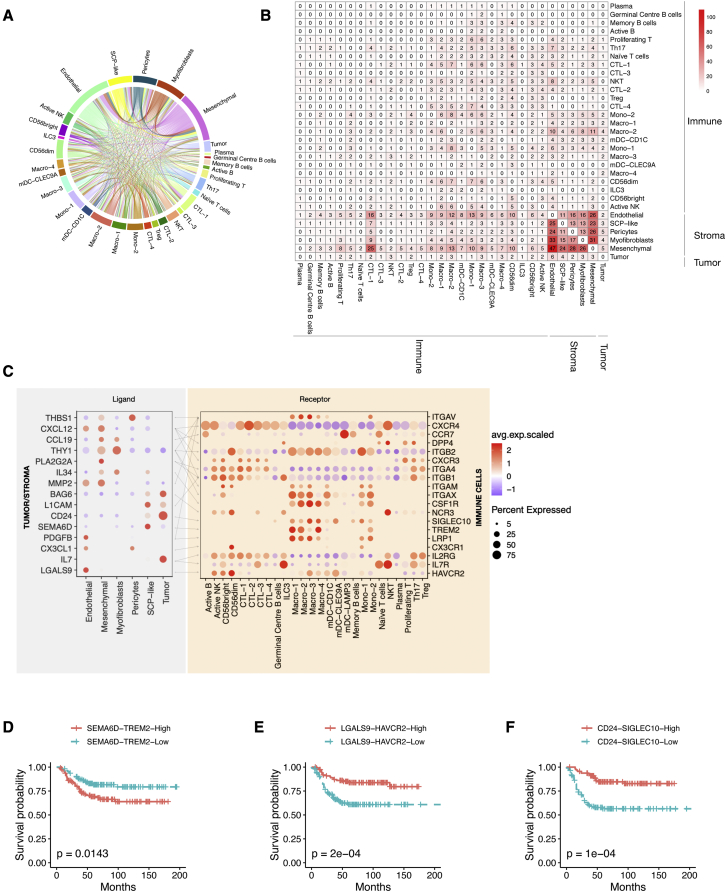
Understanding the complete immune cell composition of human neuroblastoma (NB) is crucial for the development of immunotherapeutics. Here, we perform single-cell RNA sequencing (scRNA-seq) on 19 human NB samples coupled with multiplex immunohistochemistry, survival analysis, and comparison with normal fetal adrenal gland data. We provide a comprehensive immune cell landscape and characterize cell-state changes from normal tissue to NB. Our analysis reveals 27 immune cell subtypes, including distinct subpopulations of myeloid, NK, B, and T cells. Several different cell types demonstrate a survival benefit. In contrast to adult cancers and previous NB studies, we show an increase in inflammatory monocyte cell state when contrasting normal and tumor tissue, while no differences in cytotoxicity and exhaustion score for T cells, nor in Treg activity, are observed. Our receptor-ligand interaction analysis reveals a highly complex interactive network of the NB microenvironment from which we highlight several interactions that we suggest for future therapeutic studies.

Keywords: cancer; human; immune cell landscape; immuno-oncology; immunotherapy; neuroblastoma; pediatric cancer; prognosis; single-cell RNA sequencing; survival.


Conflict of interest statement

Declaration of interests P.V.K. serves on the Scientific Advisory Board to Celsius Therapeutics and Biomage and also consults for Altos Labs.

Figures

None
Graphical abstract
Figure 1
Figure 1
Global immune cell landscape of human NB (A) Experimental design: human NB tumor tissue was mechanically and enzymatically dissociated. Immune cells were studied in silico, infiltration validated using immunohistochemistry, and additional data added for combinational analysis. (B) Global overview of NB immune cell atlas containing 46,261 cells, color coded by annotated cell type (n = 17). (C and D) (C) Subset marker gene expression and (D) heatmap of marker genes associated with major immune cell types. (E) Images for macrophages (CD68+), dendritic cells (CD1a+), neutrophils (NE+), NK cells (NKp46+), B cells (CD19+), and T cells (CD3+) in NB tumors. Scale bar, 100 μm. n = 43. (F) Fraction of cells from all immune cells shown for the different subtypes (n = 17). (G) Quantification of percentage of cells from (E) (n = 43). (H) Survival data on bulk RNA-seq data. A gene signature derived from scRNA-seq high was considered the top 25% highest expression of the signature genes, whereas low is the lowest 25% expression of the signature genes (STAR Methods).
Figure 2
Figure 2
Myeloid cell infiltration with distinct cell states detected in NB (A–C) (A) Subcluster view of the myeloid cells as shown on a myeloid-specific joint embedding. Key marker gene expression shown in feature plots (B) and in a dotplot (C) for the different subpopulations of myeloid cells. (D) Average expression of inflammatory monocyte score in different myeloid subpopulations (n = 16). (E) Heatmap showing average expression of select genes from different categories (rows) across different cell populations. (F and G) Similar to (Dand E), showing M2 score (n = 16) and representative M2 signature gene expression. (H) UMAP showing combined myeloid cell integration (CONOS) including fetal adrenal and public NB single-cell data. (I) Density plot comparing myeloid cells in fetal adrenal gland myeloid cells, and low-, intermediate-, and high-risk NB. Brighter color corresponds to a denser region. (J) Cell fractions of different myeloid populations in fetal adrenal gland (n = 16), and low- (n = 5), intermediate- (n = 8), and high-risk (n = 21) disease. (K) Inflammatory monocyte score for combined dataset comparing fetal adrenal gland (n = 16), and low- (n = 5), intermediate- (n = 8), and high-risk (n = 21) NB for different myeloid subpopulations. Statistical significance was assessed by Wilcoxon rank-sum test for (D, F, J, and K); ∗p < 0.05, ∗∗p < 0.01, ∗∗∗p < 0.001, ∗∗∗∗p < 0.0001. (L) Heatmap showing average expression of select genes from different categories (rows) across different cell populations (top color bar, colors matching) (K). (M) Similar to Figure 1E, survival curves for Mono-2, Macro-1, and Macro-4.
Figure 3
Figure 3
B and NK cell heterogeneity and infiltration in NB tumors (A–C) (A) Detailed annotation of the B cells subpopulations is shown on a B cell-specific joint embedding combining multiple NB datasets. Key marker gene expression shown in feature plots (B) and in a dotplot (C) for the different subpopulations of B cells. (D) The fraction of B cell subtypes comparing low- (n = 3), intermediate- (n = 6), and high-risk (n = 18) NB. Wilcoxon rank-sum test was used for statistical analysis; ∗p < 0.05, ∗∗p < 0.01. (E–G) (E) Detailed annotation of NK cell subpopulations shown on NK cell-specific embedding from the combined dataset. Key marker gene expression shown in a violin plot (F) and in a dotplot (G) for the different subpopulations of NK cells. (H) Density plot for NK cell-specific embedding showing the number of cells in low-, intermediate-, and high-risk NB. Brighter color corresponds to a denser region. (I) The fraction of cells in the different NK cell populations comparing low- (n = 4), intermediate- (n = 6), and high-risk (n = 21) NB. Wilcoxon rank-sum test was used for statistical analysis; ∗p < 0.05, ∗∗p < 0.01. (J) Survival curve for active NK cells.
Figure 4
Figure 4
Distinct subtypes of T cell infiltrates correlate with improved NB survival (A–C) (A) Detailed annotation of the T cell subpopulations shown on a T cell-specific joint embedding, together with marker genes (B and C). (D) The fraction of T cell subtypes detected in low- (n = 4), intermediate- (n = 9), and high-risk (n = 23) NB. Wilcoxon rank-sum test was used for statistical analysis; ∗p < 0.05. (E) Survival curves for CTL-1, -3, -4, naive T cells, and Th17.
Figure 5
Figure 5
Tumor-immune cell ligand-receptor interaction analysis reveals several interactions for future studies (A) Interaction map with ligand-receptor interactions within the NB tumor microenvironment (n = 19). (B) Table displaying the number of interactions (n = 1,973) between the different subpopulations present in human NB tumors that are significantly correlated with patient survival and specifically expressed in a subtype of cells. (C) Heatmap showing expression of ligand (tumor/stroma) and receptor (immune) pairs in different tumor/stroma and immune subsets. Dot size indicates expression ratio, color represents average gene expression. Significance of ligand-receptor pair is determined by permutation test, correlation to survival and specific cellular expression (see STAR Methods). (D) Survival curve for SEMA6D-TREM2 expression. (E) Survival curve for LGALS9-HAVCR2 expression. (F) Survival curve for CD24-SIGLEC10 expression.

References

    1. Johnsen J.I., Dyberg C., Wickström M. Neuroblastoma—a neural crest derived embryonal malignancy. Front. Mol. Neurosci. 2019;12:1–11. doi: 10.3389/fnmol.2019.00009. - DOI - PMC - PubMed
    1. Pinto N.R., Applebaum M.A., Volchenboum S.L., Matthay K.K., London W.B., Ambros P.F., Nakagawara A., Berthold F., Schleiermacher G., Park J.R., et al. Advances in risk classification and treatment strategies for neuroblastoma. J. Clin. Oncol. 2015;33:3008–3017. doi: 10.1200/jco.2014.59.4648. - DOI - PMC - PubMed
    1. Gajewski T.F., Schreiber H., Fu Y.X. Innate and adaptive immune cells in the tumor microenvironment. Nat. Immunol. 2013;14:1014–1022. doi: 10.1038/ni.2703. - DOI - PMC - PubMed
    1. Vinay D.S., Ryan E.P., Pawelec G., Talib W.H., Stagg J., Elkord E., Lichtor T., Decker W.K., Whelan R.L., Kumara H.M.C.S., et al. Immune evasion in cancer: mechanistic basis and therapeutic strategies. Semin. Cancer Biol. 2015;35:S185–S198. doi: 10.1016/j.semcancer.2015.03.004. - DOI - PubMed
    1. Mina M., Boldrini R., Citti A., Romania P., D'Alicandro V., De Ioris M., Castellano A., Furlanello C., Locatelli F., Fruci D. Tumor-infiltrating T lymphocytes improve clinical outcome of therapy-resistant neuroblastoma. OncoImmunology. 2015;4 doi: 10.1080/2162402x.2015.1019981. - DOI - PMC - PubMed

Publication types