. 2022 Sep:258:119362.
doi: 10.1016/j.neuroimage.2022.119362. Epub 2022 Jun 8.

Cerebrovascular activity is a major factor in the cerebrospinal fluid flow dynamics

Affiliations

Cerebrovascular activity is a major factor in the cerebrospinal fluid flow dynamics

Yicun Wang et al. Neuroimage. 2022 Sep.

Abstract

Cerebrospinal fluid (CSF) provides physical protection to the central nervous system as well as an essential homeostatic environment for the normal functioning of neurons. Additionally, it has been proposed that the pulsatile movement of CSF may assist in glymphatic clearance of brain metabolic waste products implicated in neurodegeneration. In awake humans, CSF flow dynamics are thought to be driven primarily by cerebral blood volume fluctuations resulting from a number of mechanisms, including a passive vascular response to blood pressure variations associated with cardiac and respiratory cycles. Recent research has shown that mechanisms that rely on the action of vascular smooth muscle cells ("cerebrovascular activity") such as neuronal activity, changes in intravascular CO2, and autonomic activation from the brainstem, may lead to CSF pulsations as well. Nevertheless, the relative contribution of these mechanisms to CSF flow remains unclear. To investigate this further, we developed an MRI approach capable of disentangling and quantifying CSF flow components of different time scales associated with these mechanisms. This approach was evaluated on human control subjects (n = 12) performing intermittent voluntary deep inspirations, by determining peak flow velocities and displaced volumes between these mechanisms in the fourth ventricle. We found that peak flow velocities were similar between the different mechanisms, while displaced volumes per cycle were about a magnitude larger for deep inspirations. CSF flow velocity peaked at around 10.4 s (range 7.1-14.8 s, n = 12) following deep inspiration, consistent with known cerebrovascular activation delays for this autonomic challenge. These findings point to an important role of cerebrovascular activity in the genesis of CSF pulsations. Other regulatory triggers for cerebral blood flow such as autonomic arousal and orthostatic challenges may create major CSF pulsatile movement as well. Future quantitative comparison of these and possibly additional types of CSF pulsations with the proposed approach may help clarify the conditions that affect CSF flow dynamics.

Keywords: Balanced SSFP MRI; CBF regulation; CSF flow velocity; CSF pulsations; Cerebrovascular activity; Respiratory modulation.


Conflict of interest statement

Declaration of Competing Interest None.

Figures

Figure 1.
Figure 1.
Contributing mechanisms of CSF flow manifest distinctly on continuously acquired SSFP. A An example image frame with tag positions of interest labelled: Reference (REF), fourth ventricle, dorsal and ventral sides of the cervical spine C2 level. The tags were equidistantly distributed except near the nasal cavity due to the strong nonlinear magnetic gradient resulted from the tissue-air interface. B,C Physiological recordings and SSFP signal intensity along the line segments (shown on A) plotted with time. The matrix resolution was 1.3 mm by 246 ms. Blue and green plots correspond to chest respiratory belt and PPG cardiac signals, respectively. At resting state (B), cardiac cycles (green arrows) and normal respiratory cycles (light blue arrows) were evident. During periodic deep breaths (C), in addition to the instantaneous CSF flow (dark blue arrows), there were also sustaining myoactive CSF surges (orange arrows) emerging at a few seconds delay from each deep breath. CSF, cerebrospinal fluid. SSFP, (balanced) steady state free precession. PPG, photoplethysmography.
Figure 2.
Figure 2.
Overview of dictionary-based CSF flow quantification. A-C CSF flow simulation and dictionary generation. A Simulation results for HF peak velocity of 10 mm/s with background LF flow of 2 mm/s. Yellow box contours the converged result within a single cycle used for further analysis. B Juxtaposition of a subset of such patches generated from the simulation for further processing. C Phase cycling and downsampling of a single patch. 8-step phase shifts were applied to account for the time delay between the cardiac cycle and flow patterns. D Simultaneous acquisition of the chest belt signal, PPG signal and SSFP MRI in the central sagittal plane. The PPG peaks are denoted by red circles and used for temporal binning of the MRI data, generating CSF flow “perturbation patterns” explained below. E CSF flow quantification by dictionary matching. At each CSF location of interest, dictionary entries were matched through correlation to perturbation patterns. Each cardiac cycle (corresponding to a single perturbation pattern) is denoted by a red dot, evenly distributed in time after zero-padding (blue) to a fixed width of 5 time points. The corresponding HF peak velocity and LF velocity values of the best match were recorded and plotted. Corr. Coef., correlation coefficient.
Figure 3.
Figure 3.
Monte-Carlo simulation results from one of the 500 trials. Blue plots show the ground truth parameters corresponding to each cardiac cycle, i.e. numbers used to simulate the 3-frequency oscillating flow. Orange shows the dictionary matching results. The pattern width was either 3, 4 or 5 for cardiac periods closest to 0.75, 1.00, 1.25 s, respectively. The black plot is the correlation coefficient between the perturbation patterns and their best match. Data (perturbation patterns), their best match and the difference are show in a stacked manner. A section is zoomed in for improved visualization.
Figure 4.
Figure 4.
Flow phantom validation result. A SSFP images of constant flow from five runs with increasing velocities. The tag distance was 45 mm. B SSFP signal profiles in the center of the tube (solid) and the best dictionary matches (dashed). Legend shows the flow velocity measured using PC-MRI, also in the center of the tube.
Figure 5.
Figure 5.
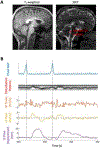
Flow quantification results associated with deep breaths at an example location of interest. A T1 weighted anatomical reference and SSFP of the same sagittal slice. The voxel of interest was in the fourth ventricle. B Chest belt signal, perturbation patterns, and flow detection results. LF flow displacement is plotted in purple, calculated by integrating the LF flow velocity. Horizontal dashed lines denote zero on the LF plots. Vertical dashed lines denote the end of deep inspiration.
Figure 6.
Figure 6.
Barogenic and myoactive origins of CSF pulsations with deep inspiration. A T1-weighted anatomical reference and an example SSFP frame labelled with CSF locations of interest. B CSF velocities in the fourth ventricle and near the foramen of Magendie measured by the proposed approach. Results are in mean ± standard error of the mean over subjects. C BOLD signal percent changes in gray matter (GM) and white matter (WM), their negative time derivatives, and CSF cranial inflow signal in the fourth ventricle, acquired using the same deep inspiration paradigm. CSF flow peaked at 11 s delay and 2-3 s later than the peak of negative time derivative of BOLD, a surrogate for cerebral blood volume reduction.

Similar articles

Cited by

References

    1. Aktas G, Kollmeier JM, Joseph AA, Merboldt K-D, Ludwig H-C, Gärtner J, Frahm J, Dreha-Kulaczewski S, 2019. Spinal CSF flow in response to forced thoracic and abdominal respiration. Fluids and Barriers of the CNS 16, 10. 10.1186/s12987-019-0130-0 - DOI - PMC - PubMed
    1. Alperin N, Vikingstad EM, Gomez-Anson B, Levin DN, 1996. Hemodynamically independent analysis of cerebrospinal fluid and brain motion observed with dynamic phase contrast MRI. Magnetic Resonance in Medicine 35, 741–754. 10.1002/mrm.1910350516 - DOI - PubMed
    1. Attarpour A, Ward J, Chen JJ, 2021. Vascular origins of low-frequency oscillations in the cerebrospinal fluid signal in resting-state fMRI: Interpretation using photoplethysmography. Human Brain Mapping 42, 2606–2622. 10.1002/hbm.25392 - DOI - PMC - PubMed
    1. Axel L, Dougherty L, 1989. MR imaging of motion with spatial modulation of magnetization. Radiology 171, 841–845. 10.1148/radiology.171.3.2717762 - DOI - PubMed
    1. Balédent O, Gondry-Jouet C, Meyer M-E, De Marco G, Le Gars D, Henry-Feugeas M-C, Idy-Peretti I, 2004. Relationship Between Cerebrospinal Fluid and Blood Dynamics in Healthy Volunteers and Patients with Communicating Hydrocephalus. Investigative Radiology 39, 45–55. 10.1097/01.rli.0000100892.87214.49 - DOI - PubMed

Publication types