. 2022 Jun 10;13(1):3236.
doi: 10.1038/s41467-022-30979-0.

Excess ribosomal protein production unbalances translation in a model of Fragile X Syndrome

Affiliations

Excess ribosomal protein production unbalances translation in a model of Fragile X Syndrome

Sang S Seo et al. Nat Commun. .

Abstract

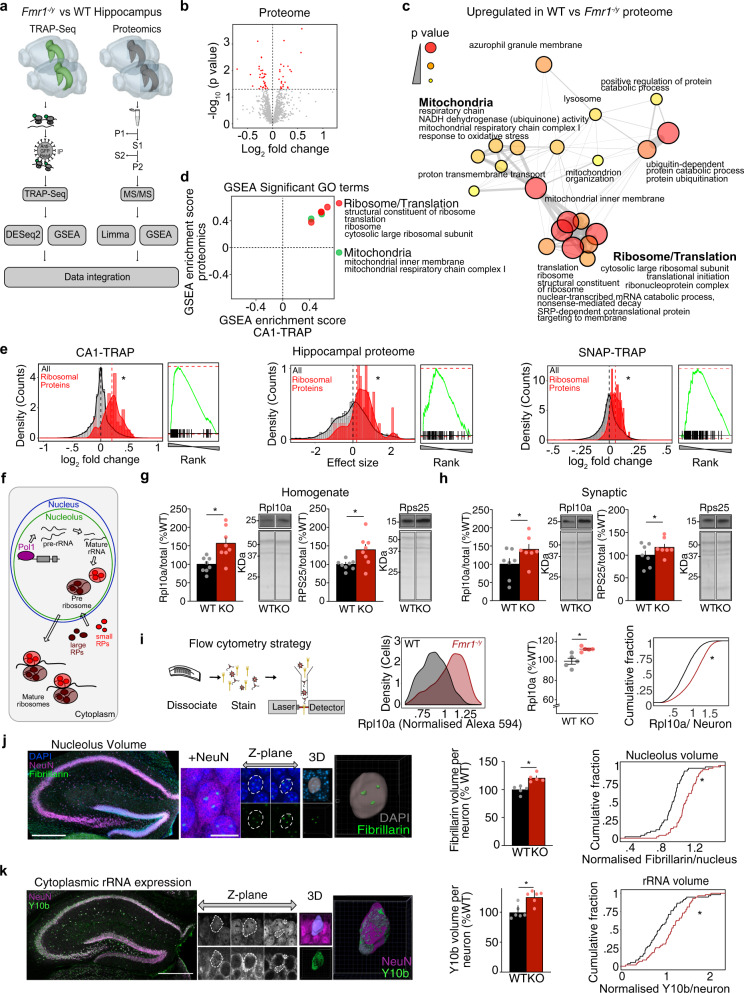
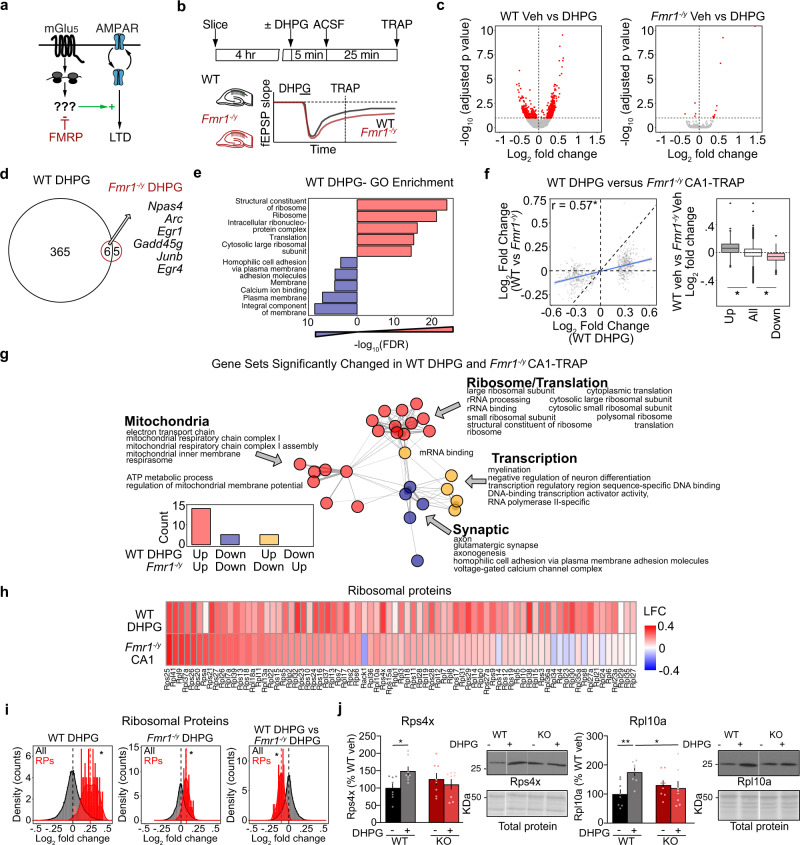
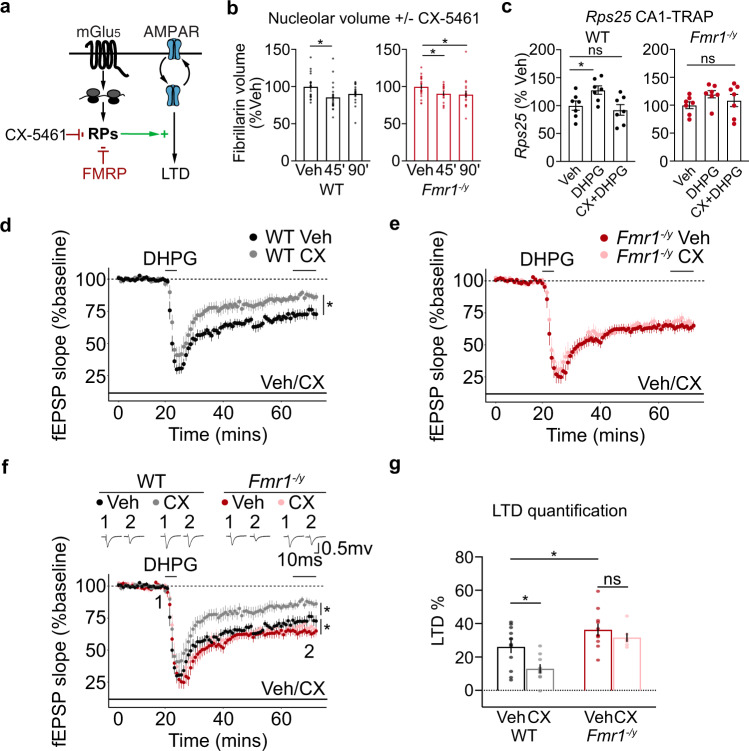
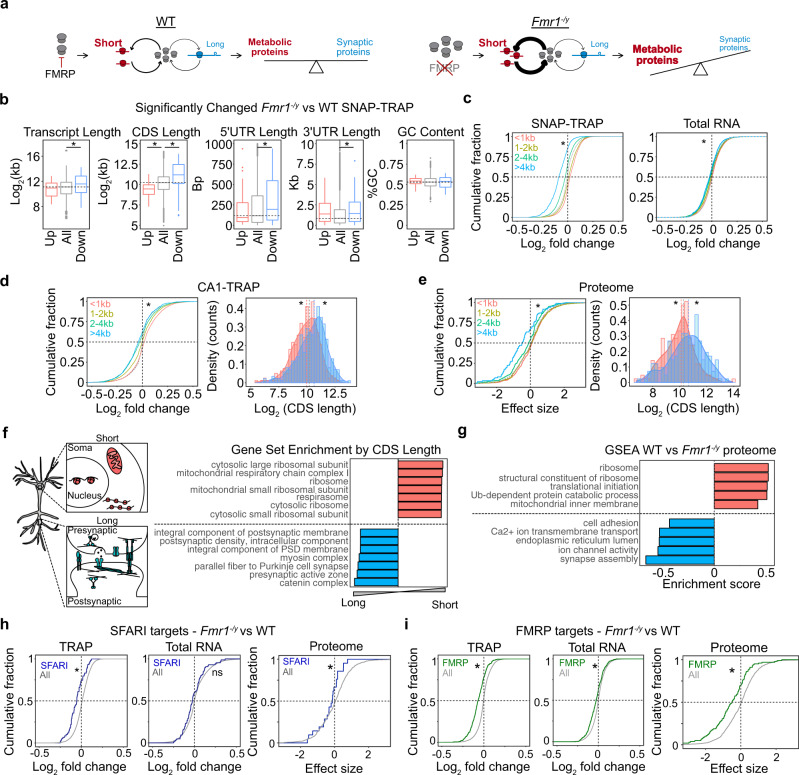
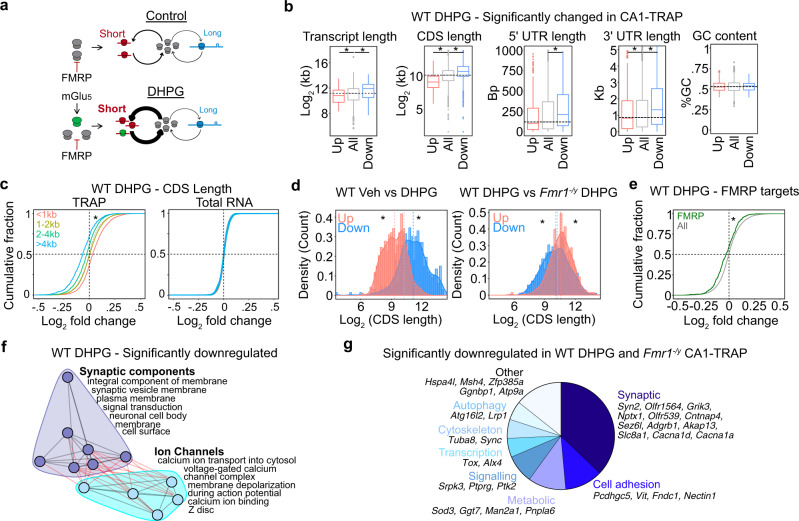
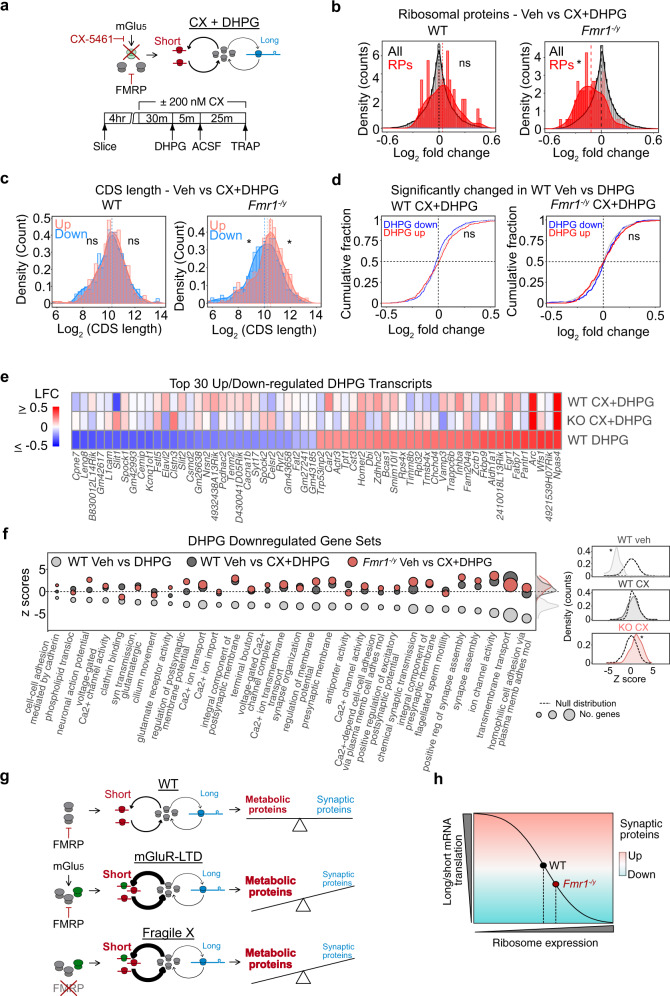
Dysregulated protein synthesis is a core pathogenic mechanism in Fragile X Syndrome (FX). The mGluR Theory of FX predicts that pathological synaptic changes arise from the excessive translation of mRNAs downstream of mGlu1/5 activation. Here, we use a combination of CA1 pyramidal neuron-specific TRAP-seq and proteomics to identify the overtranslating mRNAs supporting exaggerated mGlu1/5 -induced long-term synaptic depression (mGluR-LTD) in the FX mouse model (Fmr1-/y). Our results identify a significant increase in the translation of ribosomal proteins (RPs) upon mGlu1/5 stimulation that coincides with a reduced translation of long mRNAs encoding synaptic proteins. These changes are mimicked and occluded in Fmr1-/y neurons. Inhibiting RP translation significantly impairs mGluR-LTD and prevents the length-dependent shift in the translating population. Together, these results suggest that pathological changes in FX result from a length-dependent alteration in the translating population that is supported by excessive RP translation.


Conflict of interest statement

The authors declare no competing interests.

Figures

Fig. 1
Fig. 1. Ribosomes are overproduced in Fmr1−/y hippocampal neurons.
a Schematic of the experimental strategy. Multi-Omics approach was used to identify overtranslating and overexpressed proteins. b Volcano plot of proteomics analysis of hippocampal P2 fractions isolated from WT/Fmr1−/y littermates. Significant targets (P < 0.05) are denoted in red. c GSEA analysis of the proteomics dataset identified overexpression of ribosome/translation and mitochondrial-related GO terms in the Fmr1−/y (adjusted P value < 0.1). d Overlap of significantly upregulated gene sets identified by GSEA in both TRAP-seq and proteomic datasets reveals ribosome/translation and mitochondrial GO terms as the most enriched in the upregulated populations. e Analysis of the 80 RP population versus total population in Fmr1−/y versus WT CA1-TRAP, proteomic, and SNAP-TRAP datasets reveal a significant upregulation in all three datasets (two-sample z test: z = 6.54, *P = 6.25 × 1011, z = 2.51, *P = 0.012, z = 5.12, *P = 3.11 × 107, CA1-TRAP, P2 proteomic, Snap-TRAP, respectively). f Schematic of ribogenesis showing precursor rRNA transcription in the nucleolus by RNA Pol I, followed by splicing and folding into mature rRNA subunits, RP production, and association with mature ribosomes upon export to the cytoplasm. g Immunoblotting of hippocampal homogenates from Fmr1−/y and WT littermates revealed a significant increase in the large ribosome-associated protein Rpl10a (WT = 100 ± 7.1%, Fmr1−/y= 158.7 ± 15.19%, two-tailed paired t test *P = 0.0008, N = 8 littermate pairs) and the small ribosome-associated protein Rps25 (WT = 100 ± 4.53%, Fmr1−/y = 139.7 ± 14.28%, two-tailed paired t test *P = 0.0468, N = 8 littermate pairs). h Synaptoneurosomes isolated from WT and Fmr1−/y hippocampi show the same increase in Rpl10a (WT = 100 ± 15.44%, Fmr1−/y = 140.4 ± 13.95%, two-tailed paired t test *P = 0.0436, N = 7 littermate pairs) and Rps25 (WT = 100 ± 9.18%, Fmr1−/y = 117.1 ± 7.1%, two-tailed paired t test *P = 0.0235, N = 7 littermate pairs). i Schematic showing steps for FACS immunostaining. Comparison of CA1 neurons isolated from 5 littermate pairs shows a significant increase in Rpl10a expression in Fmr1−/y vs WT (two-tailed paired t test, WT = 100 ± 3.1%, Fmr1−/y = 112.5 ± 1.08%, *P = 0.02915, KS test *P = 2.2e-16). j Sections from Fmr1−/y and WT littermate brains were immunostained for NeuN, fibrillarin and DAPI or NeuN and Y10b before confocal imaging of the dorsal hippocampal CA1 region (scale bar = 10 μm). Total nucleolar volume was quantified from 3D reconstruction of fibrillarin staining. Analysis shows a significant increase in total nucleolar volume per cell in Fmr1−/y vs WT neurons when quantified per animal (two-tailed paired t test, WT = 100 ± 3.277%, Fmr1−/y = 121.2 ± 3.277% *P = 0.032 N = 5 littermate pairs) or as a cumulative distribution of all neurons (KS test *P = 2.93e-07, N = 52 neurons). k Volume of rRNA was quantified from 3D reconstruction of Y10b staining normalized to NeuN. A significant increase in rRNA volume was observed in in Fmr1−/y neurons (two-tailed paired t test, WT = 100 ± 4.458%, Fmr1−/y = 125.4 ± 4.458%, *P = 0.0358, N = 6 littermate pairs, KS test *P = 0.00792, N = 59 neurons). Data are presented as mean values + /− SEM. Source data are provided as a Source Data file.
Fig. 2
Fig. 2. mGluR-LTD induces translation changes that are mimicked and occluded in Fmr1−/y neurons, including translation of RPs.
a Schematic of the mGluR Theory of FX. b Schematic of the experimental strategy. WT and Fmr1−/y slices were recovered and stimulated for mGluR-LTD using a protocol of 5 min DHPG followed by a washout of 25 min, after which TRAP was performed. c Volcano plots of TRAP-seq data show that DHPG induces substantial significant translational changes in WT but not in Fmr1−/y CA1 neurons (DESeq2 adjusted P value < 0.1). d Quantification shows 371 targets upregulated in WT and only 11 targets in Fmr1−/y. Overlapping include immediate early genes that report neuronal activity, including Npas4 and Arc. e DAVID GO enrichment analysis of the up- and downregulated populations induced by DHPG reveals that ribosome/translation-related transcripts are enriched in the upregulated population whereas membrane/ calcium ion binding transcripts are enriched in the downregulated fraction. f Transcripts significantly changed in WT DHPG are significantly correlated with basal expression changes in Fmr1−/y (r = 0.57, *P < 2.2 × 1016). Analysis of the significantly up- and downregulated transcripts in the WT DHPG dataset shows they exhibit a significant basal log2 fold change difference in the Fmr1−/y population as well when compared to the total population (up: Minimum −0.1769533, Lower −0.0001, Middle 0.0593, Upper 0.1197, Maximum 0.2970; all: Minimum −0.205203, Lower −0.0527, Middle −0.0026, Upper 0.0489, Maximum 0.2013; down: Minimum −0.251703, Lower −0.1103, Middle −0.0597, Upper −0.0151, Maximum 0.1263, Kruskal–Wallis test *P < 2.2 × 1016, Post hoc two-sided Wilcoxon rank-sum test up *P < 2.2 × 1016, down *P < 2.2 × 1016). g To determine whether the gene sets altered with LTD are similar to those already altered in the Fmr1−/y translating population, GSEA was performed on the WT DHPG population, and significantly changed gene sets (adjusted P value < 0.1) were compared to those significantly changed in the Fmr1−/y population (P value < 0.01). This reveals a striking overlap with ribosome/mitochondrial terms upregulated in both WT DHPG and Fmr1−/y, and synaptic terms downregulated in both populations. h A heatmap of log2 fold change shows that RPs are basally upregulated in Fmr1−/y and in WT after DHPG stimulation. i RPs show an increase with DHPG in WT CA1-TRAP that is seen to a lesser degree in Fmr1−/y CA1-TRAP (z test WT-LTD: z = 14.74, *P < 2.2 × 1016, Fmr1−/y-LTD: z = 6.35, *P = 2.2 × 1010). A comparison of the DHPG effect on RP expression shows the response in Fmr1−/y is occluded when compared to WT (z test: z = −8.68, *P < 2.2 × 1016). j Immunoblot analysis from synaptoneurosome fractions isolated from WT and Fmr1−/y slices stimulated with DHPG shows a significant upregulation of Rps4x (WT = 100 ± 11.6%, WT DHPG = 148.9 ± 11.9%, Fmr1−/y = 125.6 ± 16.4%, Fmr1−/y DHPG = 110.4 ± 14.0%. Two-way ANOVA genotype ×  treatment *P = 0.0258, WT vs WT DHPG P = 0.0169, N = 8 littermate pairs) and Rpl10a (WT = 100 ± 14.8%, WT DHPG = 175.3 ± 12.9%, Fmr1−/y = 130.9 ± 15.1%, Fmr1−/y DHPG = 120.6 ± 22.8%. Two-way ANOVA genotype × treatment *P = 0.0212, WT vs WT DHPG P = 0.0149. N = 8 littermate pairs) in WT slices and no change in Fmr1−/y. Data are presented as mean values + /− SEM. Source data are provided as a Source Data file.
Fig. 3
Fig. 3. RP translation is required for mGluR-LTD in WT but not in Fmr1−/y hippocampal CA1.
a Schematic of experimental strategy. Specific RNA Pol1 blocker CX-5461 was used to ribogenesis, including RP translation. b Fibrillarin staining of hippocampal slices shows that nucleolar volume of CA1 pyr neurons is significantly reduced in both genotypes with 200 nM CX-5461 treatment by 45 min (WT: Veh = 100 ± 3.0%, CX 45’ = 85.9 ± 3.8%, CX 90’ = 90.8 ±  2.7%. One-way ANOVA *P = 0.0206, post hoc Veh-45’ *FDR = 0.0141, Veh-90’ FDR = 0.070. N = 20 neurons per group). (Fmr1−/y: Veh = 100 ± 2.5%, CX 45’ = 90.96 ± 2.4%, CX 90’ = 90.05 ± 4.2%. One-way ANOVA *P = 0.0488, post hoc *Veh-45’ FDR = 0.0485, *Veh-90’ FDR = 0.0485, N = 20 neurons per group). c CA1-TRAP and qPCR analysis of Rps25 translation in hippocampal slices confirms an upregulation in the WT in response to DHPG at 30’ that is blocked with 200 nM CX-5461. DHPG does not elicit a significant increase in Rps25 translation in Fmr1−/y slices nor does CX-5461 have a significant effect (WT: Veh = 100 ± 8.22%, DHPG = 127.9 ± 7.5%, CX + DHPG = 92.3 ± 9.5%. One-way ANOVA *P = 0.0388, post hoc Veh-DHPG *FDR = 0.0121, Veh-CXDHPG FDR = 0.3506, N = 7 littermate pairs. Fmr1−/y: Veh = 100 ±  6.2%, DHPG = 119.6 ± 6.5%, CX + DHPG = 108.5 ± 10.9%. One-way ANOVA P = 0.2627). N = 7 littermate pairs. Data are presented as mean values + /− SEM. d, e mGluR-LTD was measured in hippocampal CA1 in the presence of vehicle or CX-5461. Slices were prepared from Fmr1−/y and WT, recovered for at least 2 h, and exposed to vehicle or 200 nM CX-5461 for at least 30 min prior to DHPG application and throughout the LTD recording. CX-5461 causes a significant reduction in LTD magnitude in WT CA1 versus vehicle (Veh = 26.13% ± 3.5% N = 12 animals, CX-5461 = 13.00% ± 2.4% N  = 10 animals, *FDR = 0.0031). In contrast, CX-5461 does not significantly reduce LTD magnitude in Fmr1−/y CA1 versus vehicle (Veh = 36.337% ± 3.9% N = 11 animals, CX-5461 = 31.717% ± 2.3% N = 7, animals. FDR = 0.1224). f, g Quantification of all four groups show a differential effect of CX-5461 on LTD in each genotype (WT-Veh = 26.13% ± 3.5% N = 12 animals, WT-CX54611 = 13.00% ± 2.4% N = 10 animals, Fmr1−/y Veh = 36.337% ± 3.9% N = 11 animals, Fmr1−/y CX-5461 = 31.717% ± 2.3% N = 7, animals. Two-way ANOVA, genotype *P < 0.001 treatment *P = 0.01, post hoc: WT-Veh vs Fmr1−/y-Veh *FDR = 0.0107, WT-Veh vs WT-CX-5461 *FDR = 0.0031, Fmr1−/y-Veh vs Fmr1−/y-CX-5461 FDR =  0.1224). Data are presented as mean values  + /− SEM. Source data are provided as a Source Data file.
Fig. 4
Fig. 4. Under-translation of long mRNAs causes reduced expression of synaptic proteins, autism risk factors, and FMRP targets in Fmr1−/y hippocampal neurons.
a A model of altered translation in FX proposes that increased ribosome production changes the differential rate of translation between short and long mRNAs, which ultimately alters the proportion of proteins with metabolic versus synaptic functions. b The significantly altered Fmr1−/y SNAP-TRAP population (DESeq2 adjusted P value < 0.1) exhibits an imbalance in transcript length, CDS length, 5’UTR length and 3’UTR that indicates under-translation of long, low-initiation mRNAs (transcript length: Kruskal–Wallis *P = 4.01 × 105, Wilcoxon rank-sum test all vs up P = 0.733, all vs down *P = 7.28 × 106, CDS length: Kruskal–Wallis *P = 2.219 × 1014, Wilcoxon rank-sum test all vs up *P = 3.181 × 105, all vs down *P = 1.516 × 1011, 5’UTR length: Kruskal–Wallis *P = 0.01179, Wilcoxon rank-sum test all vs up P = 0.9794, all vs down *P = 0.00282, 3’UTR length: Kruskal–Wallis *P = 0.0022, Wilcoxon rank-sum test all vs up P = 0.1103, all vs down *P = 0.001827, coding GC content: Kruskal–Wallis P = 0.5817). c A binned analysis of the total Fmr1−/y SNAP-TRAP population shows that the CDS length imbalance is seen in the whole ribosome-bound population, with the shortest group showing the most positive log2 fold change distribution and the longest group showing the lowest log2 fold change (two-sided KS test, <1 kb vs >4 kb *P < 2.2 × 1016 d = 0.537). The total transcriptome also demonstrates this property but at a much lower magnitude (KS test <1 kb vs >4 kb *P = 2.00 × 1011 d = 0.1470). d The Fmr1−/y CA1-TRAP population shows a similar CDS length bias that can be seen in a binned analysis or a comparison of the top 500 most up- and downregulated mRNAs ranked by log2 fold change (two-sided KS test <1 kb vs >4 kb *P < 2.2 × 1016, two-sample z test all vs up z = −3.416, *P = 0.0006356, all vs down z = 5.0454, *P = 4.525 × 107). e The Fmr1−/y proteome exhibits a CDS length-dependent imbalance that mirrors the results seen by TRAP, both in a binned analysis (two-sided KS test <1 kb vs >4 kb *P = 2.84 × 106) and comparison between the 200 most up- and downregulated proteins (two-sample z test, up vs all: z = −2.8216 *P = 0.005, down vs all: z = 3.0408, *P = 0.0024). f A Gene set analysis ranked by CDS length reveals that shorter transcripts are enriched with the ribosome and mitochondrial genes whereas longer transcripts are enriched with synaptic structure-related genes. g GSEA of the Fmr1−/y proteome shows a significant downregulation of synaptic gene sets and a significant upregulation of ribosome/mitochondrial gene sets. h SFARI targets are downregulated in the Fmr1−/y SNAP-TRAP population (two-sample z test, z = −5.43 P = 5.65 × 108) and not changed in the total RNA population (two-sample z test, z = −1.64, P = 0.099). SFARI targets are significantly underexpressed in the Fmr1−/y proteome, consistent with the under-translation seen by TRAP (two-sample z test, z = −2.0008, *P = 0.045). i FMRP targets are significantly downregulated in the Fmr1−/y SNAP-TRAP population (two-sample z test, z = −12.461 *P < 2.2 × 1016) and changed to a lesser degree in total RNA population (two-sample z test, z = −5.42, P = 5.805 × 108). FMRP targets are significantly reduced in the Fmr1−/y proteome (two-sample z test, z =  5.30, *P = 1.135 × 107).
Fig. 5
Fig. 5. Translation of long mRNAs is reduced in CA1 pyr neurons with induction of mGluR-LTD.
a Our model predicts that the increased ribosome production seen with mGluR-LTD will cause a similar length-dependent imbalance as seen in the Fmr1−/y translating population. b Analysis of the significantly changed population in WT DHPG CA1-TRAP shows a significant imbalance in transcript length, CDS length, 5’UTR length, and 3’UTR length that matches the basal Fmr1−/y CA1-TRAP population (transcript length: Kruskal–Wallis P = 2.105 × 1014, Wilcoxon rank-sum test all vs up P = 6.042 × 105, all vs down P = 1.022 × 1011, CDS length: Kruskal–Wallis *P < 2.2 × 1016, Wilcoxon rank-sum test all vs up *P < 2.2 × 1016, all vs down *P < 2.2 × 1016, 5’UTR length: Kruskal–Wallis *P = 0.0005, Wilcoxon rank-sum test all vs up P = 0.0808, all vs down *P = 0.0006, 3’UTR length: Kruskal–Wallis *P = 0.000, Wilcoxon rank-sum test all vs up *P = 0.03821, all vs down *P = 0.0002, coding GC content: Kruskal–Wallis P = 0.9375). c A binned analysis shows that there is a CDS length shift in the TRAP fraction (two-sided KS test <1 kb vs >4 kb *P < 2.2 × 1016) and no change in the total transcriptome (two-sided KS test <1 kb vs >4 kb P = 0.698). d Comparison of the top and bottom 500 differentially expressed transcripts in WT DHPG shows a significant effect of length (all vs up z = −17.831, *P < 2.2 × 1016, all vs down z = 10.774, *P < 2.2 × 1016). Comparison between WT DHPG vs Fmr1−/y DHPG reveals that the length shift is occluded in Fmr1−/y (all vs up z = 5.2982, *P = 1.16 × 107, all vs down z = −2.2827, *P = 0.02). e As predicted by their longer lengths, FMRP targets are reduced with DHPG in the WT CA1-TRAP population (two-sample z test, z = 5.333, P = 9.66 × 108). This change is not seen in the total transcriptome (two-sample z test, z = −2.039, P = 0.041). f Network analysis of the downregulated GO terms reveals a concentration of synaptic components and ion-channel clusters. g Analysis of the population significantly downregulated in both WT DHPG and Fmr1−/y CA1-TRAP fractions (P < 0.05) identifies 42 transcripts, many of which are involved in synaptic function.
Fig. 6
Fig. 6. Inhibition of RP translation prevents reduction of long mRNA translation during mGluR-LTD.
a Our model predicts that preventing the increase in RP translation downstream of mGlu1/5 activation should prevent the length-dependent shift in translation. The experimental timeline for CX + DHPG CA1-TRAP-seq experiment is shown. b Incubation with CX-5461 blocks the increase in RP translation seen with DHPG stimulation in the WT CA1-TRAP population (RP: two-sample z test, z = 0.79134, P = 0.428741). CX-5461 causes a slight reduction in RP translation with DHPG in Fmr1−/y CA1-TRAP (RP: two-sample z test, z = −4.30, *P = 1.69 × 105). c The length-dependent shift in translation seen with DHPG in WT is eliminated with incubation of CX-5461 (Top 500: two-sample z test, All vs up z = 0.2897, P = 0.77200, all vs down z = 0.10510, P = 0.916292). A slight reversal of the length-dependent imbalance evoked by DHPG is also seen in the Fmr1−/y CA1-TRAP (top 500: two-sample z test, All vs Up z = 3.1899, *P =  0.0014, all vs down z = −2.282, *P = 0.022). d LTD transcripts were defined as significantly regulated the first in WT DHPG TRAP-Seq dataset. Incubation with CX-5461 eliminates the up- and downregulation of LTD transcripts with DHPG application in WT (two-sample z test, LTD up: z = 1.619, P = 0.1054, LTD down: z = −0.9977, P = 0.3184). Application of CX-5461 has no impact on the response of LTD transcripts to DHPG in the Fmr1−/y CA1-TRAP (two-sample z test up z = 1.838, P = 0.0659; down z = 1.694, P = 0.0901). e A heatmap of log2 fold change shows the significant impact of CX-5461 on the 30 most up- and downregulated LTD transcripts in WT and Fmr1−/y CA1-TRAP. The preserved upregulation of immediate early genes Npas4 and Arc is highlighted. f Gene sets significantly downregulated with LTD in WT are no longer downregulated with CX-5461 in either genotype. Z tests of the distribution of LTD downregulated gene sets show that significant downregulation in vehicle-treated WT (two-sample z test, z = −18.24, *P < 2.2 × 1016) is no longer changed after incubation with CX-5461 (two-sample z test, WT CXDHPG: z = −0.15442, P = 0.8773), In the Fmr1−/y CA1-TRAP, CX-5461 causes a slight upregulation of these gene sets, indicating a reversal in the translation regulation of these mRNAs (two-sample z test, z = 4.4808, *P = 7.435 × 106). g Our results fit a model whereby activation of mGlu1/5 causes an increase in ribosome production that drives an imbalance in the translation of short versus long mRNAs. This imbalance is similarly driven by the loss of FMRP, which increases ribosome production and mimics the LTD translation state. Ultimately, the reduced translation of long mRNAs reduces the expression of proteins that participate in synaptic stability and function. h We propose that the altered translation imbalance driven by excessive ribosome production may underlie a number of phenotypes in FX that are derived from synaptic weakening or instability.

References

    1. Kelleher RJ, 3rd, Bear MF. The autistic neuron: troubled translation? Cell. 2008;135:401–406. doi: 10.1016/j.cell.2008.10.017. - DOI - PubMed
    1. Louros, S. R. & Osterweil, E. K. Perturbed proteostasis in autism spectrum disorders. J. Neurochem. 10.1111/jnc.13723 (2016). - PMC - PubMed
    1. Darnell JC, et al. FMRP stalls ribosomal translocation on mRNAs linked to synaptic function and autism. Cell. 2011;146:247–261. doi: 10.1016/j.cell.2011.06.013. - DOI - PMC - PubMed
    1. Osterweil EK, Krueger DD, Reinhold K, Bear MF. Hypersensitivity to mGluR5 and ERK1/2 leads to excessive protein synthesis in the hippocampus of a mouse model of fragile X syndrome. J. Neurosci. 2010;30:15616–15627. doi: 10.1523/JNEUROSCI.3888-10.2010. - DOI - PMC - PubMed
    1. Qin M, Kang J, Burlin TV, Jiang C, Smith CB. Postadolescent changes in regional cerebral protein synthesis: an in vivo study in the FMR1 null mouse. J. Neurosci. 2005;25:5087–5095. doi: 10.1523/JNEUROSCI.0093-05.2005. - DOI - PMC - PubMed

Publication types

MeSH terms

Substances