. 2022 Jun 10;13(1):3348.
doi: 10.1038/s41467-022-30493-3.

Embryo-scale epithelial buckling forms a propagating furrow that initiates gastrulation

Affiliations

Embryo-scale epithelial buckling forms a propagating furrow that initiates gastrulation

Julien Fierling et al. Nat Commun. .

Abstract

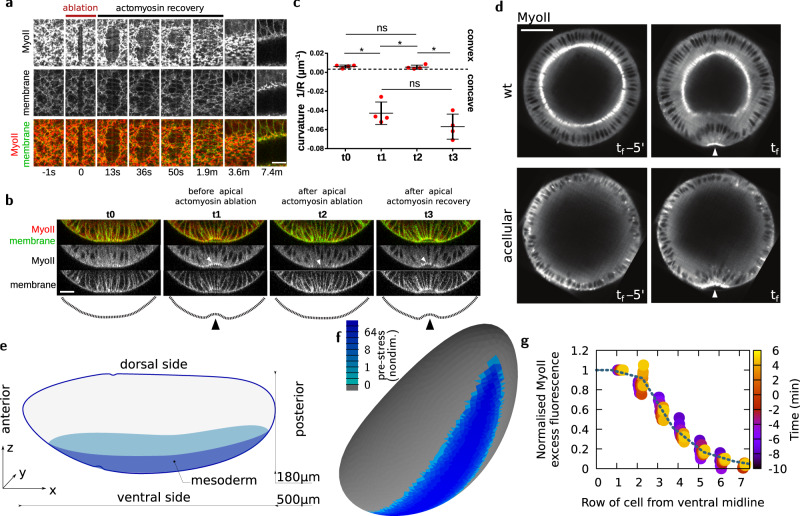
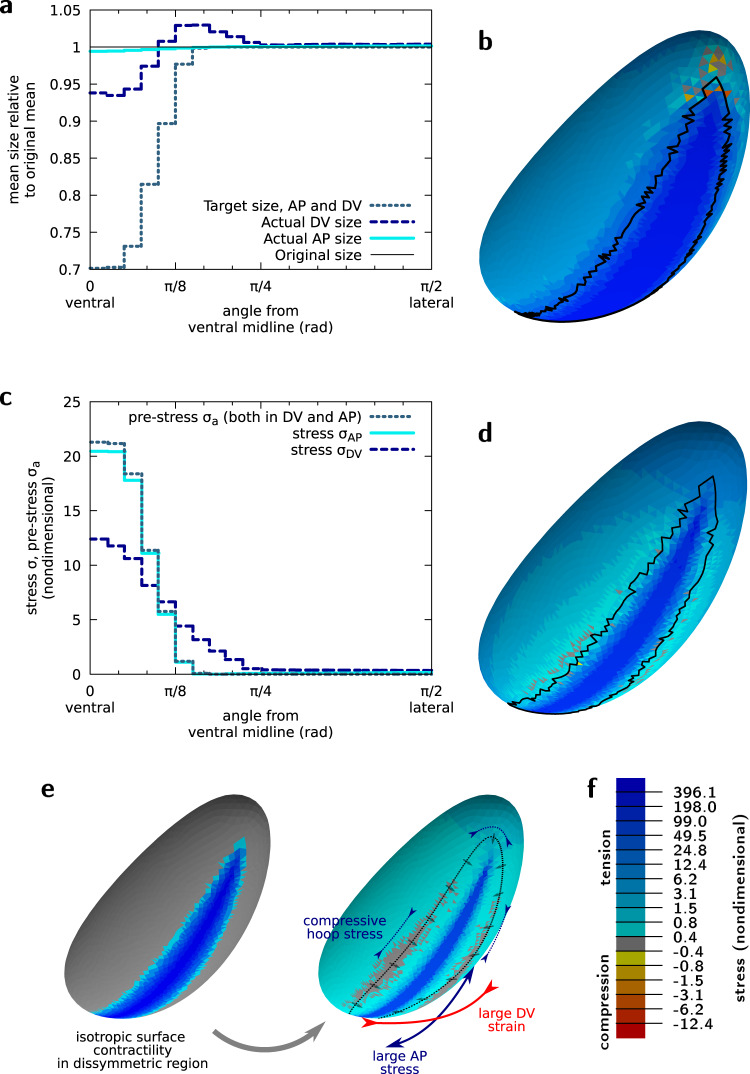
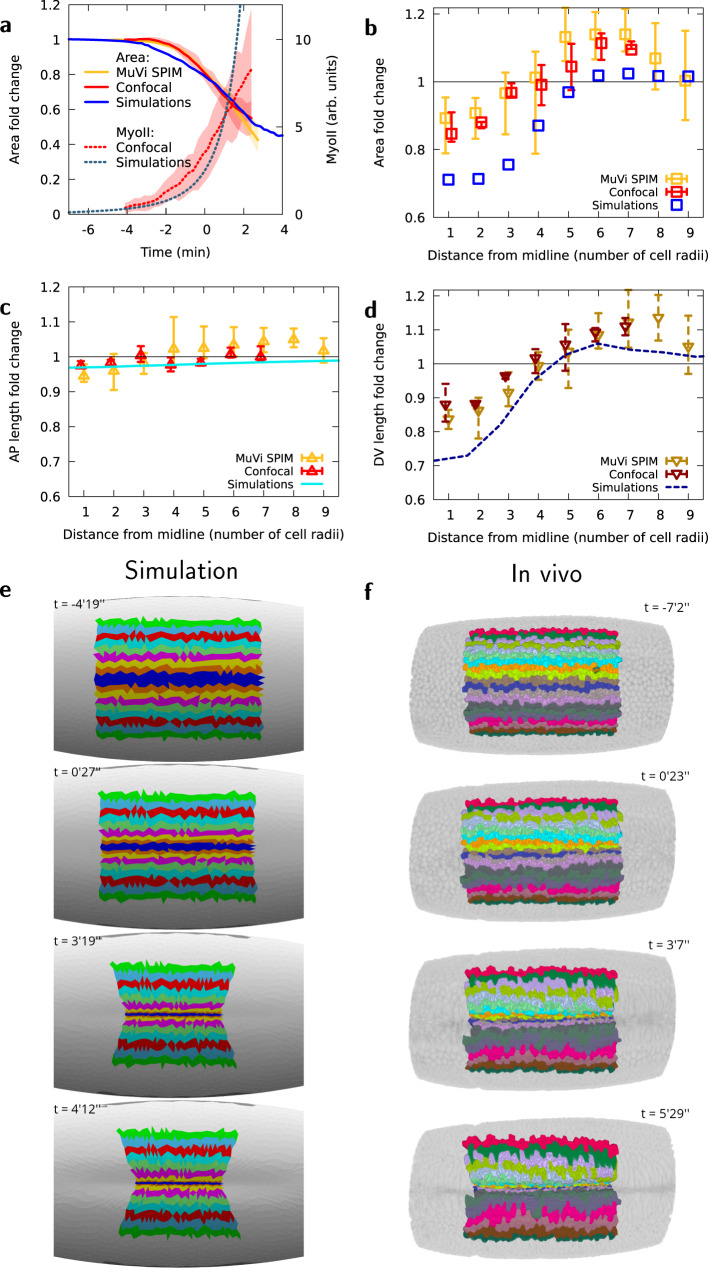
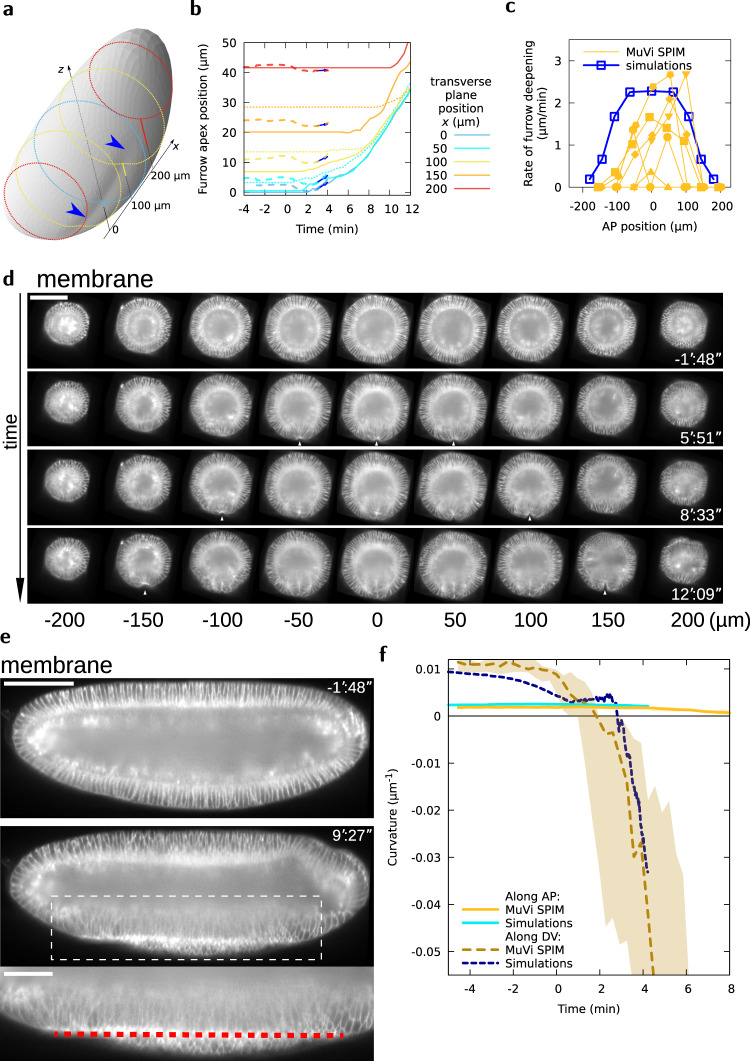
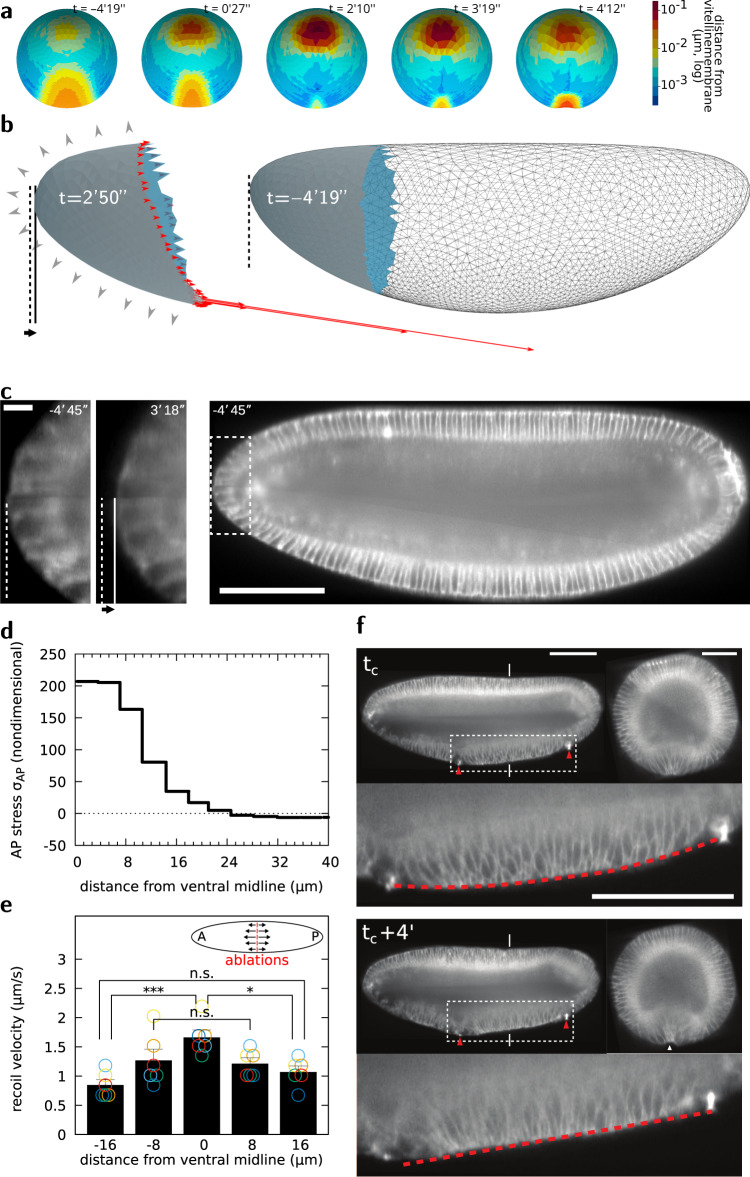
Cell apical constriction driven by actomyosin contraction forces is a conserved mechanism during tissue folding in embryo development. While much is now understood of the molecular mechanism responsible for apical constriction and of the tissue-scale integration of the ensuing in-plane deformations, it is still not clear if apical actomyosin contraction forces are necessary or sufficient per se to drive tissue folding. To tackle this question, we use the Drosophila embryo model system that forms a furrow on the ventral side, initiating mesoderm internalization. Past computational models support the idea that cell apical contraction forces may not be sufficient and that active or passive cell apico-basal forces may be necessary to drive cell wedging leading to tissue furrowing. By using 3D computational modelling and in toto embryo image analysis and manipulation, we now challenge this idea and show that embryo-scale force balance at the tissue surface, rather than cell-autonomous shape changes, is necessary and sufficient to drive a buckling of the epithelial surface forming a furrow which propagates and initiates embryo gastrulation.


Conflict of interest statement

The authors declare no competing interests.

Figures

Fig. 1
Fig. 1. Using IR fs laser ablation to demonstrate the necessity and building of a model to test the sufficiency of apical contraction to drive VFF.
a Recoil and recovery of the ventral apical actomyosin network after laser ablation. The ablation is performed along the DV axis across the ventral tissue. MyoII is depleted along the ablated region while membrane signal density eventually decreases as a consequence of cell dilation. Panel shows representative experiment. Experiment repeated 5 times on 5 different embryos. Scale bar 10 μm. b Cross-sectional view of the embryo ventral side just before (t0 and t1) and just after (t2) laser ablation, and (t3) after actomyosin recovery. Time between t0 and t3 is 3 min. Laser ablations were performed similarly as in (a). Panel shows representative experiment. Experiment repeated 4 times on 4 different embryos. Scale bar 20 μm. c Curvature analysis before and after laser ablation and during actomyosin network recovery as shown in (b). n = 4 embryos, data are presented as mean values ± standard deviation. The statistical test performed was Kruskal–Wallis test for multiple comparisons, *p ≤ 0.05 and ns (non-significant), p > 0.05. d Digital mid-cross-sections before and during furrow formation in wild-type and slamdunk acellular embryos. Panel shows representative case, n = 4 embryos. Scale bar 50 μm. e Representation of the embryo geometry with the mesoderm region highlighted. f Finite element mesh of an embryo-shaped elastic surface where some facets will be pre-strained to mimic MyoII activity (colour code, log scale, nondim. nondimensional units). g Circles, MyoII profile at different phases of VFF as a function of distance from the ventral midline, normalized using the intensity of cells at midline (row 0, see the “Methods” section), in experiments (average of n = 3 embryos, confocal microscopy). Line, pre-stress profile chosen for simulations. This profile is also similar to the one reported by ref. .
Fig. 2
Fig. 2. Actomyosin contractility drives tension anisotropy on the ventral side of the embryo.
a Strain angular profile (current size relative to initial size) along the AP and DV axes for midline pre-strain εam=0.43. b Mechanical stress (sum of the two principal stresses) resulting from the area pre-strain. Midline pre-strain εam=0.43. Black line corresponds to the boundary of the pre-strained region in the current configuration. See tensor components in Supplementary Fig. 1b. c Angular profiles of the pre-stress σa and of the two principal stresses along the AP and DV axes for εam=0.43. d Same as (b) for εam=5.25. See tensor components in Supplementary Fig. 1d and profiles in Supplementary Fig. 1e, f. e Isotropic pre-strain pattern (left) yields anisotropic mechanical response, with a greater stress and strain along the AP and DV axes, respectively. The cells at the periphery of the mesoderm move towards it, arrows, which generates a hoop stress along the dotted line. f Colour code for panels (b) and (d). All panels are for nondimensional mechanical parameters χ~2D=50 and ν2D = 0, see Supplementary Information.
Fig. 3
Fig. 3. In vivo apical area changes are reproduced by the computational model.
a MyoII average intensity and mesoderm apical area changes as a function of time, for in vivo analysis and simulations, averaged over all cells within five rows of the ventral midline. b Apical area fold-change relative to the initial area (t = −4 min) of cells at different lateral distances from the midline at t = −1 min, in observations for in vivo analysis and simulations. (c) Apical AP size fold-change relative to the initial size (t = −4 min) of cells at different lateral distances from the midline at t = −1 min, d Apical DV size fold-change relative to the initial size (t = − 4 min) of cells at different lateral distances from the midline at t = −1 min, for in vivo analysis and simulations. Panels (ad), n = 3 embryos using multi-view light sheet and n = 3 embryos using confocal microscopy, shaded areas in (a) and error bars in (bd), minimum and maximum values among the corresponding embryos. e, f Time evolution of AP stripes of apical surface in simulation and MuVi SPIM, respectively.
Fig. 4
Fig. 4. VFF results from tissue curvature changes along the DV and AP axes.
a Embryo shape during VFF in simulations at t=412. Shading reveals furrow shape, blue arrowheads. Dotted lines are transverse cuts, solid lines give the furrow apex offset from a reference z position at different x positions. b Furrow apex position at different AP positions as a function of time in MuVi SPIM experiments (solid lines, posterior side, dotted lines, anterior side, n = 6) and simulations (dashed lines and arrow showing slope at t=3). c Rate of furrow formation at different AP positions at t=3. d Digital cross-sections at different AP positions. White arrowheads indicate VFF initiation. Scale bar 100 μm. e Digital mid-sagittal section of the embryo. Red line indicates ventral tissue flattening. Scale bars 100 μm, zoom 50 μm. f Curvature of the ventral tissue along the AP and DV axes as a function of time (MuVi SPIM, n = 6 embryos, shaded area denotes minimum and maximum).
Fig. 5
Fig. 5. Embryo poles function as anchoring sites for ventral midline flattening and furrow formation.
a Distance map of the apical surface to the vitelline membrane at different phases of VFF. b Forces exerted on the poles by the rest of the tissue (red arrows), and pressure forces exerted by the incompressible cytoplasms (grey arrowheads), pole tissue deformation (compare shape of solid-filled regions) and displacement of the pole (solid and dashed lines) in simulations. c Digital mid-sagittal section showing inward displacement of the pole tissue during VFF. Scale bar 100 μm, zoom 5 μm. d Tension distribution at different DV positions from the ventral midline in simulations at t=030. e Recoil velocity distribution after DV-oriented IR fs laser ablation at different DV positions from the ventral midline. n = 6 embryos, data are presented as mean values ± standard deviation; the statistical test performed was Kruskal–Wallis test for multiple comparisons, *p ≤ 0.05; ***p ≤ 0.001 and n.s. (not significant), p > 0.05. f Digital mid-sagittal and cross sections of an embryo on which two cauterizations (red arrowheads), acting as fixed points, have been performed at the ventral side (tc indicates time of cauterization). The red line indicates tissue straightening along the embryo mid-sagittal section in between the two cauterized regions. Experiment performed and result reproduced 3 times. Scale bar sagittal view 100 μm. Scale bar cross-section 50 μm.

References

    1. Butler LC, et al. Cell shape changes indicate a role for extrinsic tensile forces in Drosophila germ-band extension. Nat. Cell Biol. 2009;11:859864. doi: 10.1038/ncb1894. - DOI - PubMed
    1. Collinet C, Rauzi M, Lenne P-F, Lecuit T. Local and tissue-scale forces drive oriented junction growth during tissue extension. Nat. Cell Biol. 2015;17:12471258. doi: 10.1038/ncb3226. - DOI - PubMed
    1. Lye CM, et al. Mechanical coupling between endoderm invagination and axis extension in Drosophila. PLoS Biol. 2015;13:e1002292. doi: 10.1371/journal.pbio.1002292. - DOI - PMC - PubMed
    1. Rauzi M, et al. Embryo-scale tissue mechanics during Drosophila gastrulation movements. Nat. Commun. 2015;6:8677. doi: 10.1038/ncomms9677. - DOI - PMC - PubMed
    1. Dicko M, et al. Geometry can provide long-range mechanical guidance for embryogenesis. PLoS Comput. Biol. 2017;13:e1005443. doi: 10.1371/journal.pcbi.1005443. - DOI - PMC - PubMed

Publication types

LinkOut - more resources