. 2022 Jun 10;12(1):9605.
doi: 10.1038/s41598-022-13724-x.

Cell type specific cannabinoid CB1 receptor distribution across the human and non-human primate cortex

Affiliations

Cell type specific cannabinoid CB1 receptor distribution across the human and non-human primate cortex

Shinnyi Chou et al. Sci Rep. .

Abstract

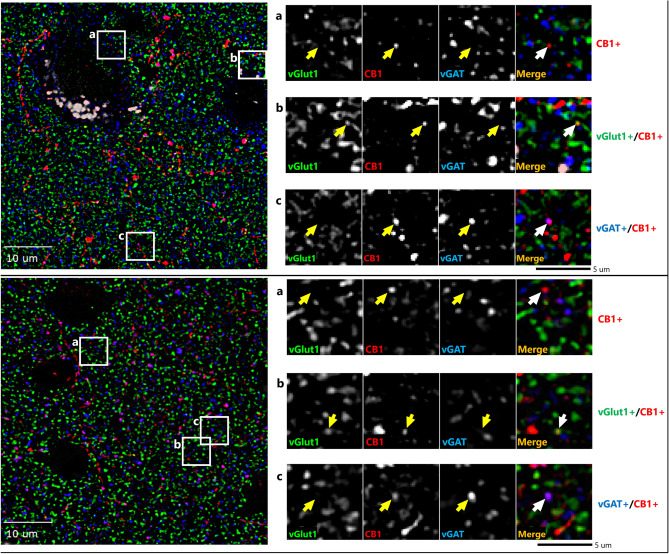
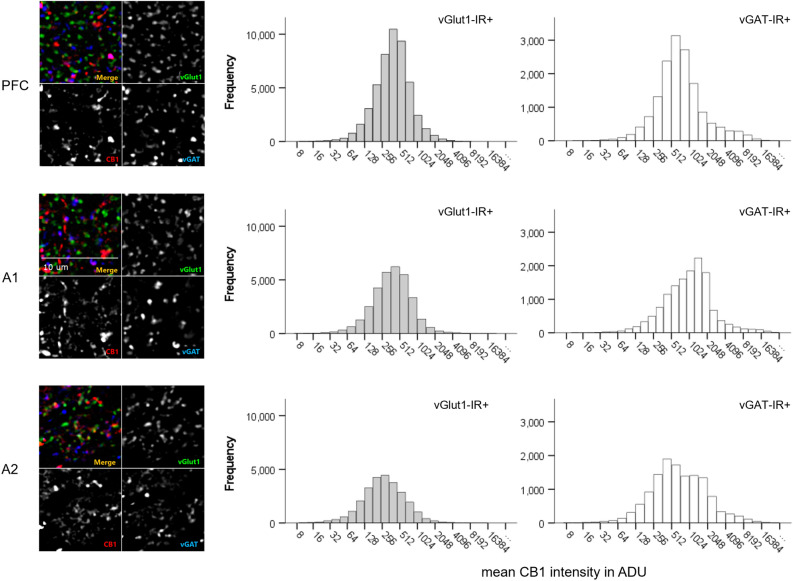
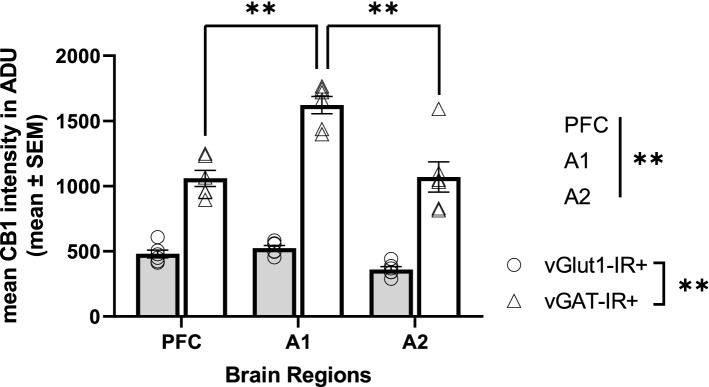
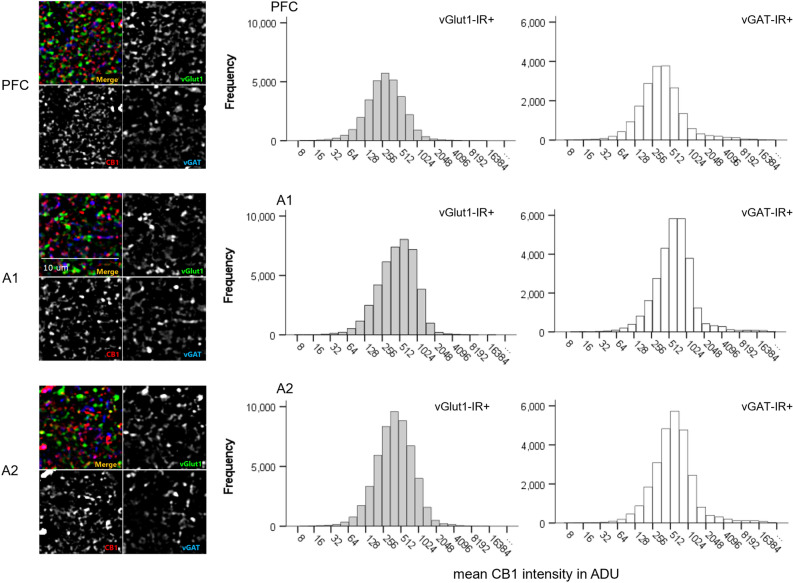
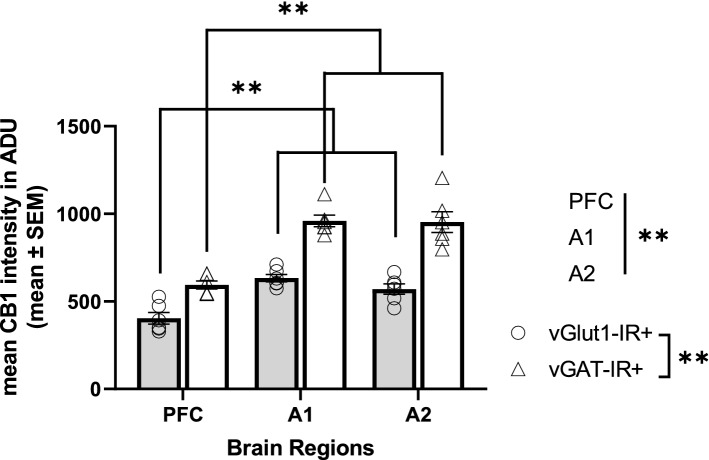
Alterations in cannabinoid CB1 receptor (CB1R) are implicated in various psychiatric disorders. CB1R participates in both depolarization induced suppression of inhibition (DSI) and depolarization induced suppression of excitation (DSE), suggesting its involvement in regulating excitatory and inhibitory (E/I) balance. Prior studies examining neuronal cell type specific CB1R distribution have been conducted near exclusively within rodents. Identification of these distribution patterns within the human and non-human primate cortex is essential to increase our insight into its function. Using co-labeling immunohistochemistry and fluorescent microscopy, we examined CB1R protein levels within excitatory and inhibitory boutons of male human and non-human primate prefrontal cortex and auditory cortices, regions involved in the behavioral effects of exogenous cannabinoid exposures. We found that CB1R was present in both bouton populations within all brain regions examined in both species. Significantly higher CB1R levels were found within inhibitory than within excitatory boutons across all regions in both species, although the cell type by brain region interactions differed between the two species. Our results support the importance of conducting more in-depth CB1R examinations to understand how cell type and brain region dependent differences contribute to regional E/I balance regulation, and how aberrations in CB1R distribution may contribute to pathology.


Conflict of interest statement

The authors declare no competing interests.

Figures

Figure 1
Figure 1
Sample micrograph of immunohistochemical staining in both human (top) and monkey (bottom) cortex. Left panels: Puncta with vGlut1 + (green), vGAT + (blue) & CB1R + (red) immunoreactivity are distributed throughout the image field. Right panels: Enlarged images with arrows identifying puncta with antibody immunoreactivity toward a single or multiple proteins.
Figure 2
Figure 2
Mean CB1R intensity frequency histograms for excitatory (vGlut1-IR +) and inhibitory (vGAT-IR +) cell types across three brain regions of the monkey cortex, measured in analogue-to-digital units (ADU). PFC = prefrontal cortex, A1 = primary auditory cortex, A2 = association auditory cortex. Scale bar can be seen in the sample image for A1.
Figure 3
Figure 3
Mean CB1R intensity within excitatory (vGlut1-IR +) and inhibitory (vGAT-IR +) cell types across three brain regions of the monkey cortex. Each individual data point represents mean intensity averaged across all sampled sites across a cortical layer. There was a main effect of cell type, p < 0.001, main effect of brain region, p < 0.001, and a significant cell type × brain region interaction, p < 0.001. While there were no differences in mean CB1R intensity within excitatory populations across brain regions, post hoc analysis indicated mean CB1R intensity within inhibitory populations was highest in the primary auditory cortex, followed by the association auditory cortex, with lowest mean CB1R intensity within inhibitory populations in the PFC, p < 0.001. Straight lines indicate main effects across groups. Brackets indicate post hoc pairwise comparisons. **p < 0.001. Error bar denotes SEM. PFC = prefrontal cortex, A1 = primary auditory cortex, A2 = association auditory cortex.
Figure 4
Figure 4
Mean CB1R intensity frequency histograms for excitatory (vGlut1-IR +) and inhibitory (vGAT-IR +) cell types across three brain regions of the human cortex, measured in analogue-to-digital units (ADU). PFC = prefrontal cortex, A1 = primary auditory cortex, A2 = association auditory cortex. Scale bar can be seen in the sample image for A1.
Figure 5
Figure 5
Mean CB1R intensity within excitatory (vGlut1-IR +) and inhibitory (vGAT1-IR +) cell types across three brain regions of the postmortem human cortex. Each individual data point represents mean intensity averaged across all sampled sites across a cortical layer. There was a main effect of cell type, p < 0.001, main effect of brain region, p < 0.001, and a significant cell type × brain region interaction, p < 0.001. Post hoc analysis indicated significantly lower mean CB1R intensity within the PFC for both excitatory and inhibitory populations compared to the primary and association auditory cortex, p < 0.001 for all comparisons. Straight lines indicate main effects across groups. Brackets indicate post hoc pairwise comparisons. **p < 0.001. Error bar denotes SEM. PFC = prefrontal cortex, A1 = primary auditory cortex, A2 = association auditory cortex.

References

    1. Hasin DS. US epidemiology of cannabis use and associated problems. Neuropsychopharmacology. 2018;43:195–212. doi: 10.1038/npp.2017.198. - DOI - PMC - PubMed
    1. Bhatia D, Hinckley J, Mikulich S, Sakai J. Cannabis legalization and adolescent use of electronic vapor products, cannabis, and cigarettes. J. Addict. Med. 2022;16:E16–E22. doi: 10.1097/ADM.0000000000000831. - DOI - PMC - PubMed
    1. Stinson FS, Ruan WJ, Pickering R, Grant BF. Cannabis use disorders in the USA: Prevalence, correlates and co-morbidity. Psychol. Med. 2006;36:1447–1460. doi: 10.1017/S0033291706008361. - DOI - PubMed
    1. Stilo, S. A. & Murray, R. M. Non-Genetic Factors in Schizophrenia. Curr. Psychiatry Rep.21, (2019). - PMC - PubMed
    1. Shrivastava A, Johnston M, Terpstra K, Bureau Y. Cannabis and psychosis: Neurobiology. Indian J. Psychiatry. 2014;56:8. doi: 10.4103/0019-5545.124708. - DOI - PMC - PubMed

Publication types