. 2022 Jun 10;13(1):3358.
doi: 10.1038/s41467-022-31038-4.

Factors shaping the abundance and diversity of the gut archaeome across the animal kingdom

Affiliations

Factors shaping the abundance and diversity of the gut archaeome across the animal kingdom

Courtney M Thomas et al. Nat Commun. .

Abstract

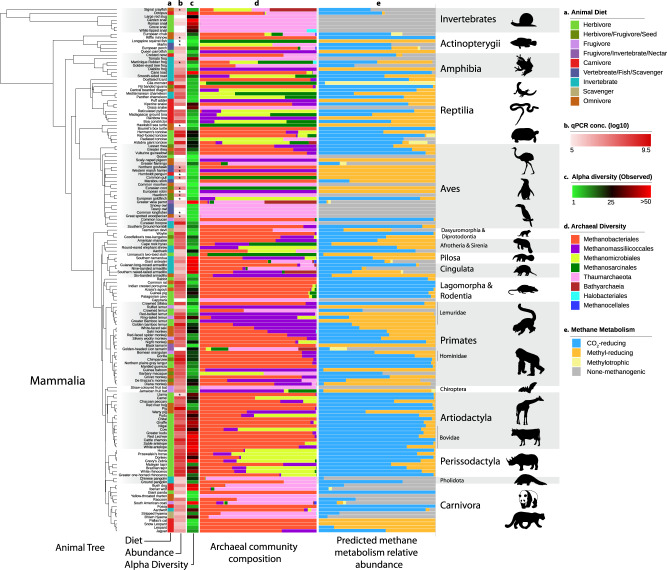
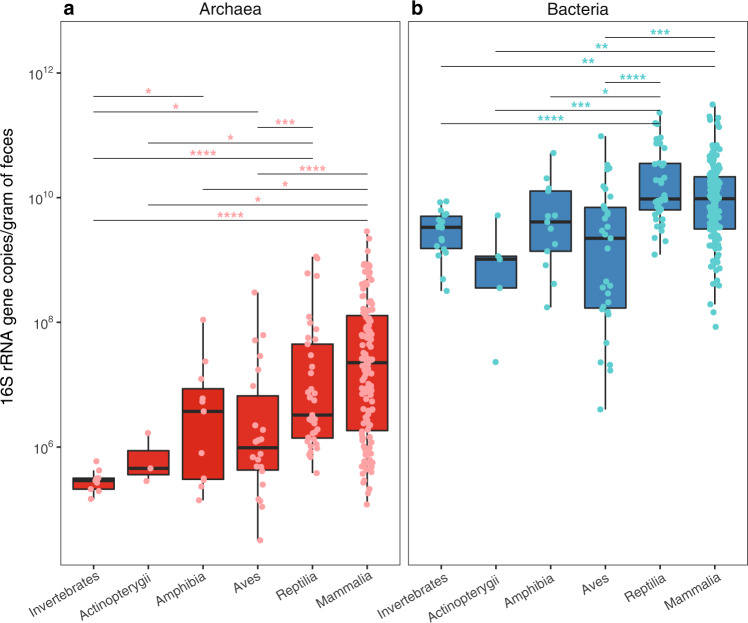
Archaea are common constituents of the gut microbiome of humans, ruminants, and termites but little is known about their diversity and abundance in other animals. Here, we analyse sequencing and quantification data of archaeal and bacterial 16S rRNA genes from 250 species of animals covering a large taxonomic spectrum. We detect the presence of archaea in 175 animal species belonging to invertebrates, fish, amphibians, birds, reptiles and mammals. We identify five dominant gut lineages, corresponding to Methanobrevibacter, Methanosphaera, Methanocorpusculum, Methanimicrococcus and "Ca. Methanomethylophilaceae". Some archaeal clades, notably within Methanobrevibacter, are associated to certain hosts, suggesting specific adaptations. The non-methanogenic lineage Nitrososphaeraceae (Thaumarchaeota) is frequently present in animal samples, although at low abundance, but may have also adapted to the gut environment. Host phylogeny, diet type, fibre content, and intestinal tract physiology are major drivers of the diversity and abundance of the archaeome in mammals. The overall abundance of archaea is more influenced by these factors than that of bacteria. Methanogens reducing methyl-compounds with H2 can represent an important fraction of the overall methanogens in many animals. Together with CO2-reducing methanogens, they are influenced by diet and composition of gut bacteria. Our results provide key elements toward our understanding of the ecology of archaea in the gut, an emerging and important field of investigation.


Conflict of interest statement

The authors declare no competing interests.

Figures

Fig. 1
Fig. 1. Detection of archaea in animal species with different approaches.
a Presence/absence using qPCR with archaea-specific primers, sequencing with archaea-specific primers and sequencing with prokaryotic universal primers. Invertebrates gather 3 classes (Insecta, Mollusca, and Malacostraca). b Comparison of the number of archaeal ASV in sequencing data using archaea-specific and prokaryotic universal primers (n = 218 animal species). In the boxplots, the minima is minimum value, maxima is maximum value, center is median and quartiles are shown by box and whiskers, with individual animals shown as colored dots. In total, archaea-specific sequencing identified 1307 different archaeal ASVs while prokaryotic universal sequencing only identified 140 different archaeal ASVs.
Fig. 2
Fig. 2. Main archaeal lineages in the gut and proposed independent events of adaptation to the gut in the domain Archaea.
a Distribution of archaeal 16S rRNA gene sequences in the gut and other environments based on sequences obtained from the Silva database and this study. The archaeal tree is based on Borrel et al. enriched with DPANN lineages. Large arrows on the tree indicate five main events of adaptation to the gut environment, small arrows indicate four other possible events of adaptation to the gut. Fully orange triangles indicate that gut adaptation likely occurred at the base of the lineage while blue triangles with an orange spot indicate that gut adaptation occurred within the lineage. The histogram shows the proportion of sequences (from the Silva database) of a given lineage present in either animal digestive tract (“Gut”, orange), open natural environment (“Environment”, blue) or built environment (“Engineered”, grey). Orange circle surface area represents the percentage of reads attributed to each taxon in our study (gut-related samples only). b Proportion of archaea corresponding to the dominant methanogen lineages (green), Nitrososphaeraceae (purple) and rarest taxa (light blue) in samples, based on amplicon sequencing (Miseq) with archaea-specific primers, according to absolute abundance of archaea in the sample (qPCR). Dots indicate the relative abundance of these three groups of archaea in each sample. Coloured lines indicate the moving averages of the relative abundance of these three groups on a subset size of 25 samples. The dominant methanogen lineages category contains Methanobrevibacter, Methanosphaera, “Ca. Methanomethylophilaceae”, Methanocorpusculum, Methanimicrococcus. The rarest taxa category contains Methanobacterium, Methanothermobacter, Methanomassiliicoccaceae, Methanosarcina, Methanoregulaceae, Methanospirillaceae, Methanosaeta, Methanocellales, Nitrosopumilaceae, Nitrosotaleaceae, Bathyarchaeota, Halobacteriales. c Correlation between the absolute abundance (16S rRNA copies/gram of faeces) of archaea and bacteria (black), summed methanogen lineages (Methanobacteriales, Methanomassiliicoccales, Methanomicrobiales, Methanimicrococcus; green) and Thaumarchaeota (purple), all determined by qPCR using lineage-specific primers. Same samples (n = 176) are plotted in panels b) and c) and correspond to those with amplified archaea in deep sequencing (Miseq). The scale of the absolute abundance of archaea is the same than in b, c. d Phylogenetic position of dominant gut Thaumarchaeota (this study, ASV4, ASV20 and ASV21, purple, bold) and dominant soil archaea (DSC1 and DSC2, brown, bold). ASV4/ASV20 are practically identical to DSC2 representative sequence (only 1 indel in a 4/5Gs homopolymer region, which may be due to a 454-sequencing error in DSC2). ASV21 shares 99.2% identity with the DSC1 representative sequence.
Fig. 3
Fig. 3. Archaeal abundance and diversity in the animal gut (n = 150; species with ≥3000 archaeal reads).
a Information on animal primary diet gathered using the Elton Trait database, the Animal Diversity Website database, or from specialists who provided faecal samples. Primary diet was considered food material that made up ≥70% of the animal’s diet. b Absolute abundance of archaea as determined by qPCR with archaea-targeting primers on a log scale. Stars (*) indicate species for which the abundance may be underestimated (see Supplementary Fig. 19). c Observed richness (number of different ASV) of archaea. d Taxonomic diversity of archaea in the animal intestinal microbiome. Samples were rarefied to 3000 archaeal reads. e) Proportion of CO2-reducing, methyl-reducing and methylotrophic methanogens, as well as non-methanogens in the archaeal community (see Supplementary Table 2 for assignation of metabolisms to taxa). The Animal Tree was generated using Timetree.org.
Fig. 4
Fig. 4. Distribution of Methanobacteriales ASVs among mammal species.
The phylogenetic tree (maximum-likelihood, GTR + G4) of Methanobacteriales was built with nearly full length 16S rRNA genes sequences from literature and the ASVs sequences from this study. For display purposes, the shown tree includes only the ASVs representing more than 1% of the sequences per sample, and no sequence from literature. Presence/absence of ASVs in animals is indicated by coloured highlighted/blank squares. Animal were gathered by mammalian orders, each with a different colour, as indicated on the top. Black boxes highlight archaeal clades preferentially present in a given host order, except for the Insect+insectivores clade composed of archaea preferentially present in insectivorous animals from different mammalian orders and insects (mostly termites, sequences from the literature). Clades corresponding to the boxes are labelled with thick lines on the phylogenetic tree. Species names in front of the tree indicate the position of cultured representatives of the Methanobacteriales. The percentages on the right indicate the proportion of reads from Methanobacteriales that were annotated as Methanobrevibacter (orange background), Methanosphaera (yellow background), Methanobacterium (blue background) and Methanothermobacter (pink background).
Fig. 5
Fig. 5. Absolute abundance of a) Archaea (n = 221, red) and b) Bacteria (n = 255, blue) determined by qPCR.
Animal lineages with significantly different archaeal/bacterial abundances are labeled. Two-sided Wilcoxon rank sum, *p ≤ 0.05; **p ≤ 0.01; ***p ≤ 0.001; ****p ≤ 0.0001. In the boxplots, the minima is minimum value, maxima is maximum value, center is median and quartiles are shown by box and whiskers, with individual animals shown as colored dots. Exact p-values are given in Supplementary Data 4.
Fig. 6
Fig. 6. Influence of host diet type, diet-fibre content, and mean retention time on the absolute abundance of total methanogens.
a Abundance of total methanogens (n = 139) in animals grouped by diet type. The abundance of methanogens is the sum of individual quantifications of Methanobacteriales, Methanomicrobiales, Methanomassiliicoccales and Methanimicrococcus 16S rRNA genes. Two-sided Wilcoxon rank sum test with continuity correction was used to determine differences between diet types, *p ≤ 0.05; **p ≤ 0.01; ***p ≤ 0.001; ****p < 0.0001. Significant differences across all groups were determined via the Kruskal-Wallis test, with p < 0.05 set as significant. Correlation between diet-fibre content and (b) absolute abundance of methanogens in mammal species (n = 65) and (c) in primates (n = 12). d Correlation between digesta mean retention time and averaged absolute abundance of methanogens in primates (n = 22). A two-sided, squared Pearson correlation coefficient was computed to assess the relationship between values, unadjusted p-values < 0.05 were considered significant. Grey bands around the lines (panels bd) represent the 95% confidence interval around the linear regression model. Statistical analyses and representation of the absolute/relative abundance of methanogens were carried out on species where archaea have been detected. Exact p-values of panel (a) are given in Supplementary Data 4.
Fig. 7
Fig. 7. Main methanogenesis pathways in the animal gut.
a Proportion of the total archaeal reads that are assigned to taxa with a predicted hydrogenotrophic CO2-reducing methanogenesis (H2 + CO2; blue) or hydrogenotrophic methyl-reducing methanogenesis (CH3-R + H2; orange) pathway. Methanosarcina spp. can have diverse methanogenesis pathways (i.e., the two above-mentioned pathways and the methyl-dismutation (or methylotrophic) and acetoclastic pathways). b Diagram indicating the methanogenesis pathways with the highest energy yield depending on methanol concentration (C(methanol) in mol/l) and hydrogen partial pressure (p(H2) in bar). The three methanogenesis pathways considered are methyl-compound dismutation (CH3-R dismut.), hydrogenotrophic methyl-reducing methanogenesis (CH3-R + H2) or hydrogenotrophic CO2-reducing methanogenesis (CO2 + H2). Coloured areas on the map indicate which pathway(s) yield(s) the highest amount of energy per mole of methane, i.e., concentrations and pressures for which the associated ∆G expressed in kJ/mol CH4 is the lowest (see “Gibbs free energies of methanogenic pathways” in Materials and Methods). In central areas of the diagram, energy yields of two or three (*in this case none is yielding more energy) of the pathways are comparable with differences in ∆G of less than 10 kJ/mol CH4. This is shown in light red, grey and light blue areas. The dotted line indicates values of C(methanol) and p(H2) for which all three catabolisms have exactly the same ∆G. Ranges of C(methanol) and p(H2) found in the literature for rumen (1), human colon (2) and cockroach hindgut (3), and marine sediments (4–8; Supplementary Table 3) were mapped on the graph: dots correspond to mean values and bars indicate minimal and maximal values.

References

    1. Blaut M, Clavel T. Metabolic diversity of the intestinal microbiota: implications for health and disease. J. Nutr. 2007;137:751S–755S. doi: 10.1093/jn/137.3.751S. - DOI - PubMed
    1. Lozupone CA, Stombaugh JI, Gordon JI, Jansson JK, Knight R. Diversity, stability and resilience of the human gut microbiota. Nature. 2012;489:220–230. doi: 10.1038/nature11550. - DOI - PMC - PubMed
    1. Stevens CE, Hume ID. Contributions of microbes in vertebrate gastrointestinal tract to production and conservation of nutrients. Physiol. Rev. 1998;78:393–427. doi: 10.1152/physrev.1998.78.2.393. - DOI - PubMed
    1. Kapitan, M., Niemiec, M. J., Steimle, A., FrickIlse, J. S. & Jacobsen, D. Fungi as Part of the Microbiota and Interactions with Intestinal Bacteria. In Fungal Physiology and Immunopathogenesis422 (Springer, Cham, 2018). - PubMed
    1. Borrel G, Gribaldo S, Brugère J-F, Schmitz R, Moissl-Eichinger C. The host-associated archaeome. Nat. Rev. Microbiol. 2020;18:622–636. doi: 10.1038/s41579-020-0407-y. - DOI - PubMed

Publication types