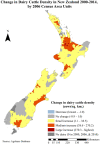
Dairy Cattle Density and Temporal Patterns of Human Campylobacteriosis and Cryptosporidiosis in New Zealand
- PMID: 35689151
- PMCID: PMC9276729
- DOI: 10.1007/s10393-022-01593-9
Dairy Cattle Density and Temporal Patterns of Human Campylobacteriosis and Cryptosporidiosis in New Zealand
Abstract
Public health risks associated with the intensification of dairy farming are an emerging concern. Dairy cattle are a reservoir for a number of pathogens that can cause human illness. This study examined the spatial distribution of dairy cattle density and explored temporal patterns of human campylobacteriosis and cryptosporidiosis notifications in New Zealand from 1997 to 2015. Maps of dairy cattle density were produced, and temporal patterns of disease rates were assessed for urban versus rural areas and for areas with different dairy cattle densities using descriptive temporal analyses. Campylobacteriosis and cryptosporidiosis rates displayed strong seasonal patterns, with highest rates in spring in rural areas and, for campylobacteriosis, summer in urban areas. Increases in rural cases often preceded increases in urban cases. Furthermore, disease rates in areas with higher dairy cattle densities tended to peak before areas with low densities or no dairy cattle. Infected dairy calves may be a direct or indirect source of campylobacteriosis or cryptosporidiosis infection in humans through environmental or occupational exposure routes, including contact with animals or feces, recreational contact with contaminated waterways, and consumption of untreated drinking water. These results have public health implications for populations living, working, or recreating in proximity to dairy farms.
Keywords: dairy cattle density; public health; zoonoses.
© 2022. The Author(s).
Conflict of interest statement
The authors declare no conflicts of interest.
Figures


References
-
- Abdelmajid D, Gordon N, Gianni L, Lora F, Anthony K, Sari K, Iain L, Christophe S, Richard E, Christopher L, Christophe H, Trevor B. The seasonality and effects of temperature and rainfall on Campylobacter infections. International Journal of Population Data Science. 2017;1(1):1125.
-
- Al Mawly J, Grinberg A, Prattley D, Moffat J, French N. Prevalence of endemic enteropathogens of calves in New Zealand dairy farms. New Zealand Veterinary Journal. 2015;63(3):147–152. - PubMed
-
- AsureQuality. (2019). "AgriBase." Retrieved 8 January 2019 from https://www.asurequality.com/our-solutions/agribase/.
-
- Bolan NS, Laurenson S, Luo J, Sukias J. Integrated treatment of farm effluents in New Zealand’s dairy operations. Bioresource Technology. 2009;100(22):5490–5497. - PubMed
-
- Britton E, Hales S, Venugopal K, Baker MG. The impact of climate variability and change on cryptosporidiosis and giardiasis rates in New Zealand. Journal of Water and Health. 2010;8(3):561. - PubMed
Publication types
MeSH terms
LinkOut - more resources
Full Text Sources
Medical

