. 2022 Aug;59(8):5236-5251.
doi: 10.1007/s12035-022-02888-2. Epub 2022 Jun 10.

Key Modulators of the Stress Granule Response TIA1, TDP-43, and G3BP1 Are Altered by Polyglutamine-Expanded ATXN7

Affiliations

Key Modulators of the Stress Granule Response TIA1, TDP-43, and G3BP1 Are Altered by Polyglutamine-Expanded ATXN7

Frida Niss et al. Mol Neurobiol. 2022 Aug.

Abstract

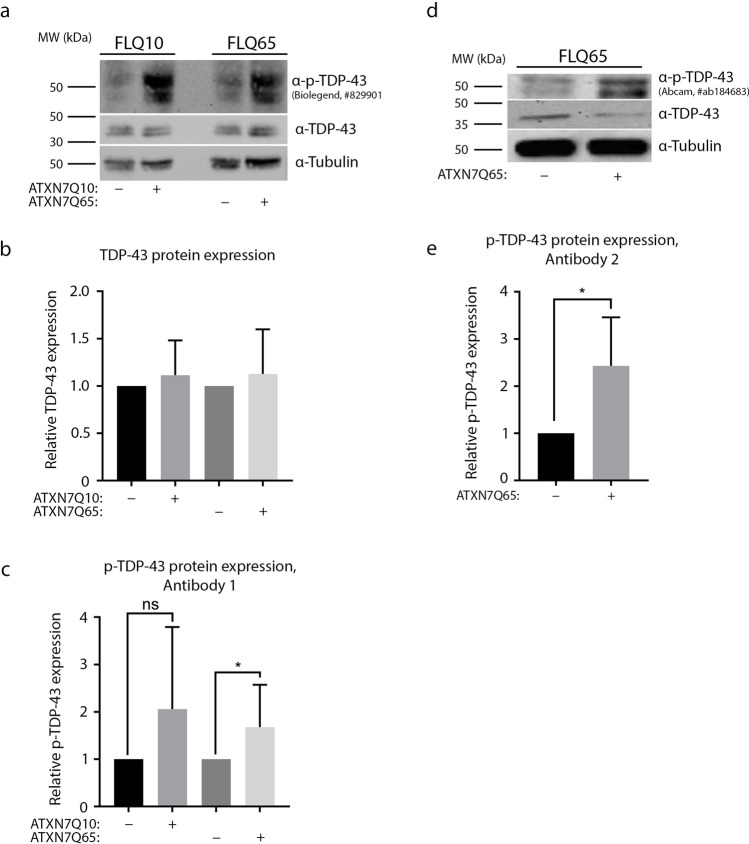
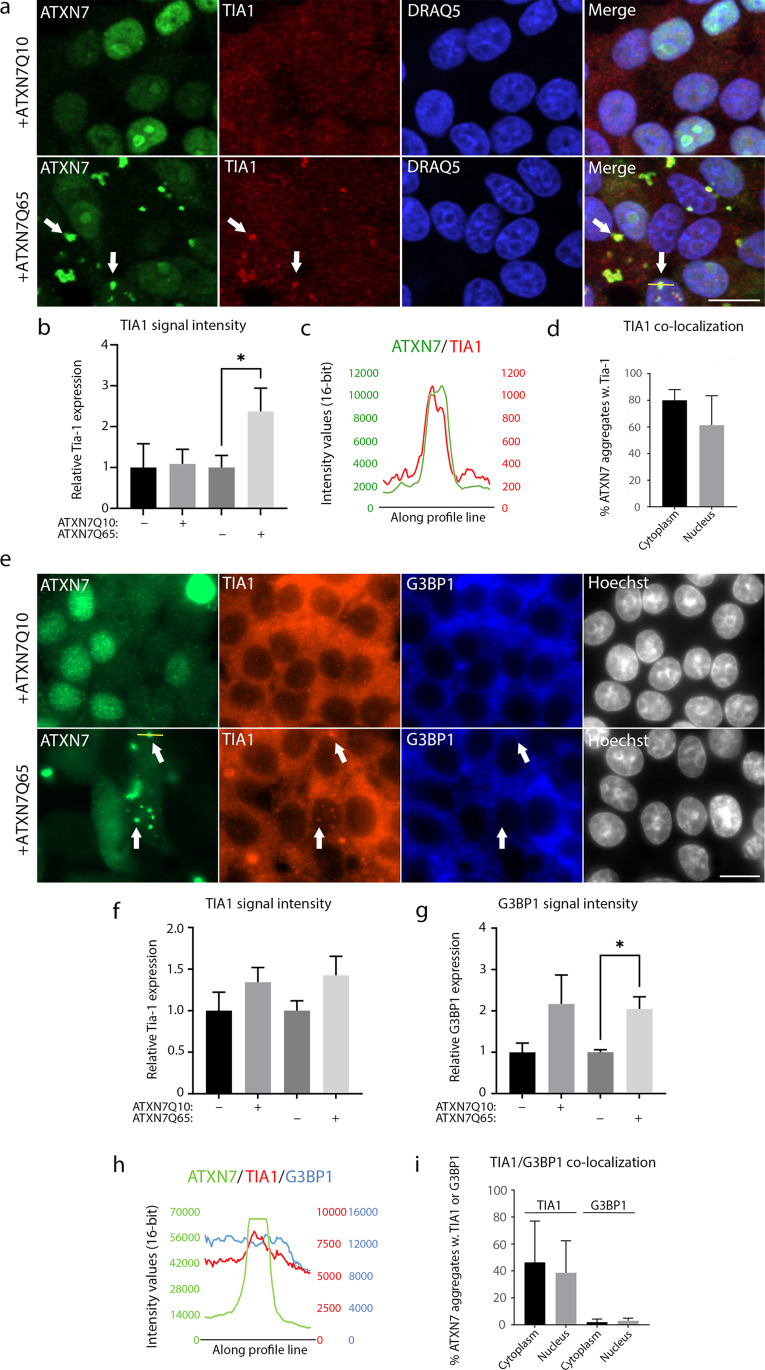
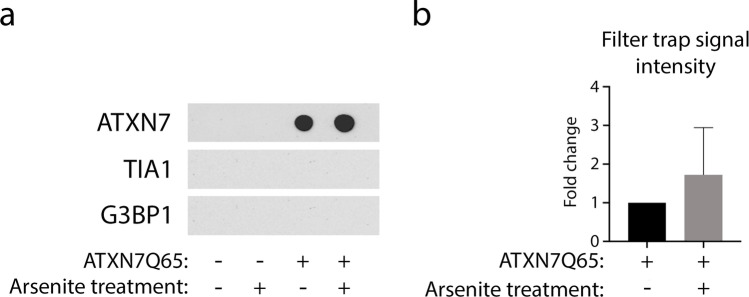
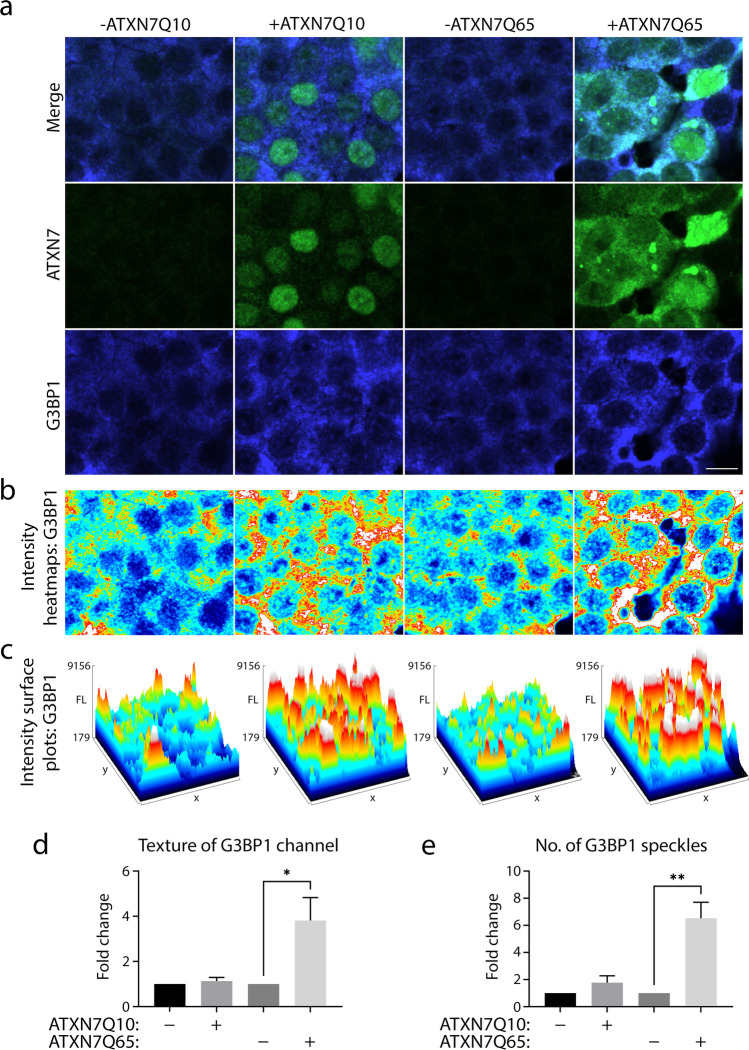
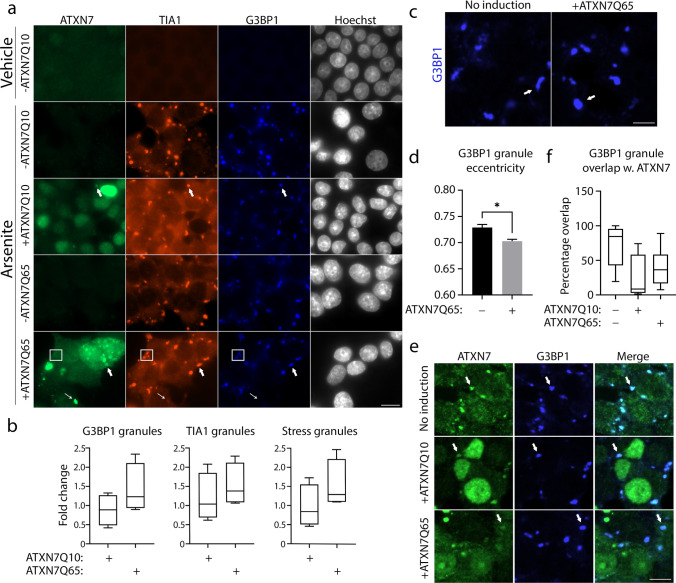
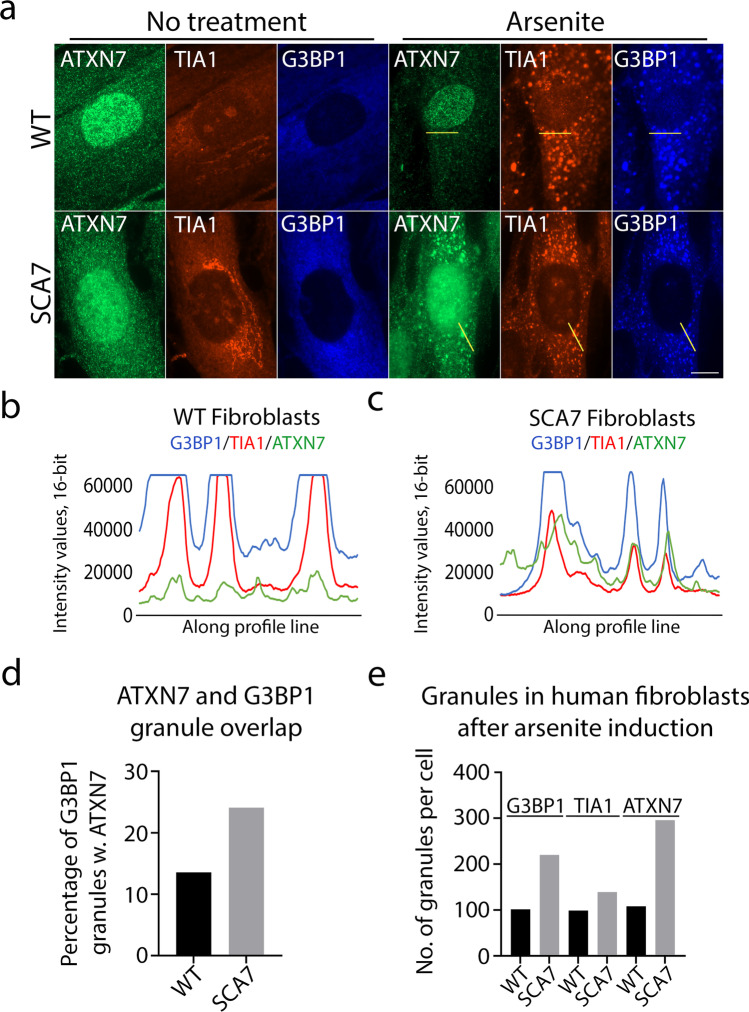
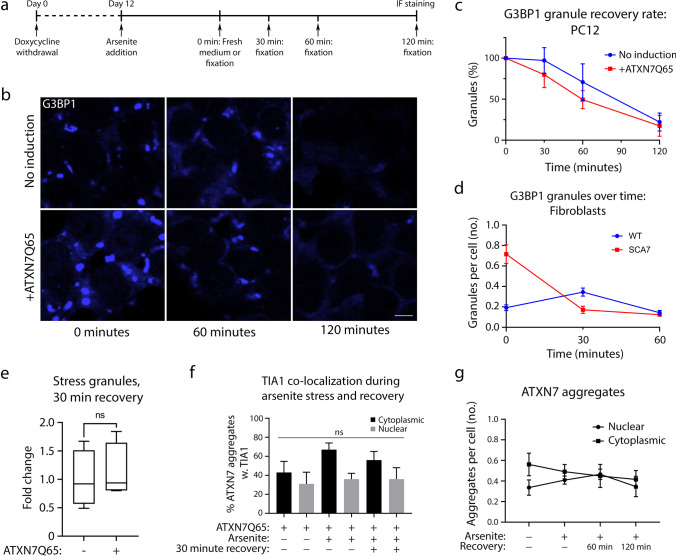
Spinocerebellar ataxia type 7 (SCA7) and other polyglutamine (polyQ) diseases are caused by expansions of polyQ repeats in disease-specific proteins. Aggregation of the polyQ proteins resulting in various forms of cellular stress, that could induce the stress granule (SG) response, is believed to be a common pathological mechanism in these disorders. SGs can contribute to cell survival but have also been suggested to exacerbate disease pathology by seeding protein aggregation. In this study, we show that two SG-related proteins, TDP-43 and TIA1, are sequestered into the aggregates formed by polyQ-expanded ATXN7 in SCA7 cells. Interestingly, mutant ATXN7 also localises to induced SGs, and this association altered the shape of the SGs. In spite of this, neither the ability to induce nor to disassemble SGs, in response to arsenite stress induction or relief, was affected in SCA7 cells. Moreover, we could not observe any change in the number of ATXN7 aggregates per cell following SG induction, although a small, non-significant, increase in total aggregated ATXN7 material could be detected using filter trap. However, mutant ATXN7 expression in itself increased the speckling of the SG-nucleating protein G3BP1 and the SG response. Taken together, our results indicate that the SG response is induced, and although some key modulators of SGs show altered behaviour, the dynamics of SGs appear normal in the presence of mutant ATXN7.

Keywords: G3BP1; Neurodegeneration; Spinocerebellar ataxia type 7; Stress granules; TDP-43; TIA1.


Conflict of interest statement

The authors declare no competing interests.

Figures

Fig. 1
Fig. 1
RNA binding protein TDP-43 co-localises with ATXN7 aggregates. a Representative confocal images showing PC12 cells induced to express either ATXN7Q10 or ATXN7Q65, as well as non-induced controls. All are stained with ATXN7 in green and DRAQ5 (blue) used as a DNA marker. Contrast settings are the same for all images, w ithin each stain. b ATXN7Q10/Q65 expressing cells stained for ATXN7 (green) and TDP-43 (red), using DRAQ5 as a DNA marker. Arrows point to ATXN7 aggregates and co-localising TDP-43 staining. Contrast settings are the same for all images, within each stain. c Representative profile plots showing the intensity values of ATXN7 and TDP-43 along the yellow line drawn in b (merge). d The percentages of sampled ATXN7 aggregates in cytoplasm and nucleus that contain a co-localising intensity peak of TDP-43 such as that displayed in c. e Quantified fold change of total TDP-43 intensity per cell in ATXN7Q10/Q65 expressing or non-induced cells. n = 3 for Q10, and n = 4 for Q65. Data are shown as mean ± SEM. Scale bar represents 10 µm
Fig. 2
Fig. 2
Phosphorylated TDP-43, but not total TDP-43, is increased in ATXN7Q65 expressing cells. a Representative western blots probed with α-p-TDP-43 (BioLegend, #829,901), α-TDP-43, and α-Tubulin in ATXN7Q10/Q65-induced or non-induced PC12 cells. b Quantified fold change of TDP-43 protein expression from blots shown in a. c Quantified fold change of p-TDP-43 protein expression from blots shown in a (ac: n = 9). d Representative western blots probed with alternative α-p-TDP-43 antibody (Abcam, #184,683), α-TDP-43, and α-Tubulin in ATXN7Q10/Q65-induced or non-induced PC12 cells. e Quantified fold change of p-TDP-43 protein expression from blots shown in d (de: n = 4). Data are shown as mean ± SEM, *p < 0.05
Fig. 3
Fig. 3
TIA1 is sequestered into aggregates and is increased in ATXN7Q65 expressing cells. a Representative confocal images of ATXN7Q10/Q65 expressing cells stained for ATXN7 (green) and TIA1 (red), using DRAQ5 as a DNA stain. Arrows point to ATXN7 aggregates and co-localising TIA1 staining. Contrast settings are the same for all images, within each stain. b Quantified fold change of total TIA1 intensity per cell in ATXN7Q10/Q65 expressing or non-induced cells. c Representative profile plots showing the intensity values of ATXN7, TIA1, and DRAQ5 along the yellow line drawn in a (merge). d The percentages of sampled ATXN7 aggregates in cytoplasm and nucleus that contain a co-localising intensity peak of TIA1 such as that displayed in c (ad: n = 2 for Q10, n = 3 for Q65). e Representative widefield images of ATXN7Q10/Q65 expressing cells stained for ATXN7 (green), TIA1 (red), and G3BP1 (blue), using Hoechst as a DNA stain. Arrows point to ATXN7 aggregates and co-localising TIA1 staining. Contrast settings are the same for all images, within each stain. f Quantified fold change of total TIA1 intensity per cell in ATXN7Q10/Q65 expressing or non-induced cells. g Quantified fold change of total G3BP1 intensity per cell in ATXN7Q10/Q65 expressing or non-induced cells. h Representative profile plots showing the intensity values of ATXN7, TIA1, and G3BP1 along the yellow line drawn in e (ATXN7 panel). i The percentages of sampled ATXN7 aggregates in cytoplasm and nucleus that contain a co-localising intensity peak of TIA1 such as that displayed in h, or G3BP1 (ei: n = 3 for Q10, n = 4 for Q65). Data are shown as mean ± SEM, *p < 0.05. Scale bars represent 10 µm
Fig. 4
Fig. 4
The sequestration of TIA1 into ATXN7Q65 aggregates is not detergent resistant. a Representative filter trap blot probed with α-ATXN7, α-TIA1, and α-G3BP1. Insoluble extracts from ATXN7Q65 expressing or non-induced PC12 cells were treated with SDS and DTT before filtration to capture aggregated material and immunoblotting. Contrast settings are the same for all images, within each stain. b Quantified fold change of ATXN7 filter trap signal in ATXN7Q65 expressing cells treated with arsenite for 1 h compared to untreated induced cells (n = 7). Data are shown as mean ± SEM
Fig. 5
Fig. 5
G3BP1 distribution exhibits more texture and a speckling behaviour in ATXN7Q65 expressing cells. a Representative confocal images of ATXN7Q10/Q65 expressing or non-induced cells stained for ATXN7 (green) and G3BP1 (blue). b Intensity heat maps of the respective G3BP1 stainings shown in a. c Intensity surface plots of the respective G3BP1 stainings shown in a. d Quantified fold change of the texture of the G3BP1 IF signal in ATXN7Q10/Q65 expressing or non-induced cells. e Quantified fold change of the number of G3BP1 speckles in ATXN7Q10/Q65 expressing or non-induced cells (n = 4); data are shown as mean ± SEM, *p < 0.05, **p < 0.01. Scale bar represents 10 µm
Fig. 6
Fig. 6
G3BP1 granules are induced and altered in ATXN7Q65 cells. a Representative widefield images of ATXN7Q10/Q65 expressing or non-induced PC12 cells treated with arsenite and stained for ATXN7 (green), TIA1 (red), and G3BP1 (blue), using Hoechst as a DNA stain. Thick arrows point to stress granules containing ATXN7, boxes surround stress granules that do not contain ATXN7, and thin arrows point to ATXN7 aggregates containing TIA1. Contrast settings are the same across all images, within each stain. Scale bar represents 10 µm. b Quantified fold change of the number of G3BP1 granules, TIA1 granules, and stress granules (stained with both G3BP1 and TIA1) in induced PC12 cells compared to non-induced PC12 cells (n = 4). c Representative confocal images of G3BP1 granules in arsenite-treated ATXN7Q65-induced PC12 cells compared to non-induced cells. Scale bar represents 5 µm. d Quantified eccentricity of G3BP1 granules in arsenite-treated ATXN7Q65-induced PC12 cells compared to non-induced cells (cd: n = 3). e Representative confocal images of arsenite-treated ATXN7Q10/Q65 expressing or non-induced PC12 cells showing co-localisation of ATXN7 with G3BP1 granules. Contrast settings are the same for all images, within each stain. Scale bar represents 5 µm. f Percentage of G3BP1 granules positive for ATXN7 in ATXN7Q10/Q65 expressing or non-induced cells (ef: n = 3). Data are shown as mean ± SEM, *p < 0.05
Fig. 7
Fig. 7
SCA7 patient fibroblasts show co-localisation of expanded ATXN7 with stress granules. a Representative widefield images of human control fibroblasts (WT) compared to SCA7 patient fibroblasts (SCA7) stained for ATXN7 (green), TIA1 (red), and G3BP1 (blue). Contrast settings were optimised for untreated cells and arsenite-treated cells separately. b Representative profile plots showing the intensity values of G3BP1, TIA1, and ATXN7 in control fibroblasts, along yellow lines drawn in a. c Representative profile plots showing the intensity values of G3BP1, TIA1, and ATXN7 in SCA7 fibroblasts, along yellow lines drawn in a. d Quantified percentage of G3BP1 granules containing ATXN7 staining in human control fibroblasts and SCA7 patient fibroblasts. e Quantified number of G3BP1, TIA1, and ATXN7-positive granules in arsenite-treated fibroblasts (n = 51 and 54 for WT and SCA7 cells respectively, one replicate). Scale bar represents 10 µm
Fig. 8
Fig. 8
ATXN7Q65 expression does not affect the stress granule recovery rate after arsenite treatment. a Schematic explaining the timeline of the experiment. b Representative confocal images of ATXN7Q65 expressing or non-induced PC12 cells stained for G3BP1 after the treatment with and recovery from arsenite. c Recovery rate of G3BP1 granules in PC12 cells over time, normalised to the number of granules at time point 0 (no recovery) (n = 4). d Recovery rate of G3BP1 granules after arsenite treatment over time in fibroblasts (n = 55–88 cells per line and time-point, one replicate). e Recovery of stress granules (TIA1/G3BP1 double-positive speckles) 30 min after removal of arsenite treatment in ATXN7Q65 expressing or non-induced cells, represented in fold change of non-induced cells (n = 4). f Percentage of ATXN7 aggregates that are TIA1 positive before during and after arsenite stress (n = 4). g Number of nuclear and cytoplasmic ATXN7 aggregates before, during, and after arsenite treatment (n = 4). Data are shown as mean ± SEM; ns, non-significant. Scale bar represents 5 µm

Similar articles

Cited by

References

    1. Jonasson J, Ström A-L, Hart P, Brännström T, Forsgren L, Holmberg M. Expression of ataxin-7 in CNS and non-CNS tissue of normal and SCA7 individuals. Acta Neuropathol. 2002;104(1):29–37. doi: 10.1007/s00401-001-0514-4. - DOI - PubMed
    1. Köhler A, Zimmerman E, Schneider M, Hurt E, Zheng N. Structural basis for assembly and activation of the heterotetrameric SAGA histone H2B deubiquitinase module. Cell. 2010;141(4):606–617. doi: 10.1016/j.cell.2010.04.026. - DOI - PMC - PubMed
    1. Samara NL, Datta AB, Berndsen CE, Zhang X, Yao T, Cohen RE, Wolberger C. Structural insights into the assembly and function of the SAGA deubiquitinating module. Science. 2010;328(5981):1025–1029. doi: 10.1126/science.1190049. - DOI - PMC - PubMed
    1. Palhan VB, Chen S, Peng G-H, Tjernberg A, Gamper AM, Fan Y, Chait BT, La Spada AR, Roeder RG. Polyglutamine-expanded ataxin-7 inhibits STAGA histone acetyltransferase activity to produce retinal degeneration. Proc Natl Acad Sci USA. 2005;102(24):8472–8477. doi: 10.1073/pnas.0503505102. - DOI - PMC - PubMed
    1. McMahon SJ, Pray-Grant MG, Schieltz D, Yates JR, Grant PA. Polyglutamine-expanded spinocerebellar ataxia-7 protein disrupts normal SAGA and SLIK histone acetyltransferase activity. Proc Natl Acad Sci USA. 2005;102(24):8478–8482. doi: 10.1073/pnas.0503493102. - DOI - PMC - PubMed

MeSH terms

LinkOut - more resources