. 2022 Aug:54:102360.
doi: 10.1016/j.redox.2022.102360. Epub 2022 Jun 3.

Fullerenol protects cornea from ultraviolet B exposure

Affiliations

Fullerenol protects cornea from ultraviolet B exposure

Xia Chen et al. Redox Biol. 2022 Aug.

Abstract

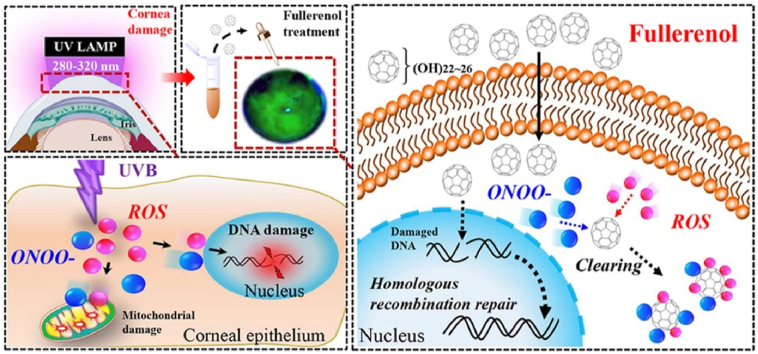
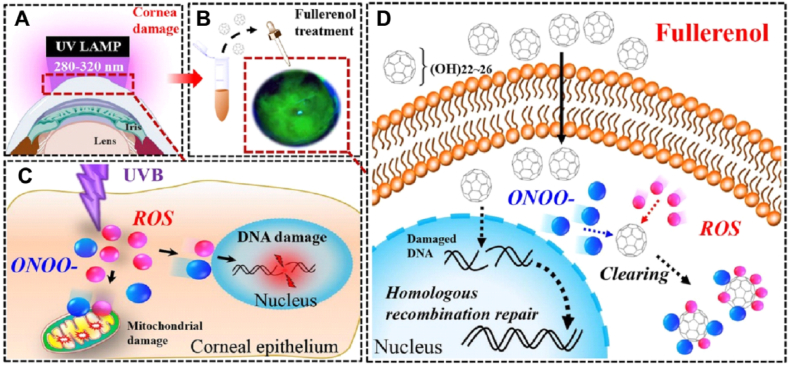
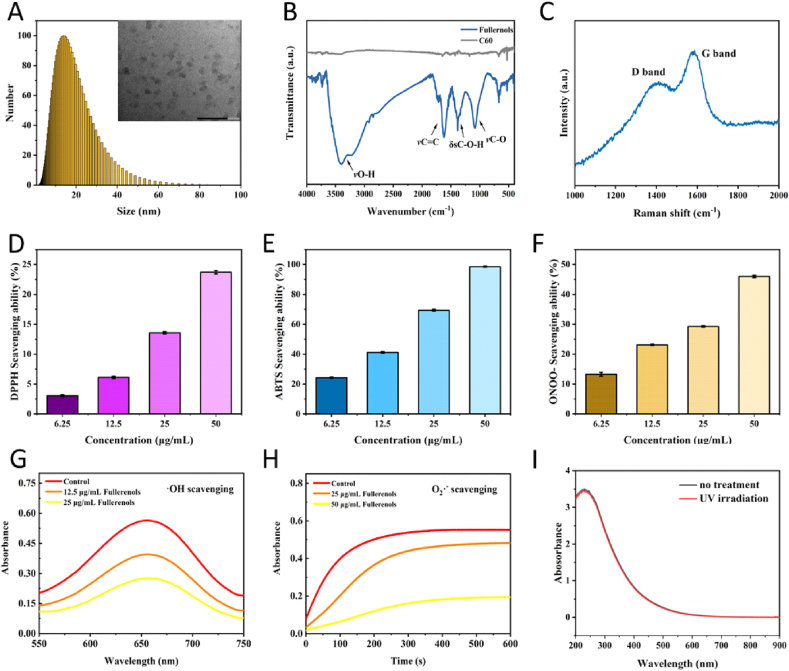
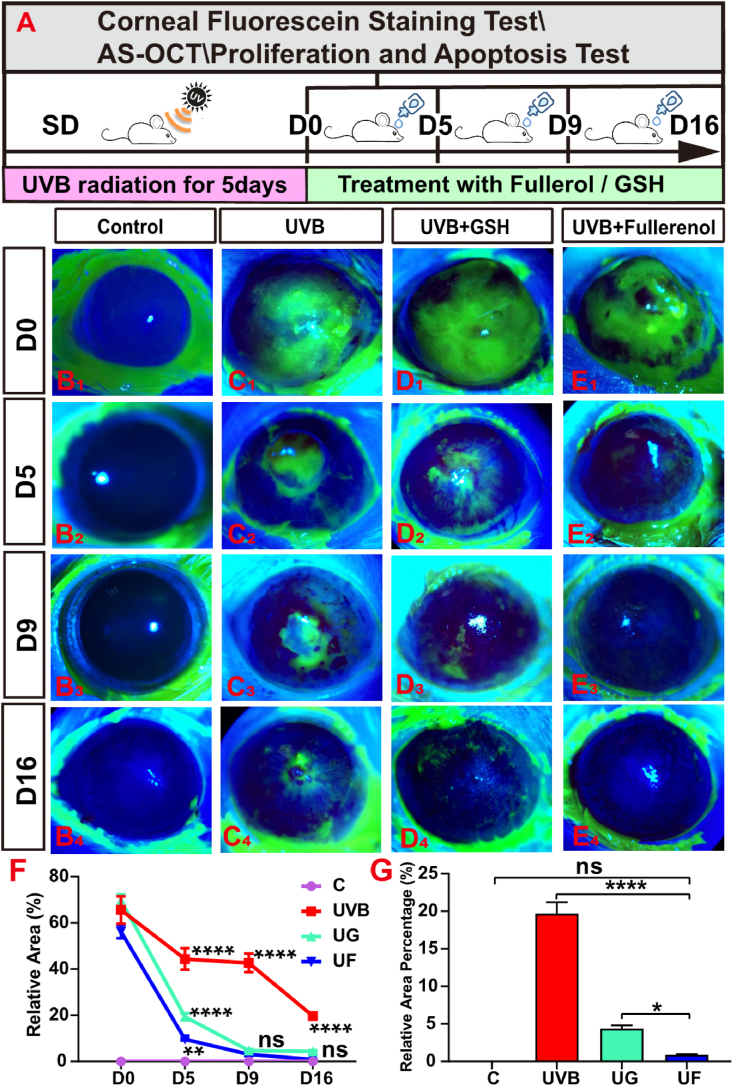
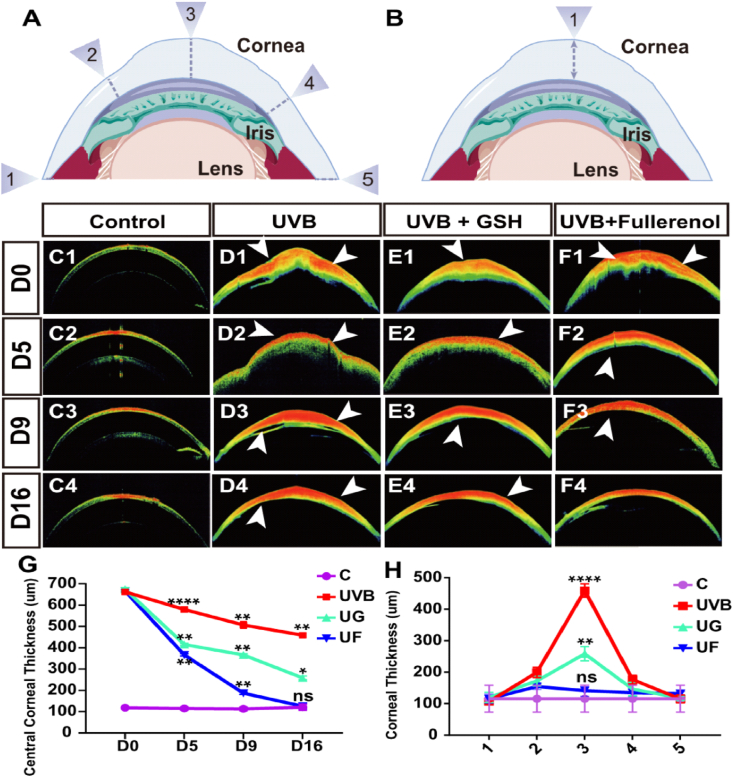
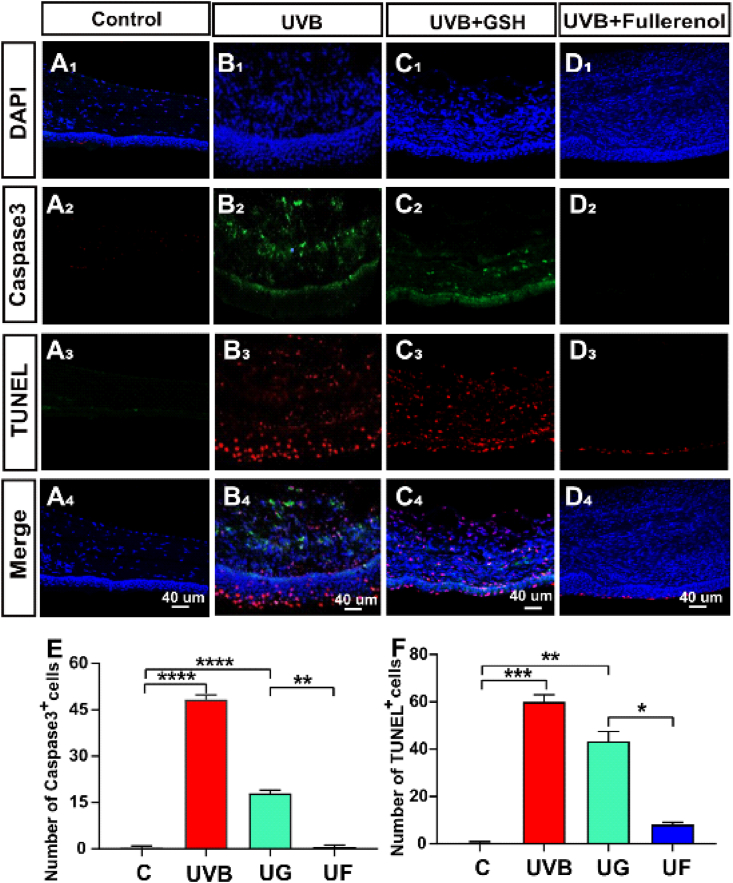
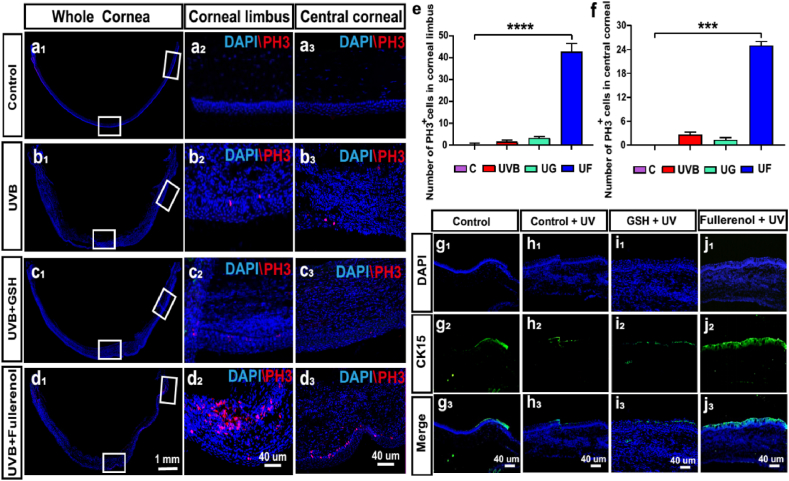
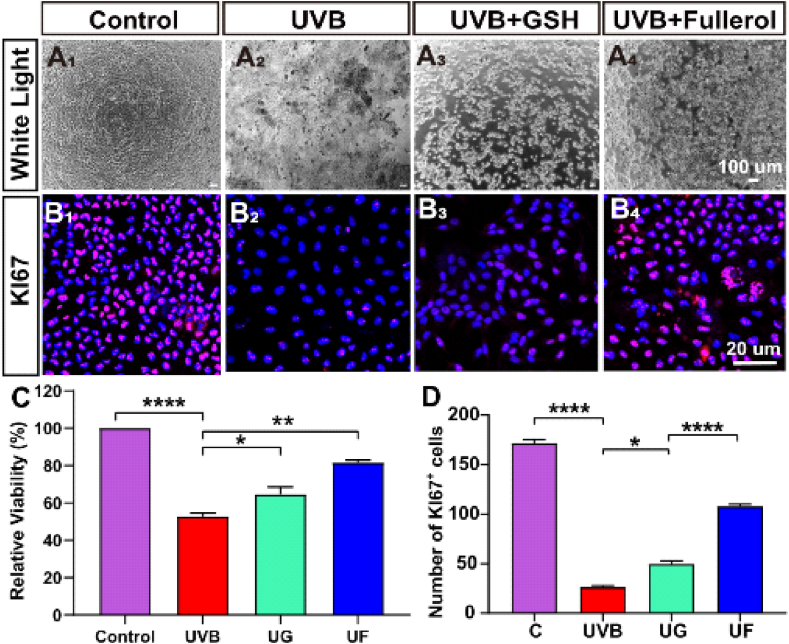
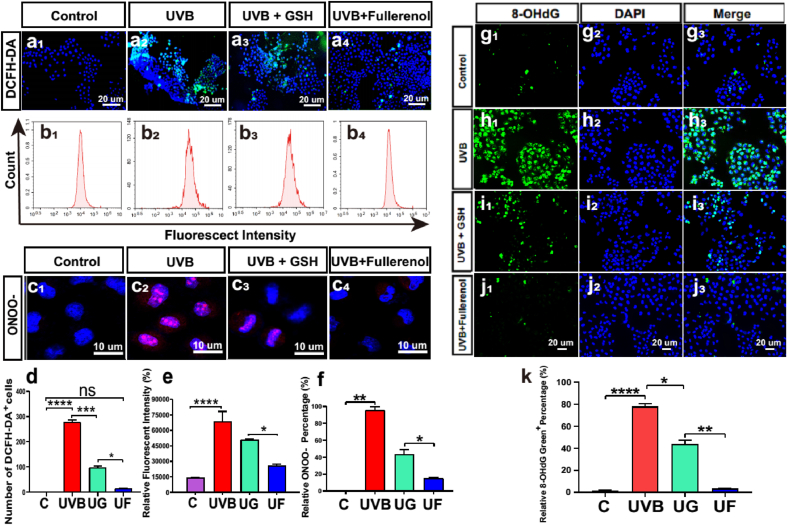
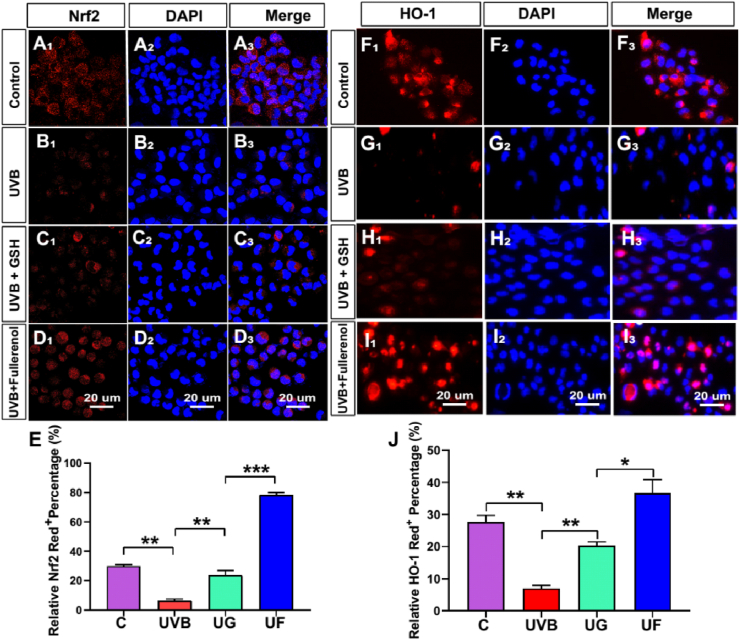
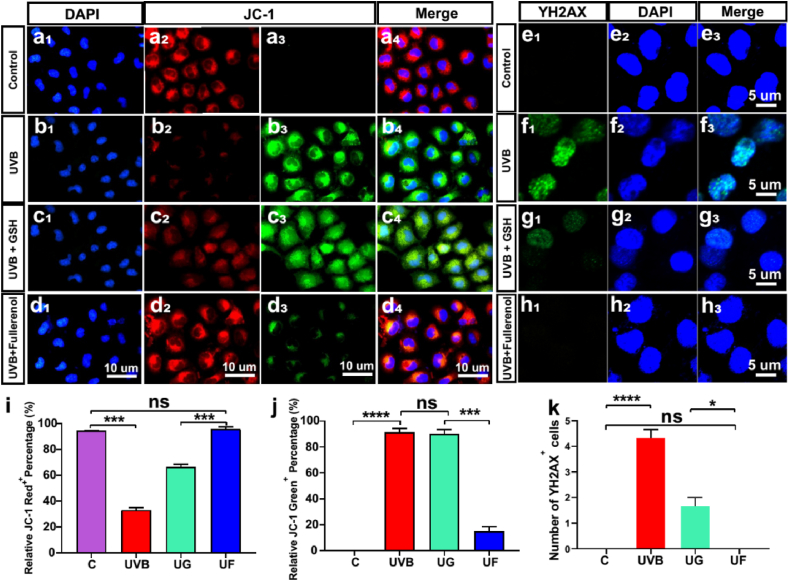
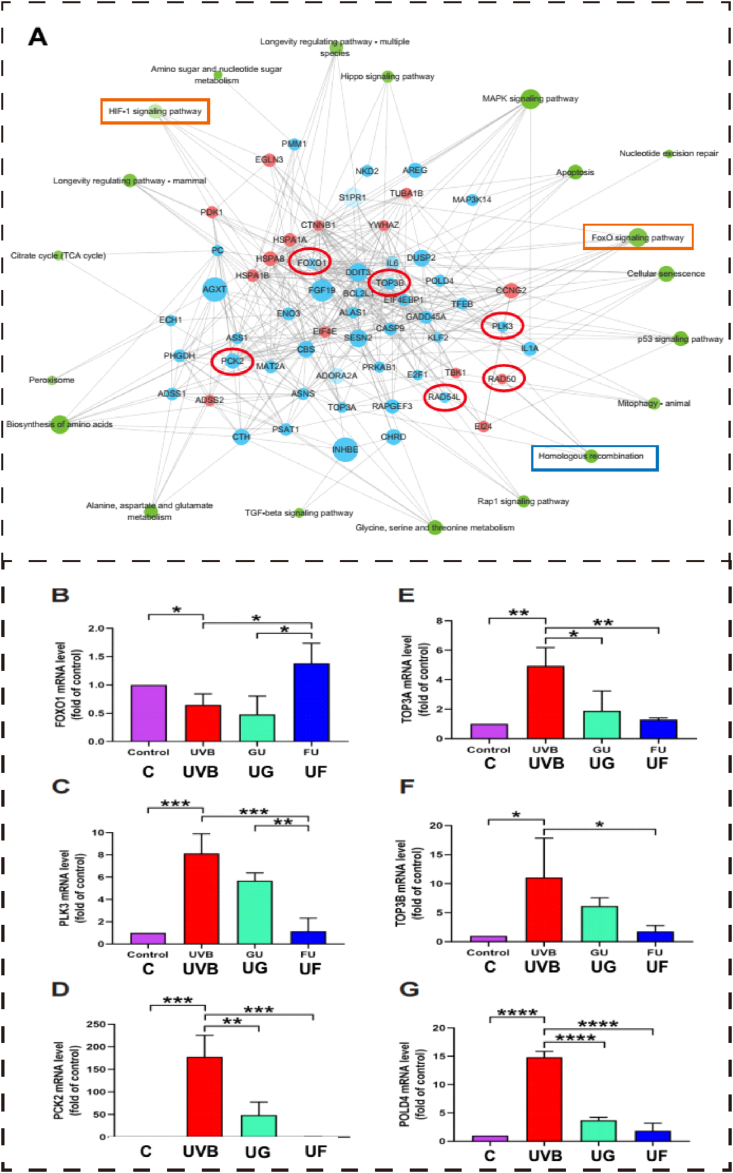
The eyes are highly susceptible to the oxidative stress induced by ultraviolet B (UVB, wavelength between 280 ∼ 320 nm), which could cause severe damage to the cornea. Fullerenols are effective antioxidants to alleviate UVB-induced injury, while their application for the eyes is still rare. In present study, we investigated the protective performance and mechanism of fullerenols on cornea under UVB radiation in vivo and in vitro. The synthesized fullerenols exhibited broad-spectrum free radical scavenging properties (applicable to both reactive oxygen species (ROS) and reactive nitrogen species (RNS)) and photo-stability. When compared with another widely used antioxidant glutathione (GSH), the administration of fullerenols markedly decreased the injured area, corneal edema, cell death, and increased the cell proliferation in UVB-induced rat cornea. The effects of fullerenols were confirmed in UVB-exposed human corneal epithelial cells (hCECs), where elevated cell viability and proliferation, decreased oxidative free radical production, repaired mitochondrial dysfunction and DNA lesions were observed. RNA sequencing (RNA-Seq) analysis demonstrated that fullerenol alleviated UVB-induced corneal injury through down-regulation of oxidative stress-related genes and up-regulation of proliferation-associated genes. Our results demonstrate the suitability of fullerenols as a potential exogenous treatment in ameliorating UVB-induced cornea damage.

Keywords: Corneal protection; Free radicals; Fullerenol; Ultraviolet B.


Conflict of interest statement

The authors declare that they have no known competing financial interests or personal relationships that could have appeared to influence the work reported in this paper.

Figures

Image 1
Graphical abstract
Scheme 1
Scheme 1
Graphical scheme of the experiments. The possible mechanism underlying UVB-induced corneal surface damages and the protection of fullerenol in corneal epithelial cell injury using in vitro and in vivo models. A, C) Schematic diagram of the corneal response to UVB radiation exposure. The corneal epithelial cells exposed to UVB produce reactive oxygen species (ROS) and peroxynitrite anion (ONOO). The accumulation of free radicals is expected to cause oxidative stress and further single-strand breaks of DNA. Free radical-associated mitochondrial damage decreases mitochondrial membrane potential and disturbs the function of mitochondrial respiration chain. B, D) Schematic illustration of the protective mechanisms of fullerenol on the cell injury caused by UVB irradiation. Fullerenol easily penetrates the cell membrane and reacts with excessive radicals localized throughout the cytoplasm, quenches them by redox reactions. Upon oxidative DNA damage in nuclei, it traverses the nuclear envelope, promotes homologous recombination repair (HRR) and double-strand break repair.
Fig. 1
Fig. 1
Characterization and evaluation of the free radical scavenging performance of fullerenols. A) hydrodynamic size of fullerenols (insert: TEM image, scale bar 100 nm). B) FTIR spectrum of fullerenols. C) Raman spectrum of fullerenols. D) DPPH radical scavenging ability of fullerenols. E) ABTS radical scavenging ability of fullerenols. F) ONOO scavenging ability of fullerenols. G) •OH scavenging ability of fullerenols. H) O2• scavenging ability of fullerenols. I) UV–vis absorption spectra of fullerenols treated with and without UV irradiation (15 W, 1 h).
Fig. 2
Fig. 2
Therapeutic effect of fullerenol or GSH on the injuried area of corneal damage caused by the UVB radiation in rats. A) Schematic diagram of UVB radiation-induced corneal injury and treatment with 25 μg/mL fullerenol and 6.8 μg/mL GSH (the same molar concentration). The rat cornea was irradiated with UVB for 5 days to establish the model. B1-E4) The representative images of corneal damages under cobalt blue light of control, UVB, GSH + UVB, fullerenol + UVB group investigated by fluorescein sodium staining respectively. B1–B4) The control group was observed on days 0, 5, 9 and 16 respectively after treatment. C1–C4) The UVB group. D1-D4) The UVB + GSH group. E1-E4) The UVB + fullerenol group, all were observed on days 0, 5, 9 and 16 respectively after treatment. F) Quantitative comparison of relative damaged area of central corneal in different groups. G) Comparison of the injured area between fullerenol and GSH treatment for 16 days (n = 3 eyes/group). The above detections were implemented in three independent experiments. Data were expressed as the mean ± SEM from three independent experiments. **P < 0.01, ****P < 0.0001 using one-way ANOVA and post-hoc Tukey's test. (For interpretation of the references to colour in this figure legend, the reader is referred to the Web version of this article.)
Fig. 3
Fig. 3
Effects of fullerenol or GSH on the corneal edema of UVB radiation-induced corneal injury in rats. A) Schematic diagram of the measurement of corneal thickness in the rats. B) Measurement of central corneal thickness. C–F) Anterior segment OCT images of control, UVB, GSH + UVB, fullerenol + UVB group, respectively (the white arrow indicated corneal edema). C1–C4) Control group; D1-D4) UVB group; E1-E4) UVB + GSH group; F1–F4) UVB + fullerenol group; G) Comparison of thickness in central corneal epithelium treated with fullerenol and GSH at different time points after UVB exposure (n = 3 eyes/group). H) Statistical analysis of the thickness of the whole cornea at 16 day after treatment with fullerenol or GSH (n = 3 eyes/group). The above detections were implemented in three independent experiments. Data were expressed as the mean ± SEM from three independent experiments. **P < 0.01, ***P < 0.0001, ****P < 0.0001 using one-way ANOVA and post-hoc Tukey's test.
Fig. 4
Fig. 4
Effects of fullerenol or GSH on the apoptosis in the cornea of UVB radiation-induced rats. A-D) Apoptosis detection with immuno-fluorescence staining: A1-A4) Control group. B1–B4) UVB group. C1–C4) UVB + GSH group. D1-D4) UVB + Fullerenol group. E) Quantitative analysis of the number of Caspase3-positive cells in the cornea of rats. F) Quantitative analysis of the number of TUNEL-positive cells in the cornea of rats. The above detections were implemented in three independent experiments. Data were expressed as mean ± SEM from three independent experiments. *P < 0.1, **P < 0.01, ***P < 0.001, ****P < 0.0001 using one-way ANOVA and post-hoc Tukey's test. Effects of fullerenol on the apoptosis in the cornea of UVB radiation-induced rats.
Fig. 5
Fig. 5
Effects of fullerenol or GSH on the cell proliferation of corneal epithelial cells and limbal stem cells in the cornea of UVB radiation-induced rats. a-d) Representative images of immunofluorescence for PH3 (red) and DAPI (blue) in different groups: a1-a3) Control group. b1–b3) UVB group. c1–c3) UVB + GSH group. d1-d3) UVB + Fullerenol group. a1, b1, c1, d1) Representative images of immunofluorescence for whole cornea. a2, b2, c2, d2) Representative images of immunofluorescence for cornea limbus. a3, b3, c3, d3) Representative images of immunofluorescence for central cornea. e) Comparison of the number of PH3 -positive cells in the cornea limbus. f) Comparison of the number of PH3 -positive cells in the central cornea. N = 3 samples per group. g-j) Limbal stem cell marker CK15 detection with immuno-fluorescence staining: g1-g3) Control group. h1–h3) UVB group. i1–i3) UVB + GSH group. j1-j3) UVB + Fullerenol group. Data were expressed as mean ± SEM from three independent experiments. *P < 0.1, ***P < 0.001, ****P < 0.0001 using one-way ANOVA and post-hoc Tukey's test. (For interpretation of the references to colour in this figure legend, the reader is referred to the Web version of this article.)
Fig. 6
Fig. 6
Influences of fullerenol or GSH on the cell viabilities and proliferation of hCECs exposed to UVB. A1-A4) Morphological features of hCECs under phase-contrast microscopy, showing morphological changes following 2h exposure to UVB and treated with 25 μg/ml fullerenol and 6.8 μg/ml GSH (the same molar concentration) for 24 h. B1–B4) Representative images of immunofluorescence for Ki67 (red) and DAPI (blue) in different groups: B1) Control group. B2) hCECs exposed to UVB for 2 h. B3) hCECs treated with GSH for 24 h. B4) hCECs treated with fullerenol for 24 h. C) Cell counting kit (CCK-8) detected cell viability of hCECs treated with fullerenol and GSH for 24 h respectively after UVB radiation damage G) Comparison of the number of Ki67-positive cells in different groups. The above detections were implemented in three independent experiments. Data were expressed as mean ± SEM from three independent experiments. *P < 0.1, **P < 0.01, ****P < 0.0001 using one-way ANOVA and post-hoc Tukey's test. (For interpretation of the references to colour in this figure legend, the reader is referred to the Web version of this article.)
Fig. 7
Fig. 7
Changes of ROS and ONOO level in the hCECs exposed to UVB and the effect of fullerenol or GSH. a1-a4) Representative images of immunofluorescence for intracellular ROS (DCFH-DA, green, counterstained with DAPI, blue) in hCECs. a1) Control group. a2) The UVB group. a3) hCECs treated with 6.8 μg/ml GSH after exposure to UV for 2 h a4) hCECs treated with 25 μg/ml fullerenol after exposure to UV for 2 h b1-b4). Flow cytometry analysis of the intracellular ROS production treated with fullerenol and GSH after UVB radiation damage. b1) Control group. b2) The UVB group. b3) UVB + GSH group. b4) UVB + fullerenol group. c1-c4) Representative images of hCECs fluoresced in yellow (ONOO) and blue (DAPI). c1) Control group. c2) hCECs exposed to UV for 2 h c3) hCECs treated with GSH for 24h. c4) hCECs treated with fullerenol for 24 h. d) Comparison of the number of ROS-positive cells in different groups. e) The relative fluorescence intensity of ROS production in each group was analyzed with flow cytometry. f) Comparison of the number of ONOO positive cells. g-k) Representative images of immunofluorescence for 8-OHdG (green, counterstained with DAPI, blue): g1-g3) Control group. h1-h3) UVB group. i1-i3) UVB + GSH group. j1-j3) UVB + Fullerenol group. k) Quantitative analysis of the number of 8-OHdG-positive cells. The above detections were implemented in three independent experiments. Data were expressed as the mean ± SEM from three independent experiments. N = 3 samples per group. *P < 0.1, **P < 0.01, ****P < 0.0001 using one-way ANOVA and post-hoc Tukey's test. (For interpretation of the references to colour in this figure legend, the reader is referred to the Web version of this article.)
Fig. 8
Fig. 8
Influences of fullerenol or GSH on the DNA oxidative damage and antioxidant capacity of hCECs exposed to UVB. A-D) Representative images of immunofluorescence for Nrf2 (red) and DAPI (blue) in different groups: A1-A3) Control group. B1–B3) UVB group. C1–C3) UVB + GSH group. D1-D3) UVB + Fullerenol group. E) Quantitative analysis of the number of Nrf2-positive cells of different groups. F–I) Detection of antioxidant protein HO-1 with immuno-fluorescence staining following exposure to UVB and the effect of GSH or fullerenol: F1–F3) Control group. G1-G3) UVB group. H1–H3) UVB + GSH group. I1–I3) UVB + Fullerenol group. J) Quantitative analysis of the number of HO-1-positive cells in different groups. Data were expressed as the mean ± SEM from three independent experiments. *P < 0.1, **P < 0.01, ***P < 0.001, ****P < 0.0001 using one-way ANOVA and post-hoc Tukey's test. (For interpretation of the references to colour in this figure legend, the reader is referred to the Web version of this article.)
Fig. 9
Fig. 9
Effects of fullerenol or GSH on mitochondrial membrane potential changes and DNA damage in hCECs caused by UVB exposure. a-d) Fluorescence changes of different mitochondrial membrane potentials in cells after different exposures. Normal mitochondria were fluorescently labeled in red and the fluorescence changes from green to red when the mitochondrial membrane potential decreases. a1-a3) Control group. b1-b3) hCECs exposed to UV for 2 h. c1–c3) hCECs treated with 6.8 μg/ml GSH after exposure to UV for 2 h. d1-d3) hCECs were treated with 25 μg/ml fullerenol for 24 h. e-h) Representative images of immunofluorescence for the γ-H2AX positive cells (green, counterstained with DAPI, blue) in hCECs. e1-e3) Control group.f1–f3) hCECs exposed to UV for 2 h. g1-g3) hCECs treated with GSH for 24 h. h1–h3) hCECs were treated with fullerenol for 24 h after being exposed to UV radiation for 2 h. i) Comparison of the number of JC-1+ red cells in different groups. j) Comparison of the number of JC-1+ Green cells in different groups. k) Comparison of the number of γ-H2AX-positive cells in different groups. N = 3 samples per group. Data were expressed as the mean ± SEM from three independent experiments. *P < 0.1, ***P < 0.001, ****P < 0.0001 using one-way ANOVA and post-hoc Tukey's test. (For interpretation of the references to colour in this figure legend, the reader is referred to the Web version of this article.)
Fig. 10
Fig. 10
Kyoto Encyclopedia of Genes and Genomes (KEGG) analysis of molecular pathways involved in the protection of fullerenol on the UVB exposed hCECs. A) KEGG pathway analysis for differently expressed mRNAs. Each node of the green circle represents a signaling pathway. Grey linear represents interactive relationships between two signaling pathways. Each node of the blue circle represents down-regulated genes and the red circle represents up-regulated genes. The red and oval boxes represent the pathways and genes that differ the most in this group. B-D) The relative mRNA expression of genes associated with the FoxO signaling pathway (B–D) or homologous recombination pathway (E-G) which were involved in the protection of fullerenol in the UVB irradiated hCECs screened by RNA-Seq. B) FOXO1 mRNA expression. C) PLK3 mRNA expression. D) PCK2 mRNA expression. E) TOP3A mRNA expression. F) TOP3B mRNA expression. G) POLD4 mRNA expression. N = 3 samples per group. Data were expressed as the mean ± SEM from three independent experiments. *P < 0.1, ****P < 0.0001 using one-way ANOVA and post-hoc Tukey's test. (For interpretation of the references to colour in this figure legend, the reader is referred to the Web version of this article.)

References

    1. Hiramoto K., Yamate Y. Long-term UVA exposure to the eye compromises memory and learning ability in mice via corticotropin-releasing hormone type 2 receptor. Int. J. Biol. Sci. 2020;16(12):2170–2179. - PMC - PubMed
    1. Tenkate T., Adam B., Al-Rifai R.H., Chou B.R., Gobba F., Ivanov I.D., Leppink N., Loney T., Pega F., Peters C.E., Prüss-Üstün A.M., Silva Paulo M., Ujita Y., Wittlich M., Modenese A. WHO/ILO work-related burden of disease and injury: protocol for systematic reviews of occupational exposure to solar ultraviolet radiation and of the effect of occupational exposure to solar ultraviolet radiation on cataract. Environ. Int. 2019;125:542–553. - PubMed
    1. Das L.M., Binko A.M., Traylor Z.P., Peng H., Lu K.Q. Vitamin D improves sunburns by increasing autophagy in M2 macrophages. Autophagy. 2019;15(5):813–826. - PMC - PubMed
    1. Palazzo M., Vizzarri F., Ondruška L., Rinaldi M., Pacente L., Guerra G., Merolla F., Caruso C., Costagliola C. Corneal UV protective effects of a topical antioxidant formulation: a pilot study on in vivo rabbits. Int. J. Mol. Sci. 2020;21(15):5426. - PMC - PubMed
    1. Zhao C., Li W., Duan H., Li Z., Jia Y., Zhang S., Wang X., Zhou Q., Shi W. NAD(+) precursors protect corneal endothelial cells from UVB-induced apoptosis. Am. J. Physiol. 2020;318(4):C796–C805. - PubMed

Publication types

LinkOut - more resources