

COVID-19 trajectories among 57 million adults in England: a cohort study using electronic health records
- PMID: 35690576
- PMCID: PMC9179175
- DOI: 10.1016/S2589-7500(22)00091-7
COVID-19 trajectories among 57 million adults in England: a cohort study using electronic health records
Abstract
Background: Updatable estimates of COVID-19 onset, progression, and trajectories underpin pandemic mitigation efforts. To identify and characterise disease trajectories, we aimed to define and validate ten COVID-19 phenotypes from nationwide linked electronic health records (EHR) using an extensible framework.
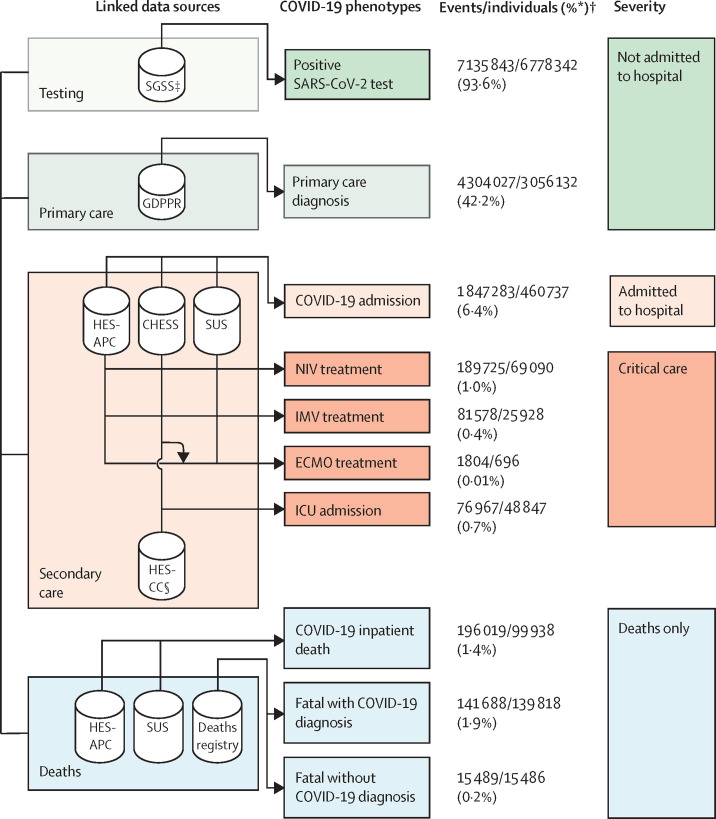
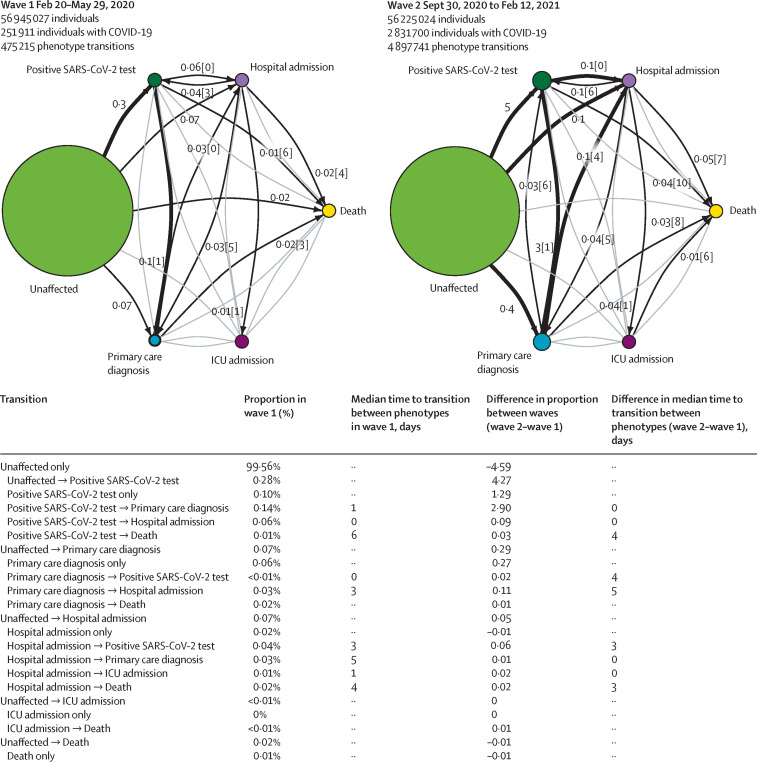
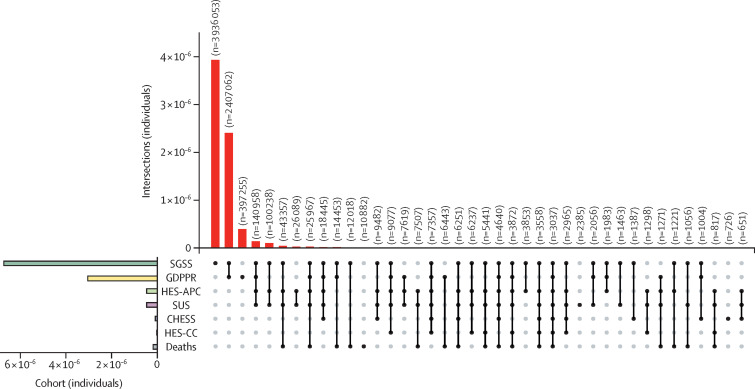
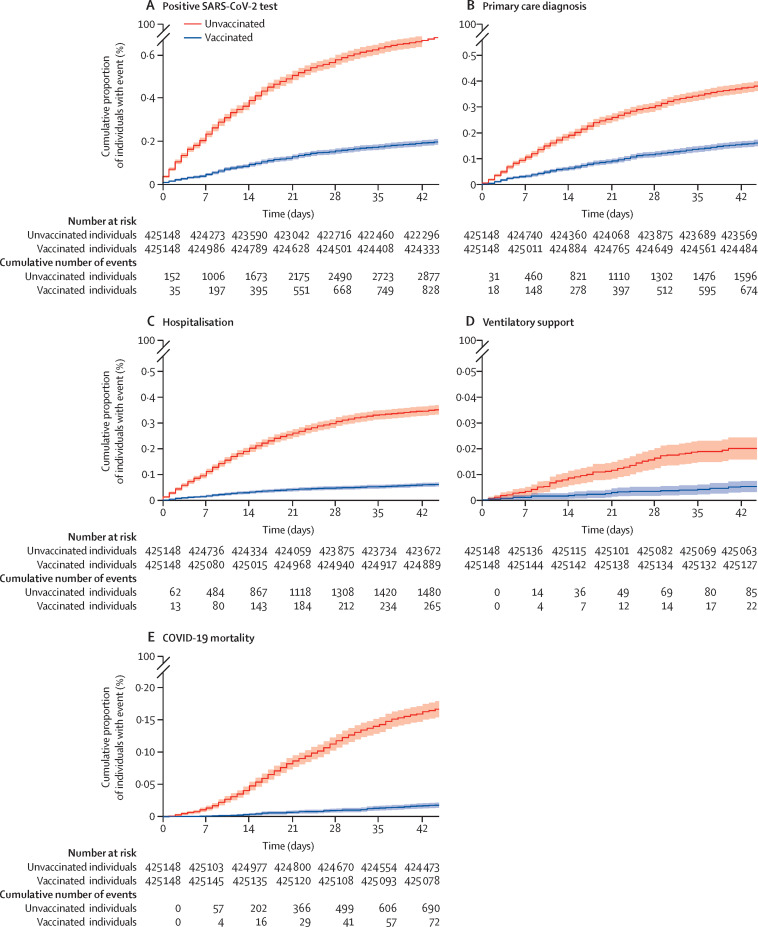
Methods: In this cohort study, we used eight linked National Health Service (NHS) datasets for people in England alive on Jan 23, 2020. Data on COVID-19 testing, vaccination, primary and secondary care records, and death registrations were collected until Nov 30, 2021. We defined ten COVID-19 phenotypes reflecting clinically relevant stages of disease severity and encompassing five categories: positive SARS-CoV-2 test, primary care diagnosis, hospital admission, ventilation modality (four phenotypes), and death (three phenotypes). We constructed patient trajectories illustrating transition frequency and duration between phenotypes. Analyses were stratified by pandemic waves and vaccination status.
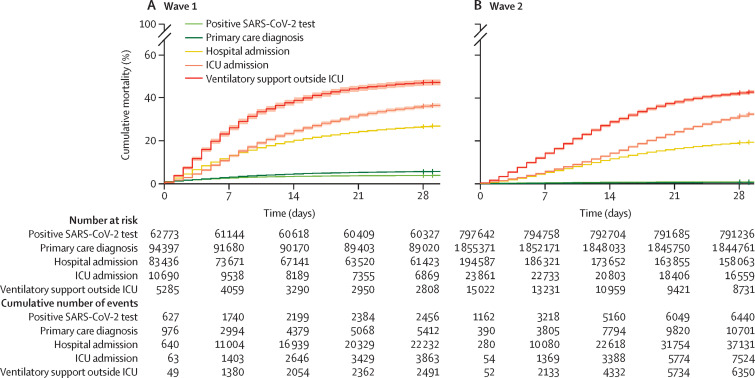
Findings: Among 57 032 174 individuals included in the cohort, 13 990 423 COVID-19 events were identified in 7 244 925 individuals, equating to an infection rate of 12·7% during the study period. Of 7 244 925 individuals, 460 737 (6·4%) were admitted to hospital and 158 020 (2·2%) died. Of 460 737 individuals who were admitted to hospital, 48 847 (10·6%) were admitted to the intensive care unit (ICU), 69 090 (15·0%) received non-invasive ventilation, and 25 928 (5·6%) received invasive ventilation. Among 384 135 patients who were admitted to hospital but did not require ventilation, mortality was higher in wave 1 (23 485 [30·4%] of 77 202 patients) than wave 2 (44 220 [23·1%] of 191 528 patients), but remained unchanged for patients admitted to the ICU. Mortality was highest among patients who received ventilatory support outside of the ICU in wave 1 (2569 [50·7%] of 5063 patients). 15 486 (9·8%) of 158 020 COVID-19-related deaths occurred within 28 days of the first COVID-19 event without a COVID-19 diagnoses on the death certificate. 10 884 (6·9%) of 158 020 deaths were identified exclusively from mortality data with no previous COVID-19 phenotype recorded. We observed longer patient trajectories in wave 2 than wave 1.
Interpretation: Our analyses illustrate the wide spectrum of disease trajectories as shown by differences in incidence, survival, and clinical pathways. We have provided a modular analytical framework that can be used to monitor the impact of the pandemic and generate evidence of clinical and policy relevance using multiple EHR sources.
Funding: British Heart Foundation Data Science Centre, led by Health Data Research UK.
Copyright © 2022 The Author(s). Published by Elsevier Ltd. This is an Open Access article under the CC BY 4.0 license. Published by Elsevier Ltd.. All rights reserved.
Conflict of interest statement
Declaration of interests AB reports grants from the National Institute for Health Research (NIHR), British Medical Association, AstraZeneca, and UK Research and Innovation, outside the submitted work. BAM is an employee of the Wellcome Trust and reports grants from Health Data Research UK (HDR UK), UK Medical Research Council (MRC), and Diabetes UK. SH works as a data scientist and data curator for NHS Digital, which holds and processes the data. MAM is supported by research funding from AstraZeneca, outside the submitted work. AH is employed by Institute of Health Informatics, University College London. CS reports grants from the Wellcome Trust, MRC, HDR UK, University of Edinburgh, UK Research and Innovation (UKRI), and the BHF, outside the submitted work; participates on the data safety monitoring board for TARDIS; and has leadership or fiduciary roles with Cancer Research UK Early Detection and Diagnosis Research Committee, UKRI Expert Review Panel for Longitudinal Health & Wellbeing National Core Study, NIHR/UKRI Long COVID call Funding Review Panel, Accelerated Access Collaborative/NIHR/NHSX Artificial Intelligence (AI) in Healthcare Awards Funding Panel, Wellcome Trust Biomedical Resources Award Funding Panel, MRC strategic review Advisory Group for Maximising the opportunities from data science for innovative biomedical research, MRC Data Science Strategy Advisory Group, UKRI Digital Health Research and Innovation Strategy Expert Group, MRC Strategic Review of Units and Centres Main Panel & Population Heath Panel, Wellcome Trust Science Funding Review External advisory group, MRC Methodology Research (Better Methods Better Research) Panel, REF 2021 Subpanel - Public Health, Health Services and Primary Care, Longitudinal Health & Wellbeing COVID-19 National Core Study Strategic Advisory Board, UK Government Clinical Research Recovery Resilience and Growth programme Clinical Trials Expert Group, UK Government Scientific Advisory Group & SAGE Task and Finish Advisory Group on mass population testing for COVID-19, Scottish Government Covid-19 Data Taskforce, BHF Data Science Centre Steering Group, Our Future Health Scientific Advisory Board, Imperial College UKRI Centre for Doctoral Training in AI for Healthcare External advisory board, Swansea University UKRI Centre for Doctoral Training in AI, Machine Learning & Advanced Computing External advisory board, HDR UK Science Strategy Board / Science and Infrastructure Delivery Group, University of Bristol MRC Integrative Epidemiology Unit Scientific Advisory Board, International evaluation panel for Danish National Biobank, H2020 IMI ROADMAP Steering Committee, and the STAT-PD Steering Committee. NS reports grants from AstraZeneca, Boehringer Ingelheim, Novartis, and Roche Diagnostics; and has received consulting fees from Afimmune, Amgen, AstraZeneca, Boehringer Ingelheim, Eli Lilly, Hanmi Pharmaceuticals, Merck Sharp & Dohme, Novartis, Novo Nordisk, Pfizer, and Sanofi, outside of the submitted work. WNW is supported by a Scottish senior clinical fellowship, Chief Scientist Office (SCAF/17/01), and the Stroke Association (SA CV 20\100018), has received consulting fees from Bayer; payment for expert testimony from UK courts; participates on the data safety monitoring or advisory board for PROTECT-U, CATIS, INTERACT-4, MOSES, and Bayer; has leadership of fiduciary roles with BIASP Scientific Committee; and is associate editor of Stroke. SD has received research funding from GlaxoSmithKline, Astra Zeneca, Bayer, and BenevolentAI. All other authors declare no competing interests
Figures
References
Publication types
MeSH terms
Grants and funding
- MR/L003120/1/MRC_/Medical Research Council/United Kingdom
- MC_PC_20059/MRC_/Medical Research Council/United Kingdom
- MC_UU_00019/4/MRC_/Medical Research Council/United Kingdom
- MR/S004149/2/MRC_/Medical Research Council/United Kingdom
- FS/11/38/28864/BHF_/British Heart Foundation/United Kingdom
- RG/18/13/33946/BHF_/British Heart Foundation/United Kingdom
- MC_UU_00019/1/MRC_/Medical Research Council/United Kingdom
- MR/T021780/1/MRC_/Medical Research Council/United Kingdom
- MR/L018942/1/MRC_/Medical Research Council/United Kingdom
- MC_UU_00019/2/MRC_/Medical Research Council/United Kingdom
- MC_PC_20030 /MRC_/Medical Research Council/United Kingdom
- MR/K006584/1/MRC_/Medical Research Council/United Kingdom
- MC_PC_19005/MRC_/Medical Research Council/United Kingdom
- RG/13/13/30194/BHF_/British Heart Foundation/United Kingdom
- MC_PC_20051/MRC_/Medical Research Council/United Kingdom
- FS/14/76/30933/BHF_/British Heart Foundation/United Kingdom
- 204841/Z/16/Z/WT_/Wellcome Trust/United Kingdom
- MC_PC_20058/MRC_/Medical Research Council/United Kingdom
- SP/19/3/34678/BHF_/British Heart Foundation/United Kingdom
- MR/S004149/1/MRC_/Medical Research Council/United Kingdom
- FS/18/5/33319/BHF_/British Heart Foundation/United Kingdom
- MC_UU_00004/08/MRC_/Medical Research Council/United Kingdom
- MC_PC_18029/MRC_/Medical Research Council/United Kingdom
- CH/17/1/32804/BHF_/British Heart Foundation/United Kingdom
- AA/18/6/24223/BHF_/British Heart Foundation/United Kingdom
LinkOut - more resources
Full Text Sources
Medical
Miscellaneous
