

Impact of extra-anatomical bypass on coarctation fluid dynamics using patient-specific lumped parameter and Lattice Boltzmann modeling
- PMID: 35690596
- PMCID: PMC9188592
- DOI: 10.1038/s41598-022-12894-y
Impact of extra-anatomical bypass on coarctation fluid dynamics using patient-specific lumped parameter and Lattice Boltzmann modeling
Abstract
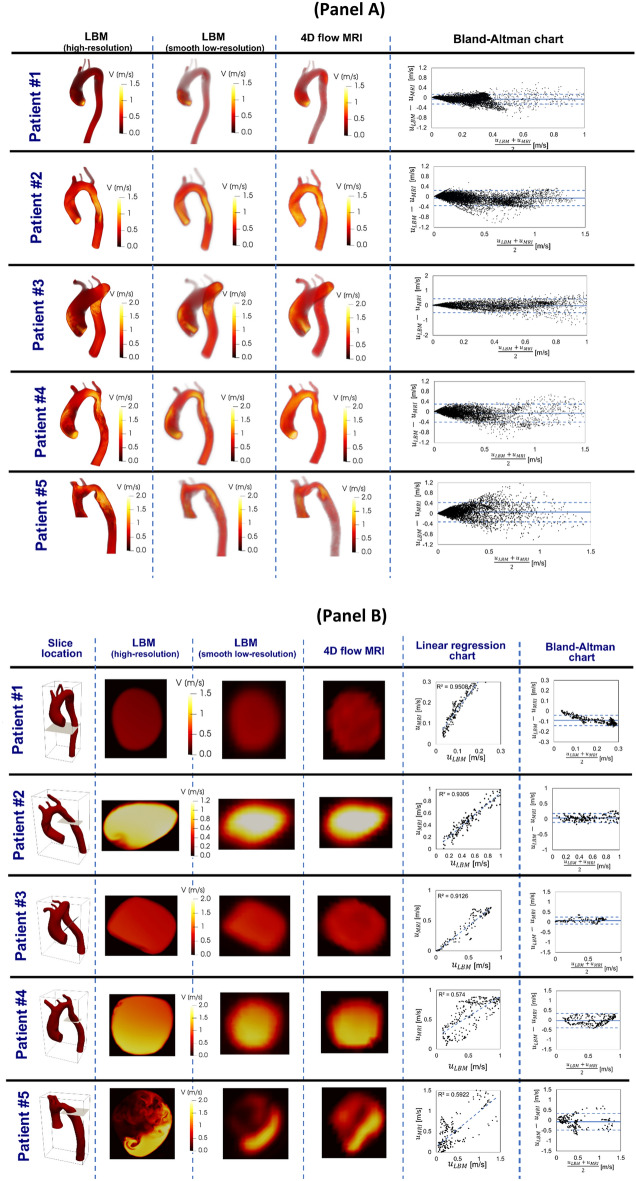
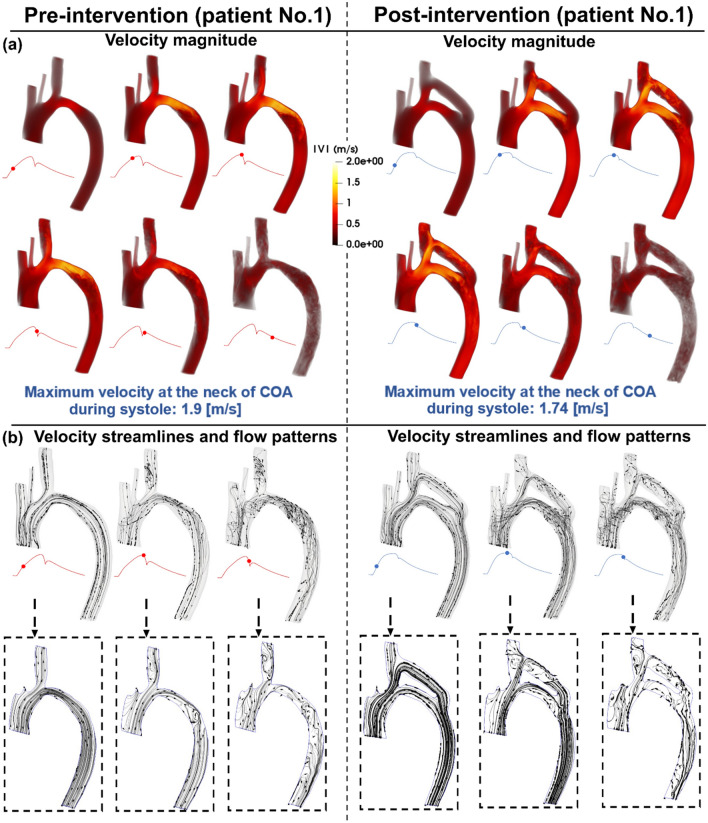
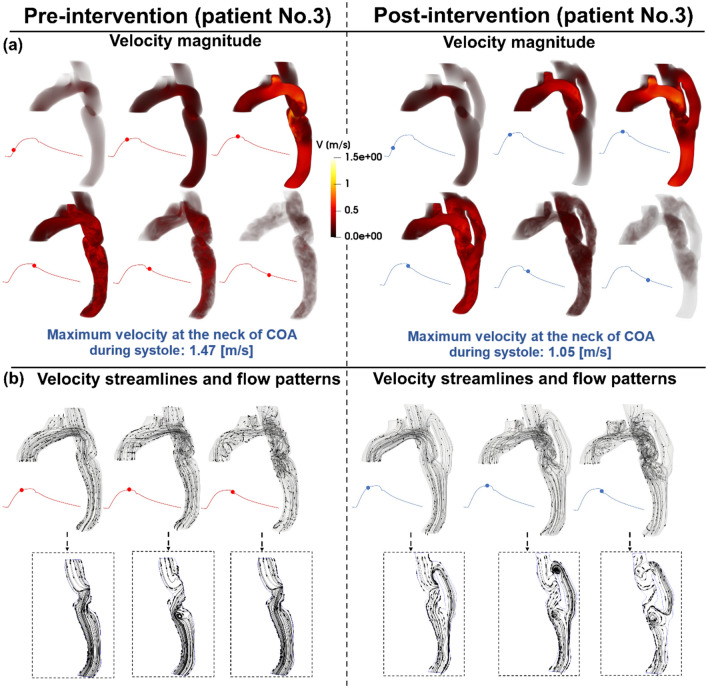
Accurate hemodynamic analysis is not only crucial for successful diagnosis of coarctation of the aorta (COA), but intervention decisions also rely on the hemodynamics assessment in both pre and post intervention states to minimize patient risks. Despite ongoing advances in surgical techniques for COA treatments, the impacts of extra-anatomic bypass grafting, a surgical technique to treat COA, on the aorta are not always benign. Our objective was to investigate the impact of bypass grafting on aortic hemodynamics. We investigated the impact of bypass grafting on aortic hemodynamics using a patient-specific computational-mechanics framework in three patients with COA who underwent bypass grafting. Our results describe that bypass grafting improved some hemodynamic metrics while worsened the others: (1) Doppler pressure gradient improved (decreased) in all patients; (2) Bypass graft did not reduce the flow rate substantially through the COA; (3) Systemic arterial compliance increased in patients #1 and 3 and didn't change (improve) in patient 3; (4) Hypertension got worse in all patients; (5) The flow velocity magnitude improved (reduced) in patient 2 and 3 but did not improve significantly in patient 1; (6) There were elevated velocity magnitude, persistence of vortical flow structure, elevated turbulence characteristics, and elevated wall shear stress at the bypass graft junctions in all patients. We concluded that bypass graft may lead to pseudoaneurysm formation and potential aortic rupture as well as intimal hyperplasia due to the persistent abnormal and irregular aortic hemodynamics in some patients. Moreover, post-intervention, exposures of endothelial cells to high shear stress may lead to arterial remodeling, aneurysm, and rupture.
© 2022. The Author(s).
Conflict of interest statement
The authors declare no competing interests.
Figures


Similar articles
-
Elimination of Transcoarctation Pressure Gradients Has No Impact on Left Ventricular Function or Aortic Shear Stress After Intervention in Patients With Mild Coarctation.JACC Cardiovasc Interv. 2016 Sep 26;9(18):1953-65. doi: 10.1016/j.jcin.2016.06.054. JACC Cardiovasc Interv. 2016. PMID: 27659574 Free PMC article.
-
Aortic hemodynamics in patients with and without repair of aortic coarctation: in vivo analysis by 4D flow-sensitive magnetic resonance imaging.Invest Radiol. 2011 May;46(5):317-25. doi: 10.1097/RLI.0b013e3182034fc2. Invest Radiol. 2011. PMID: 21285892
-
Reducing Morbidity and Mortality in Patients With Coarctation Requires Systematic Differentiation of Impacts of Mixed Valvular Disease on Coarctation Hemodynamics.J Am Heart Assoc. 2022 Jan 18;11(2):e022664. doi: 10.1161/JAHA.121.022664. Epub 2022 Jan 13. J Am Heart Assoc. 2022. PMID: 35023351 Free PMC article.
-
[Descending thoracic aorto-aortic bypass grafting for coarctation of the aorta in an adult combined with a cerebral arterial aneurysm--a case report].Nihon Kyobu Geka Gakkai Zasshi. 1993 Jul;41(7):1242-7. Nihon Kyobu Geka Gakkai Zasshi. 1993. PMID: 8376898 Japanese.
-
Computational Fluid Dynamics Modeling of Hemodynamic Parameters in the Human Diseased Aorta: A Systematic Review.Ann Vasc Surg. 2020 Feb;63:336-381. doi: 10.1016/j.avsg.2019.04.032. Epub 2019 Jul 22. Ann Vasc Surg. 2020. PMID: 31344467
Cited by
-
Reducing Long-Term Mortality Post Transcatheter Aortic Valve Replacement Requires Systemic Differentiation of Patient-Specific Coronary Hemodynamics.J Am Heart Assoc. 2023 Jun 6;12(11):e029310. doi: 10.1161/JAHA.123.029310. Epub 2023 May 26. J Am Heart Assoc. 2023. PMID: 37232234 Free PMC article.
-
[Ventricular pressure-volume loop and other heart-function metrics can elucidate etiology of failure of TAVI and interventions].REC Interv Cardiol. 2024 Apr 8;6(3):153-155. doi: 10.24875/RECIC.M23000440. eCollection 2024 Jul-Sep. REC Interv Cardiol. 2024. PMID: 40415781 Free PMC article. Spanish. No abstract available.
-
Stress Load and Ascending Aortic Aneurysms: An Observational, Longitudinal, Single-Center Study Using Computational Fluid Dynamics.Bioengineering (Basel). 2024 Feb 22;11(3):204. doi: 10.3390/bioengineering11030204. Bioengineering (Basel). 2024. PMID: 38534478 Free PMC article.
-
Long-term prognostic impact of paravalvular leakage on coronary artery disease requires patient-specific quantification of hemodynamics.Sci Rep. 2022 Dec 9;12(1):21357. doi: 10.1038/s41598-022-21104-8. Sci Rep. 2022. PMID: 36494362 Free PMC article.
-
Early Detection of Risk of Neo-Sinus Blood Stasis Post-Transcatheter Aortic Valve Replacement Using Personalized Hemodynamic Analysis.Struct Heart. 2023 Apr 28;7(5):100180. doi: 10.1016/j.shj.2023.100180. eCollection 2023 Sep. Struct Heart. 2023. PMID: 37745677 Free PMC article.
References
Publication types
MeSH terms
LinkOut - more resources
Full Text Sources
