. 2022 Jun 11;13(1):3366.
doi: 10.1038/s41467-022-31043-7.

Modest volcanic SO2 emissions from the Indonesian archipelago

Affiliations

Modest volcanic SO2 emissions from the Indonesian archipelago

Philipson Bani et al. Nat Commun. .

Abstract

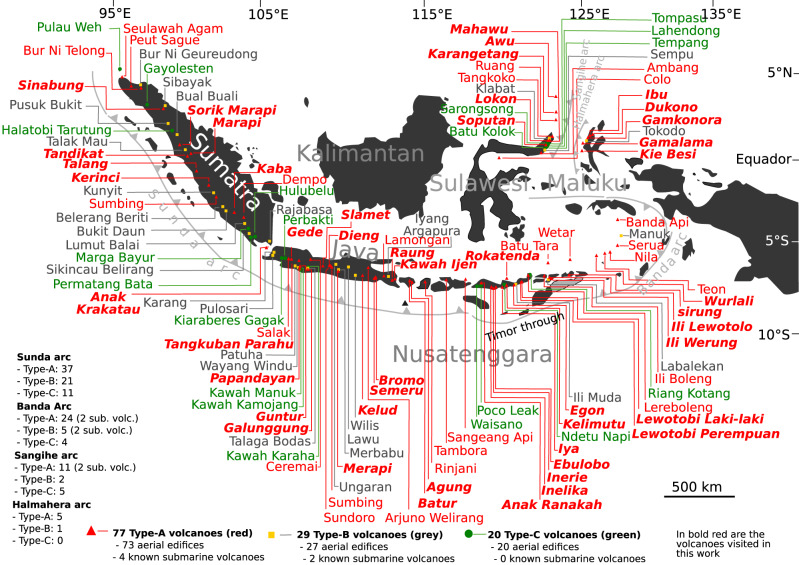
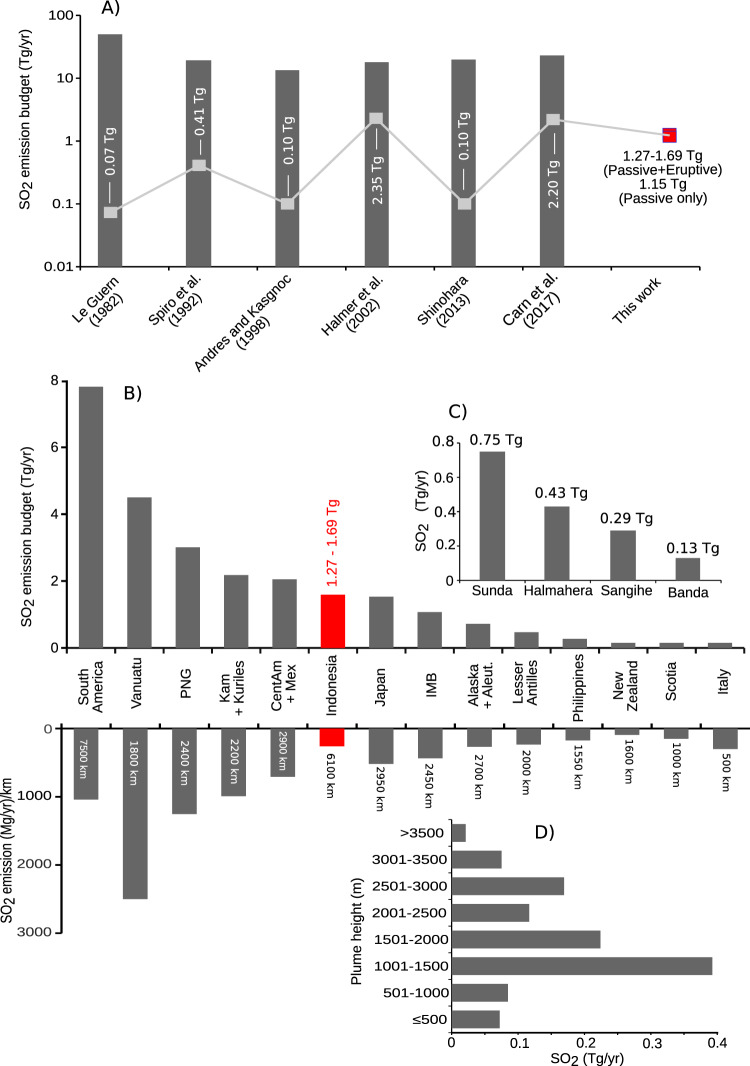
Indonesia hosts the largest number of active volcanoes, several of which are renowned for climate-changing historical eruptions. This pedigree might suggest a substantial fraction of global volcanic sulfur emissions from Indonesia and are intrinsically driven by sulfur-rich magmas. However, a paucity of observations has hampered evaluation of these points-many volcanoes have hitherto not been subject to emissions measurements. Here we report new gas measurements from Indonesian volcanoes. The combined SO2 output amounts to 1.15 ± 0.48 Tg/yr. We estimate an additional time-averaged SO2 yield of 0.12-0.54 Tg/yr for explosive eruptions, indicating a total SO2 inventory of 1.27-1.69 Tg/yr for Indonesian. This is comparatively modest-individual volcanoes such as Etna have sustained higher fluxes. To understand this paradox, we compare the geodynamic, petrologic, magma dynamical and shallow magmatic-hydrothermal processes that influence the sulfur transfer to the atmosphere. Results reinforce the idea that sulfur-rich eruptions reflect long-term accumulation of volatiles in the reservoirs.


Conflict of interest statement

The authors have no competing interests.

Figures

Fig. 1
Fig. 1. Indonesian active volcanoes.
The distribution of the 126 active volcanoes across the archipelago of Indonesia, including 120 aerial and six known submarine edifices (not shown on the map). 77 are classified as Type-A (red triangles), 29 as type-B (yellow squares) and 20 as type-C (green circles) The volcanoes visited in this work are highlighted in red-bold-italic.
Fig. 2
Fig. 2. The main volcanic degassing points of Indonesia.
The SO2 emission rates across the four volcanic arcs of Indonesia highlight the Sunda arc as the largest SO2 contributor and Dukono is the strongest individual source. The question marks (?) denote the unmeasured sources and the error bars correspond to standard deviation.
Fig. 3
Fig. 3. The explosive SO2 released per volcano over the period of 2010–2020.
The names of the volcanoes that erupted over the decade are grouped by arc. The SO2 mass per volcano obtained from satellite data are displayed on the left column whilst the right column shows the SO2 amount obtained from the VEIs. The 0 Tg correspond to undetected eruptive emission by satellite sensors. The color code differentiates the years of observation and the height corresponds to the amount of SO2 released per year. The number of eruptions per volcano is provided above each SO2 mass value on the left column. Note that Dukono exhibits a continuous eruptive manifestation but only the largest event with ash fall on the nearby cities are considered.
Fig. 4
Fig. 4. The new SO2 flux results compared to other estimates.
A Estimates of the global volcanic SO2 inventory that include contributions from Indonesian volcanoes, highlighted by gray square with the corresponding values. B The Indonesian SO2 emission budget compared with other arcs (data from ref. ). The annual SO2 emission per km of each arc are shown for comparison. C The SO2 emission budgets from the four Indonesian arcs. D Strength of passive SO2 emissions by altitude (in 500-m bins) from the observations reported in Table 3.
Fig. 5
Fig. 5. Sulfur content in fluids and melt inclusions versus SO2 fluxes.
A Variation of the sulfur content of volcanic fluids (XSTotal = XSO2 + XH2S) with the measured SO2 flux along the Indonesian arc. References for fluid compositions are from Allard et al. 1981 (Krakatau); Poorter al. 1989 (Lowotolo); Giggenbach et al. 2001 (Merapi, Tangkuban Parahu, Papandayan); Clor et al. 2005 (Soputan); Aiuppa et al. 2015 (Bromo); Gunawan et al. 2017 (Kawah Ijen); Bani et al. 2017 (Sirung); Bani et al. 2017 (Dukono); Saing et al. 2020 (Gamkonora); Kunrat et al. 2020 (Gamalama); Bani et al. 2020 (Awu). B The record of sulfur in melt inclusions along the Indonesian arc in respect to the main degassing sources. C Relationships between the maximum sulfur content analysed in melt inclusions (MI) and the measured SO2 flux. Note, we did not find melt inclusion values for data points with zero SO2 flux and conversely. References for MI are: Vidal et al., 2016 (Rinjani); Mandeville et al., 1996 (Krakatau); Bani et al., 2017 (Dukono); Preece et al., 2014 (Merapi); de Hoog et al. 2001 (Guntur, Ili Boleng); Vigouroux et al. 2012 (Kawah Ijen, Galunggung, Tambora); Self and King, 1996 (Agung); Self et al. 2004 (Tambora), Kunrat, 2017 (Soputan).

References

    1. Oppenheimer, C. 3.04—Volcanic Degassing. In Treatise on Geochemistry (eds. Holland, H. D. & Turekian, K. K.) 123–166 (Pergamon, 2003). 10.1016/B0-08-043751-6/03020-6.
    1. Grainger RG, Highwood EJ. Changes in stratospheric composition, chemistry, radiation and climate caused by volcanic eruptions. Geol. Soc. Lond. Spec. Publ. 2003;213:329–347. doi: 10.1144/GSL.SP.2003.213.01.20. - DOI
    1. Carn SA, Fioletov VE, McLinden CA, Li C, Krotkov NA. A decade of global volcanic SO 2 emissions measured from space. Sci. Rep. 2017;7:44095. doi: 10.1038/srep44095. - DOI - PMC - PubMed
    1. Clarisse L, et al. Retrieval of sulphur dioxide from the infrared atmospheric sounding interferometer (IASI) Atmos. Meas. Tech. 2012;5:581–594. doi: 10.5194/amt-5-581-2012. - DOI
    1. McGonigle AJS. Volcano remote sensing with ground-based spectroscopy. Philos. Trans. R. Soc. Math. Phys. Eng. Sci. 2005;363:2915–2929. - PubMed