

Quantitative digital histopathology and machine learning to predict pathological complete response to chemotherapy in breast cancer patients using pre-treatment tumor biopsies
- PMID: 35690630
- PMCID: PMC9188550
- DOI: 10.1038/s41598-022-13917-4
Quantitative digital histopathology and machine learning to predict pathological complete response to chemotherapy in breast cancer patients using pre-treatment tumor biopsies
Abstract
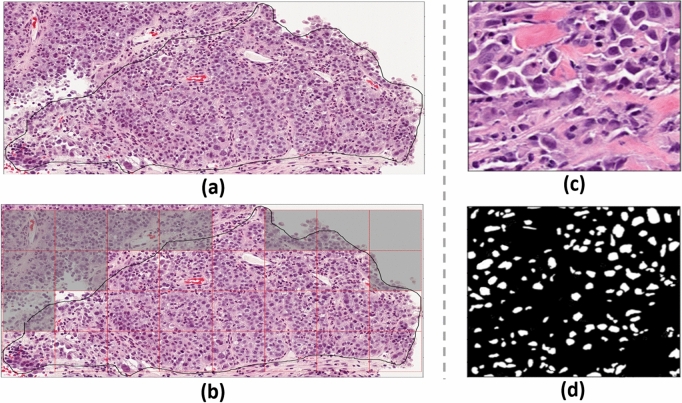
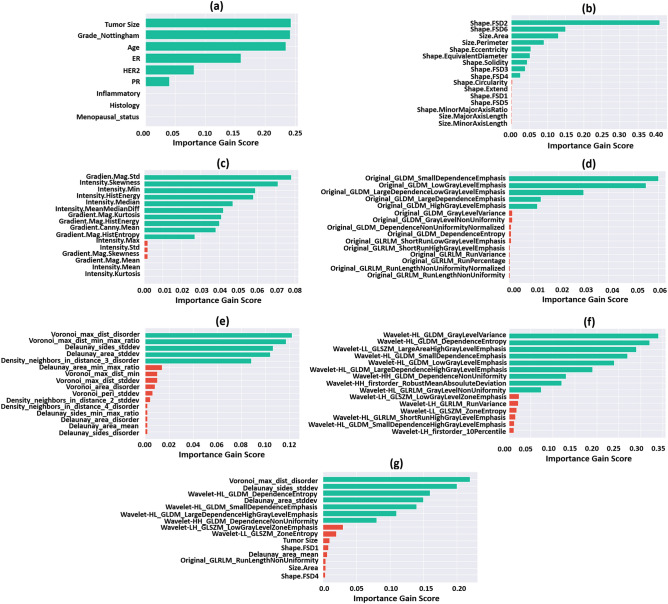
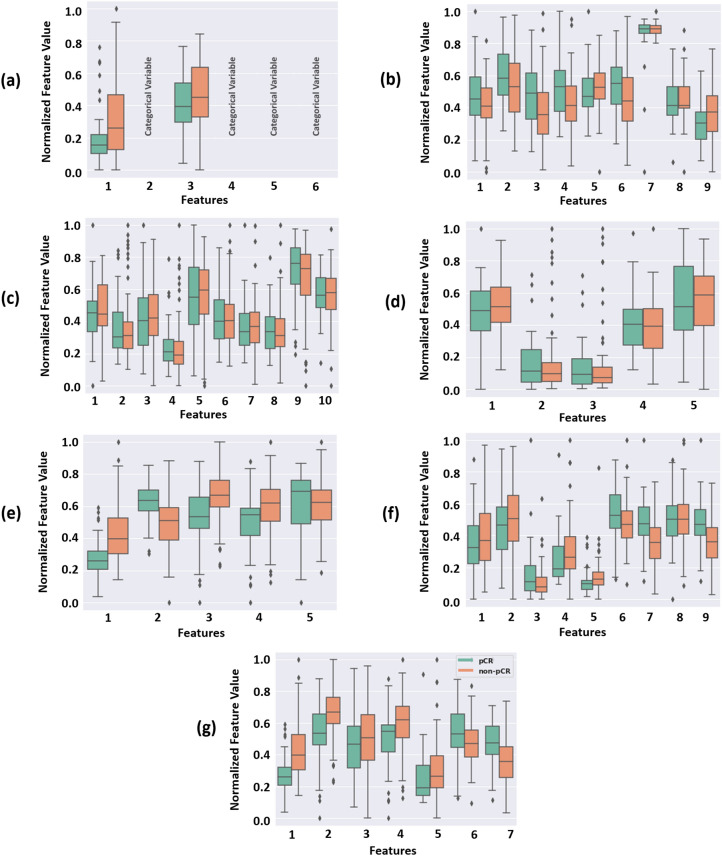
Complete pathological response (pCR) to neoadjuvant chemotherapy (NAC) is a prognostic factor for breast cancer (BC) patients and is correlated with improved survival. However, pCR rates are variable to standard NAC, depending on BC subtype. This study investigates quantitative digital histopathology coupled with machine learning (ML) to predict NAC response a priori. Clinicopathologic data and digitized slides of BC core needle biopsies were collected from 149 patients treated with NAC. The nuclei within the tumor regions were segmented on the histology images of biopsy samples using a weighted U-Net model. Five pathomic feature subsets were extracted from segmented digitized samples, including the morphological, intensity-based, texture, graph-based and wavelet features. Seven ML experiments were conducted with different feature sets to develop a prediction model of therapy response using a gradient boosting machine with decision trees. The models were trained and optimized using a five-fold cross validation on the training data and evaluated using an unseen independent test set. The prediction model developed with the best clinical features (tumor size, tumor grade, age, and ER, PR, HER2 status) demonstrated an area under the ROC curve (AUC) of 0.73. Various pathomic feature subsets resulted in models with AUCs in the range of 0.67 and 0.87, with the best results associated with the graph-based and wavelet features. The selected features among all subsets of the pathomic and clinicopathologic features included four wavelet and three graph-based features and no clinical features. The predictive model developed with these features outperformed the other models, with an AUC of 0.90, a sensitivity of 85% and a specificity of 82% on the independent test set. The results demonstrated the potential of quantitative digital histopathology features integrated with ML methods in predicting BC response to NAC. This study is a step forward towards precision oncology for BC patients to potentially guide future therapies.
© 2022. The Author(s).
Conflict of interest statement
The authors declare no competing interests.
Figures

Similar articles
-
A hierarchical self-attention-guided deep learning framework to predict breast cancer response to chemotherapy using pre-treatment tumor biopsies.Med Phys. 2023 Dec;50(12):7852-7864. doi: 10.1002/mp.16574. Epub 2023 Jul 5. Med Phys. 2023. PMID: 37403567
-
Digital image analysis and machine learning-assisted prediction of neoadjuvant chemotherapy response in triple-negative breast cancer.Breast Cancer Res. 2024 Jan 18;26(1):12. doi: 10.1186/s13058-023-01752-y. Breast Cancer Res. 2024. PMID: 38238771 Free PMC article.
-
Predicting the efficacy of neoadjuvant chemotherapy in breast cancer patients based on ultrasound longitudinal temporal depth network fusion model.Breast Cancer Res. 2025 Feb 27;27(1):30. doi: 10.1186/s13058-025-01971-5. Breast Cancer Res. 2025. PMID: 40016785 Free PMC article.
-
A nomogram to predict pathologic complete response (pCR) and the value of tumor-infiltrating lymphocytes (TILs) for prediction of response to neoadjuvant chemotherapy (NAC) in breast cancer patients.Breast Cancer Res Treat. 2019 Jan;173(2):255-266. doi: 10.1007/s10549-018-4981-x. Epub 2018 Oct 15. Breast Cancer Res Treat. 2019. PMID: 30324273 Review.
-
Ki67 and lymphocytes in the pretherapeutic core biopsy of primary invasive breast cancer: positive markers of therapy response prediction and superior survival.Horm Mol Biol Clin Investig. 2017 Sep 22;32(2):/j/hmbci.2017.32.issue-2/hmbci-2017-0022/hmbci-2017-0022.xml. doi: 10.1515/hmbci-2017-0022. Horm Mol Biol Clin Investig. 2017. PMID: 28937963 Review.
Cited by
-
Prognostic significance of TNFRSF4 expression and development of a pathomics model to predict expression in hepatocellular carcinoma.Heliyon. 2024 May 24;10(11):e31882. doi: 10.1016/j.heliyon.2024.e31882. eCollection 2024 Jun 15. Heliyon. 2024. PMID: 38841483 Free PMC article.
-
Establishment of two pathomic-based machine learning models to predict CLCA1 expression in colon adenocarcinoma.PLoS One. 2025 Jul 21;20(7):e0328220. doi: 10.1371/journal.pone.0328220. eCollection 2025. PLoS One. 2025. PMID: 40690457 Free PMC article.
-
Predicting CTLA4 expression and prognosis in clear cell renal cell carcinoma using a pathomics signature of histopathological images and machine learning.Heliyon. 2024 Jul 18;10(15):e34877. doi: 10.1016/j.heliyon.2024.e34877. eCollection 2024 Aug 15. Heliyon. 2024. PMID: 39145002 Free PMC article.
-
Predicting prognosis in lung adenocarcinoma by predicting TIGIT expression: a pathomics model.J Thorac Dis. 2024 Nov 30;16(11):7617-7629. doi: 10.21037/jtd-24-978. Epub 2024 Nov 29. J Thorac Dis. 2024. PMID: 39678866 Free PMC article.
-
Integrative radiopathomics model for predicting progression-free survival in patients with nonmetastatic nasopharyngeal carcinoma.J Cancer Res Clin Oncol. 2024 Sep 9;150(9):415. doi: 10.1007/s00432-024-05930-z. J Cancer Res Clin Oncol. 2024. PMID: 39249584 Free PMC article.
References
-
- Ahmad, A. Breast cancer statistics: Recent trends. in Breast Cancer Metastasis and Drug Resistance. Advances in Experimental Medicine and Biology pp. 1–7 (Springer, 2019). - PubMed
Publication types
MeSH terms
LinkOut - more resources
Full Text Sources
Medical
Research Materials
Miscellaneous
