

Integrative analysis of cell adhesion molecules in glioblastoma identified prostaglandin F2 receptor inhibitor (PTGFRN) as an essential gene
- PMID: 35690717
- PMCID: PMC9188228
- DOI: 10.1186/s12885-022-09682-2
Integrative analysis of cell adhesion molecules in glioblastoma identified prostaglandin F2 receptor inhibitor (PTGFRN) as an essential gene
Abstract
Background: Glioblastoma (GBM) is the most common primary malignant brain tumor in adults exhibiting infiltration into surrounding tissues, recurrence, and resistance to therapy. GBM infiltration is accomplished by many deregulated factors such as cell adhesion molecules (CAMs), which are membrane proteins that participate in cell-cell and cell-ECM interactions to regulate survival, proliferation, migration, and stemness.
Methods: A comprehensive bioinformatics analysis of CAMs (n = 518) in multiple available datasets revealed genetic and epigenetic alterations among CAMs in GBM. Univariate Cox regression analysis using TCGA dataset identified 127 CAMs to be significantly correlated with survival. The poor prognostic indicator PTGFRN was chosen to study its role in glioma. Silencing of PTGFRN in glioma cell lines was achieved by the stable expression of short hairpin RNA (shRNA) against the PTGFRN gene. PTGFRN was silenced and performed cell growth, migration, invasion, cell cycle, and apoptosis assays. Neurosphere and limiting dilution assays were also performed after silencing of PTGFRN in GSCs.
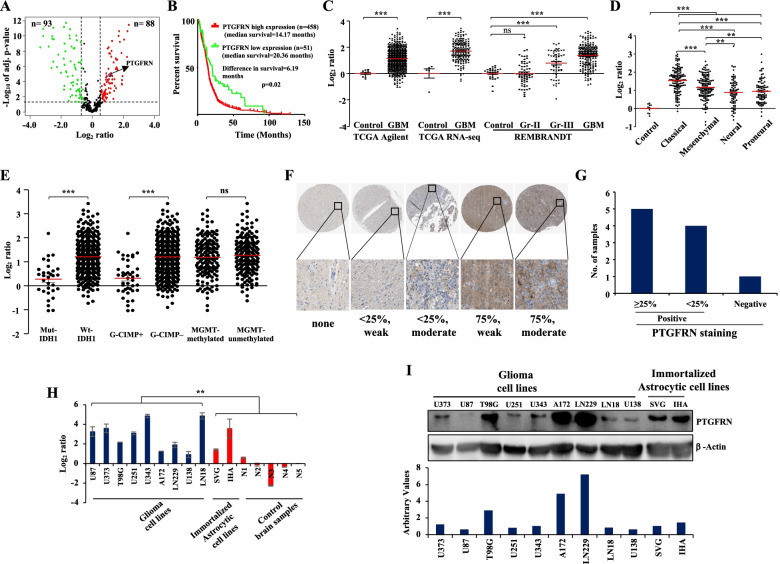
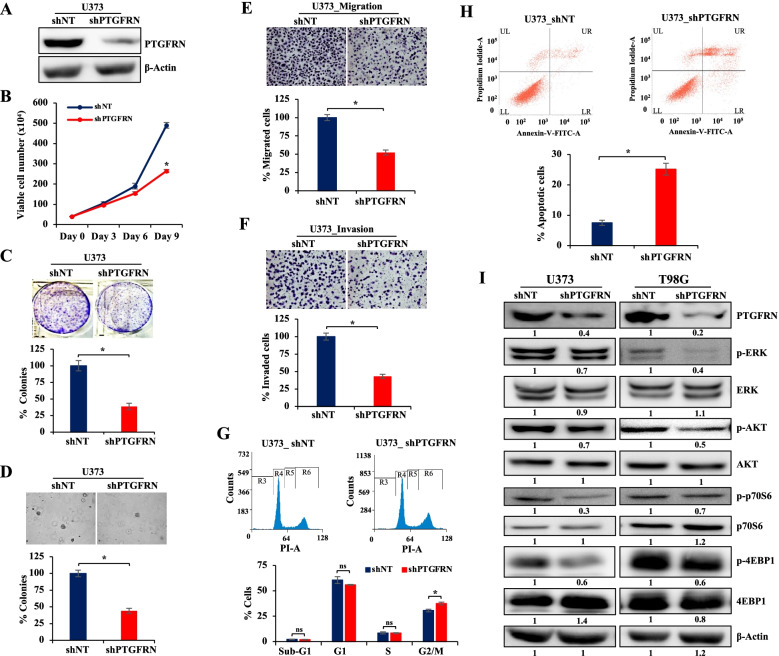
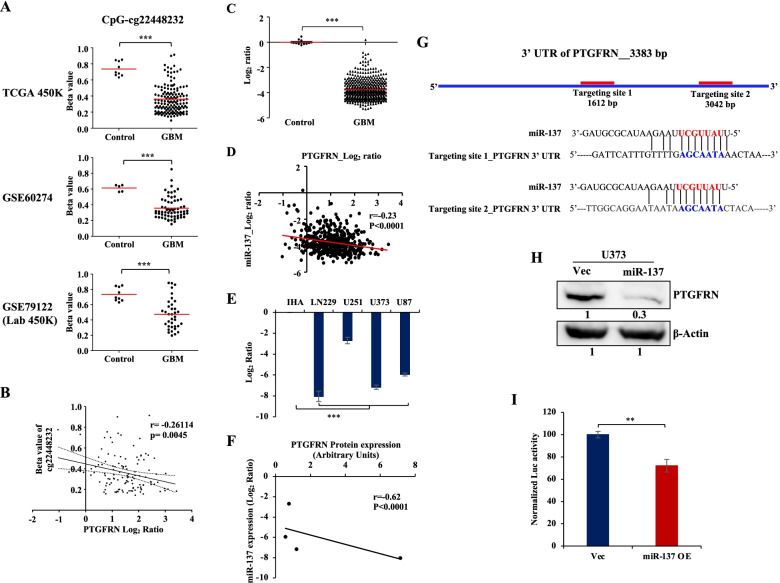
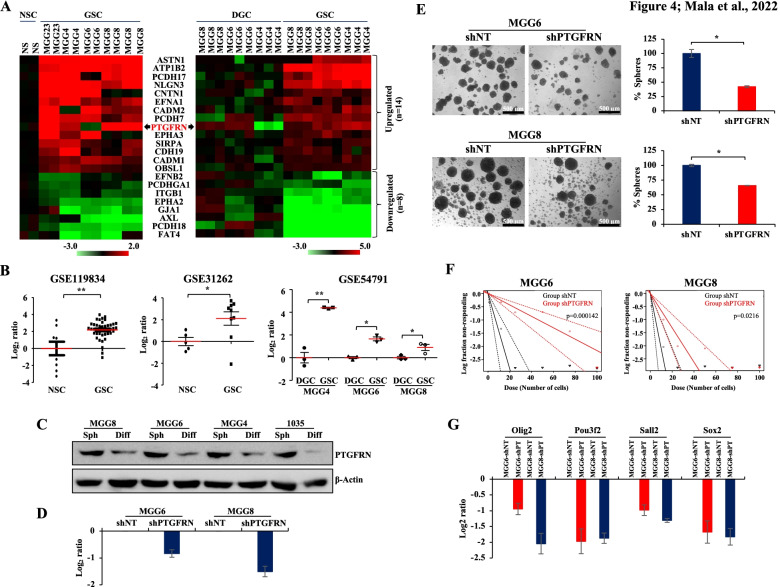
Results: Among the differentially regulated CAMs (n = 181, 34.9%), major proportion of them were found to be regulated by miRNAs (n = 95, 49.7%) followed by DNA methylation (n = 32, 16.7%), and gene copy number variation (n = 12, 6.2%). We found that PTGFRN to be upregulated in GBM tumor samples and cell lines with a significant poor prognostic correlation with patient survival. Silencing PTGFRN diminished cell growth, colony formation, anchorage-independent growth, migration, and invasion and led to cell cycle arrest and induction of apoptosis. At the mechanistic level, silencing of PTGFRN reduced pro-proliferative and promigratory signaling pathways such as ERK, AKT, and mTOR. PTGFRN upregulation was found to be due to the loss of its promoter methylation and downregulation of miR-137 in GBM. PTGFRN was also found to be higher in glioma stem-like cells (GSCs) than the matched differentiated glioma cells (DGCs) and is required for GSC growth and survival. Silencing of PTGFRN in GSCs reduced transcript levels of reprogramming factors (Olig2, Pou3f2, Sall2, and Sox2).
Conclusion: In this study, we provide a comprehensive overview of the differential regulation of CAMs and the probable causes for their deregulation in GBM. We also establish an oncogenic role of PTGFRN and its regulation by miR-137 in GBM, thus signifying it as a potential therapeutic target.
Keywords: CAM; GSC; Glioblastoma; Growth; Migration; PTGFRN; miR-137.
© 2022. The Author(s).
Conflict of interest statement
Authors have declared no competing interests.
Figures
Similar articles
-
Mir-370-3p Impairs Glioblastoma Stem-Like Cell Malignancy Regulating a Complex Interplay between HMGA2/HIF1A and the Oncogenic Long Non-Coding RNA (lncRNA) NEAT1.Int J Mol Sci. 2020 May 20;21(10):3610. doi: 10.3390/ijms21103610. Int J Mol Sci. 2020. PMID: 32443824 Free PMC article.
-
MicroRNA-137 is downregulated in glioblastoma and inhibits the stemness of glioma stem cells by targeting RTVP-1.Oncotarget. 2013 May;4(5):665-76. doi: 10.18632/oncotarget.928. Oncotarget. 2013. PMID: 23714687 Free PMC article.
-
Hypoxia-inducible miR-196a modulates glioblastoma cell proliferation and migration through complex regulation of NRAS.Cell Oncol (Dordr). 2021 Apr;44(2):433-451. doi: 10.1007/s13402-020-00580-y. Epub 2021 Jan 19. Cell Oncol (Dordr). 2021. PMID: 33469841
-
Serine/threonine/tyrosine-interacting-like protein 1 (STYXL1), a pseudo phosphatase, promotes oncogenesis in glioma.Biochem Biophys Res Commun. 2019 Jul 12;515(1):241-247. doi: 10.1016/j.bbrc.2019.05.093. Epub 2019 May 27. Biochem Biophys Res Commun. 2019. PMID: 31146910 Review.
-
Insights Into the Role of Bmi-1 Deregulation in Promoting Stemness and Therapy Resistance in Glioblastoma: A Narrative Review.Cancer Med. 2025 Jan;14(1):e70566. doi: 10.1002/cam4.70566. Cancer Med. 2025. PMID: 39791545 Free PMC article. Review.
Cited by
-
Pericyte-Glioblastoma Cell Interaction: A Key Target to Prevent Glioblastoma Progression.Cells. 2023 May 5;12(9):1324. doi: 10.3390/cells12091324. Cells. 2023. PMID: 37174724 Free PMC article. Review.
-
Prostaglandin F2 receptor negative regulator as a potential target for chimeric antigen receptor-T cell therapy for glioblastoma.Cancer Immunol Immunother. 2025 Mar 6;74(4):136. doi: 10.1007/s00262-025-03979-4. Cancer Immunol Immunother. 2025. PMID: 40047938 Free PMC article.
-
Food Allergy Genetics and Epigenetics: A Review of Genome-Wide Association Studies.Allergy. 2025 Jan;80(1):106-131. doi: 10.1111/all.16429. Epub 2024 Dec 19. Allergy. 2025. PMID: 39698764 Free PMC article. Review.
-
MicroRNA-150-3p enhances the antitumour effects of CGP57380 and is associated with a favourable prognosis in non-small cell lung cancer.Sci Rep. 2025 Jan 15;15(1):1973. doi: 10.1038/s41598-025-85793-7. Sci Rep. 2025. PMID: 39809860 Free PMC article.
-
Impact of immunosuppressants on tumor pulmonary metastasis: new insight into transplantation for hepatocellular carcinoma.Cancer Biol Med. 2024 Dec 24;21(11):1033-49. doi: 10.20892/j.issn.2095-3941.2024.0267. Cancer Biol Med. 2024. PMID: 39718153 Free PMC article. Review.
References
Publication types
MeSH terms
Substances
LinkOut - more resources
Full Text Sources
Medical
Research Materials
Miscellaneous
