. 2022 Jun 11;19(1):139.
doi: 10.1186/s12974-022-02499-7.

Persistent cortical and white matter inflammation after therapeutic hypothermia for ischemia in near-term fetal sheep

Affiliations

Persistent cortical and white matter inflammation after therapeutic hypothermia for ischemia in near-term fetal sheep

Kelly Q Zhou et al. J Neuroinflammation. .

Abstract

Background: Therapeutic hypothermia significantly improves outcomes after moderate-severe hypoxic-ischemic encephalopathy (HIE), but it is partially effective. Although hypothermia is consistently associated with reduced microgliosis, it is still unclear whether it normalizes microglial morphology and phenotype.

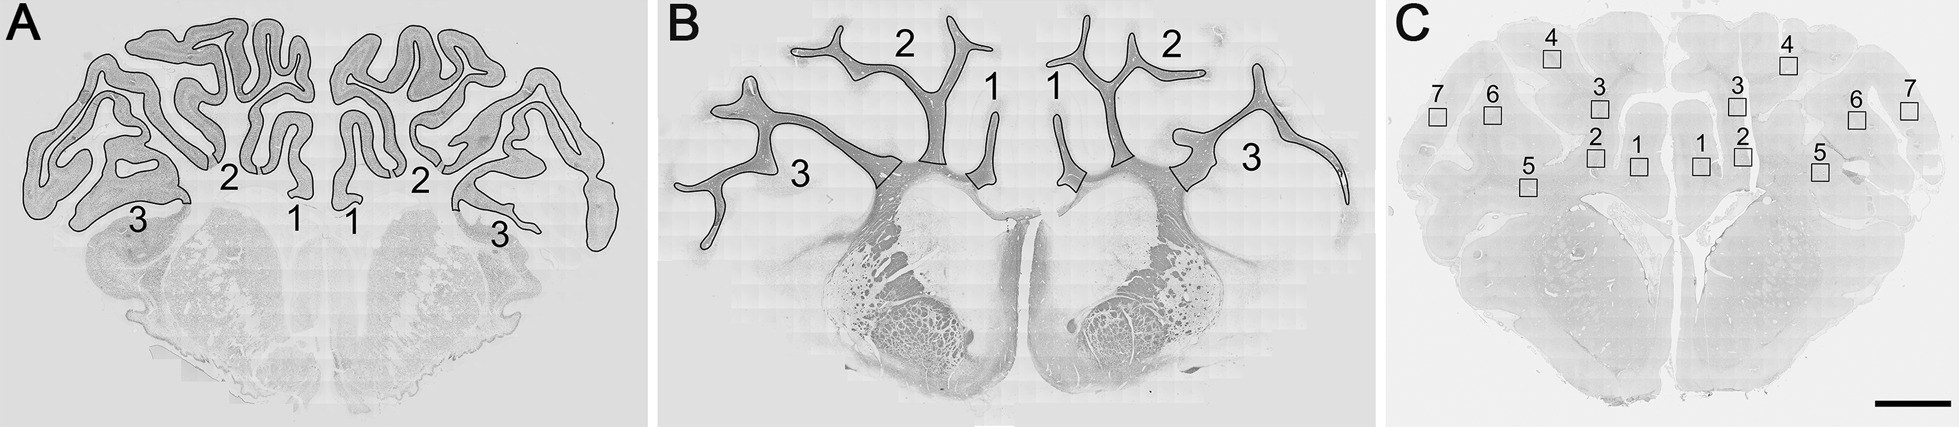
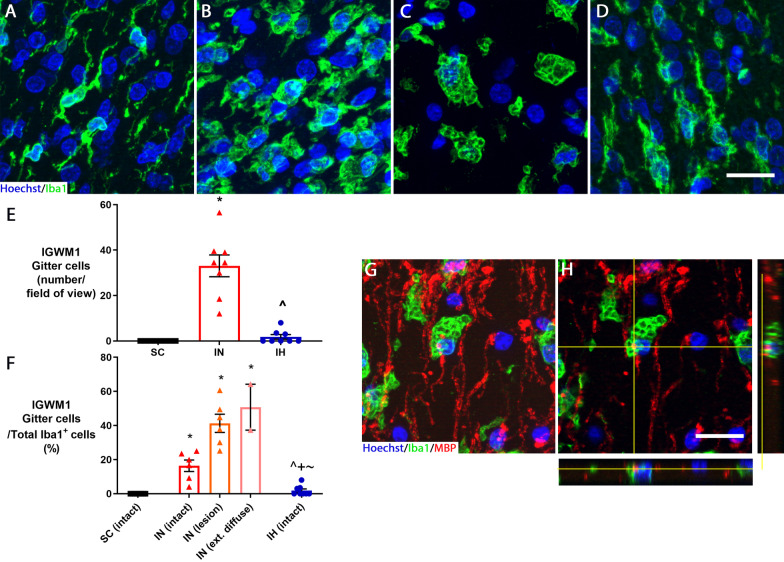
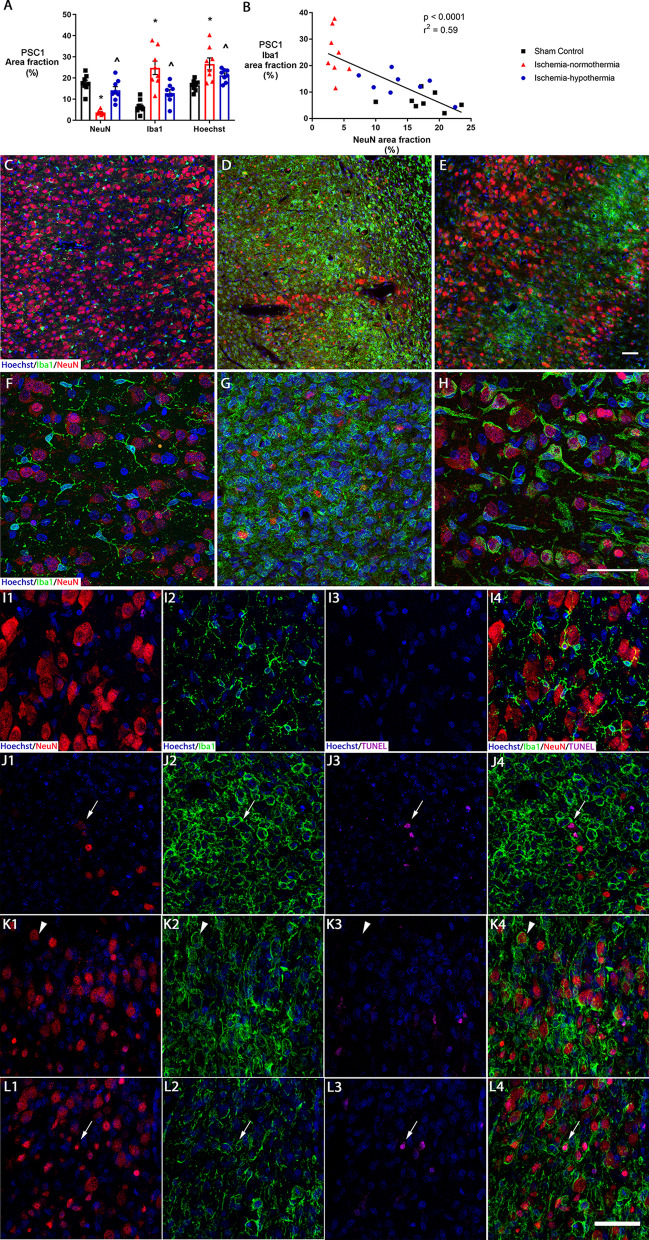
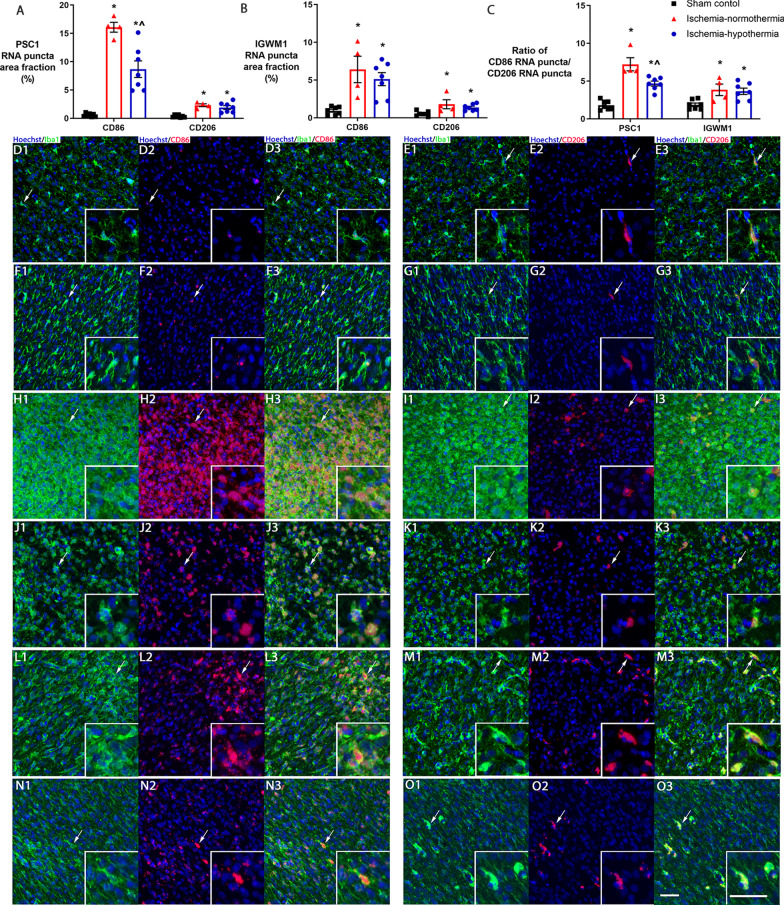
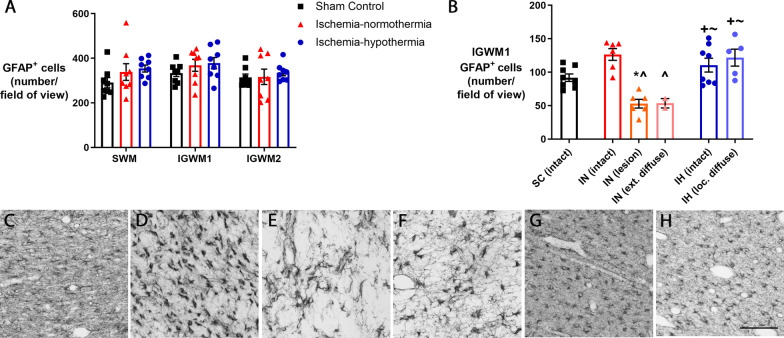
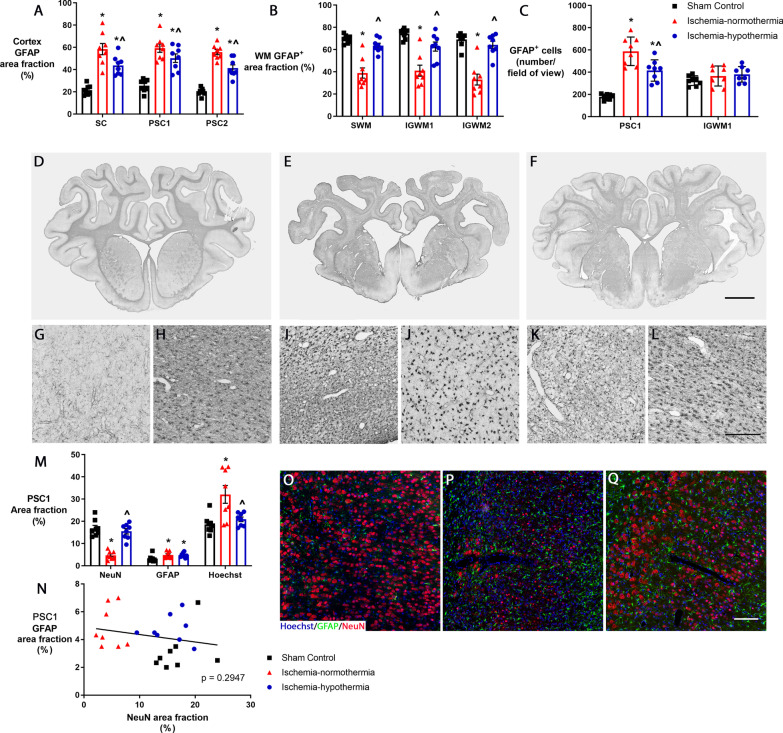
Methods: Near-term fetal sheep (n = 24) were randomized to sham control, ischemia-normothermia, or ischemia-hypothermia. Brain sections were immunohistochemically labeled to assess neurons, microglia and their interactions with neurons, astrocytes, myelination, and gitter cells (microglia with cytoplasmic lipid granules) 7 days after cerebral ischemia. Lesions were defined as areas with complete loss of cells. RNAscope® was used to assess microglial phenotype markers CD86 and CD206.

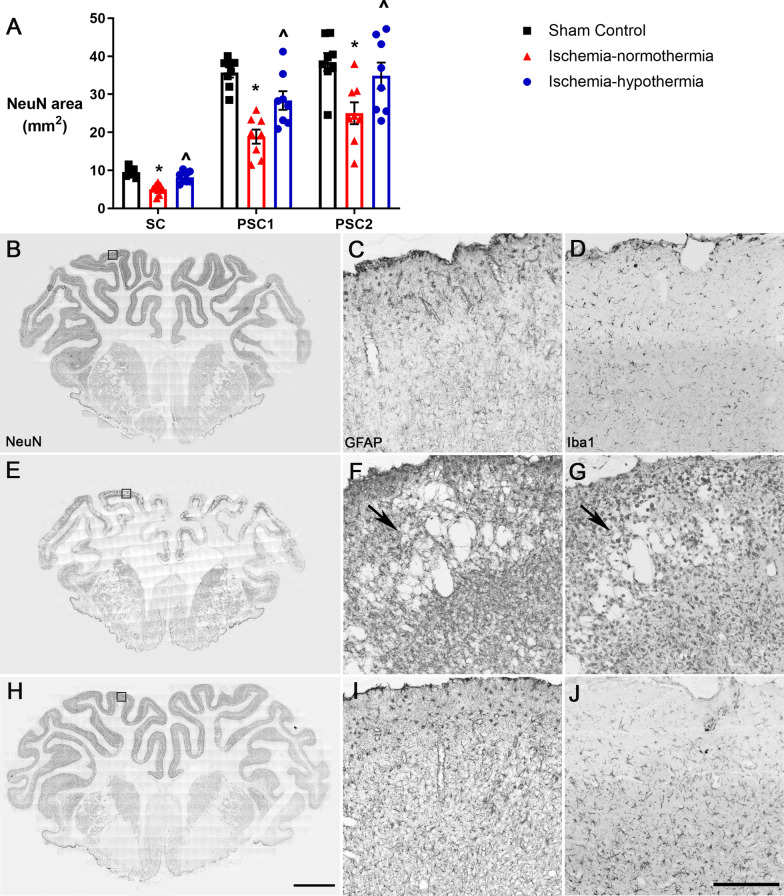
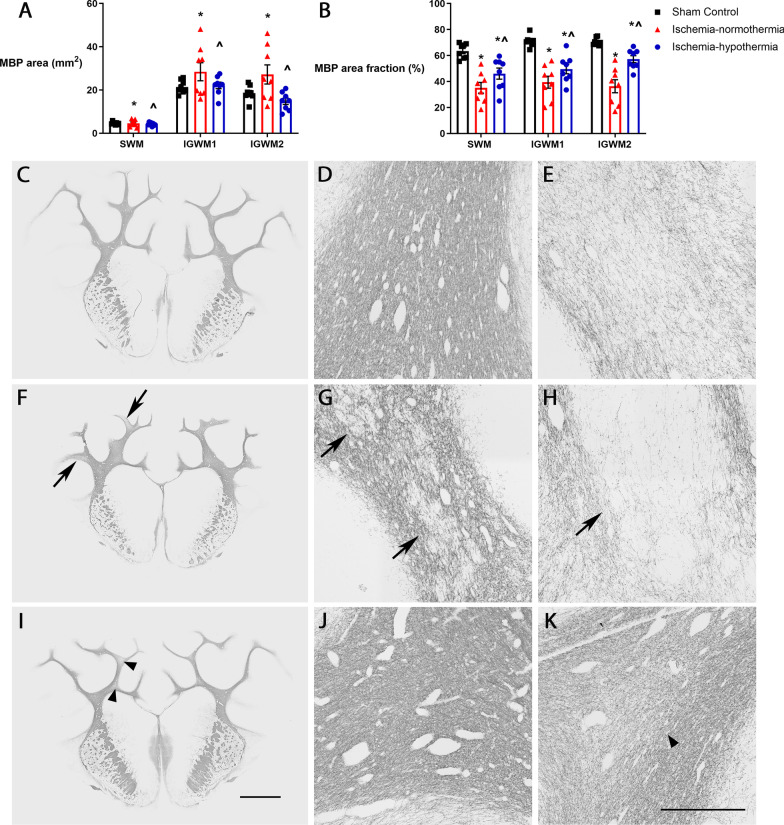
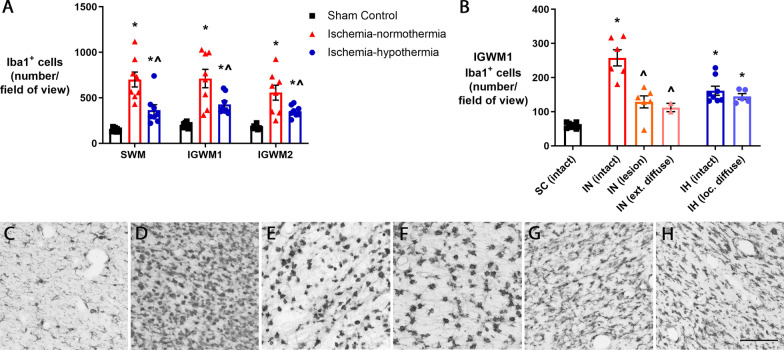
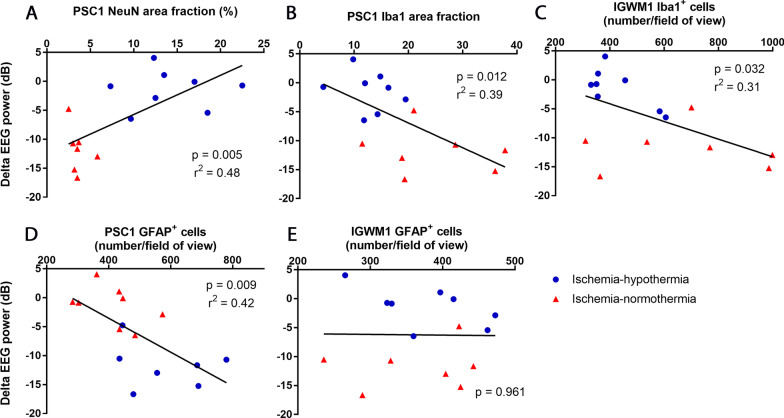
Results: Ischemia-normothermia was associated with severe loss of neurons and myelin (p < 0.05), with extensive lesions, astrogliosis and microgliosis with a high proportion of gitter cells (p < 0.05). Microglial wrapping of neurons was present in both the ischemia groups. Hypothermia improved neuronal survival, suppressed lesions, gitter cells and gliosis (p < 0.05), and attenuated the reduction of myelin area fraction. The "M1" marker CD86 and "M2" marker CD206 were upregulated after ischemia. Hypothermia partially suppressed CD86 in the cortex only (p < 0.05), but did not affect CD206.

Conclusions: Hypothermia prevented lesions after cerebral ischemia, but only partially suppressed microglial wrapping and M1 marker expression. These data support the hypothesis that persistent upregulation of injurious microglial activity may contribute to partial neuroprotection after hypothermia, and that immunomodulation after rewarming may be an important therapeutic target.

Keywords: Electroencephalogram; Gitter cells; Hypoxia-ischemia; Microglial phenotype; Neuroinflammation; Therapeutic hypothermia.


Conflict of interest statement

The authors declare that they have no competing interests.

Figures

Fig. 1
Fig. 1
Diagram of tracing and imaging areas. A The NeuN areas traced for area fraction and area measurements for the cortex of the (1) sagittal, (2) first parasagittal and (3) second parasagittal gyri. B The MBP areas traced for area fraction and area measurements for the intragyral white matter of the (1) sagittal, (2) first parasagittal and (3) the second parasagittal gyri. C The locations of where images were extracted for counting for (1) the intragyral white matter of the sagittal gyrus (2) the base and (3) the middle and (4) the top of the intragyral white matter of the first parasagittal gyrus and (5) the base, (6) the middle and (7) the top of the intragyral white matter of the second parasagittal gyrus. Scale bar = 5 mm
Fig. 2
Fig. 2
Cortical neuronal area and cortical lesions. A Graph showing NeuN area measurements for the cortex of the sagittal (SC), first parasagittal (PSC1) and second parasagittal gyri (PSC2). Representative NeuN whole section images for B sham control (n = 8), E ischemia-normothermia (n = 8) and H ischemia-hypothermia (n = 8). Representative GFAP images in the cortex taken from area denoted by the box for C sham control showing no lesions, F ischemia-normothermia showing lesions and I ischemia-hypothermia showing no lesions. Representative Iba1 images in the cortex for D sham control showing no lesions, G ischemia-normothermia showing lesions and J ischemia-hypothermia showing no lesions. Arrows indicate lesions. *(p < 0.05) vs. sham control, ^(p < 0.05) vs. ischemia-normothermia, repeated measures ANOVA and LSD post hoc test. Scale bar for F = 5 mm (NeuN), scale bar for J = 200 µm (GFAP and Iba1)
Fig. 3
Fig. 3
White matter MBP area and area fraction measurements and white matter lesions. A Graph showing MBP area measurements and B MBP area fraction for the intragyral white matter of the sagittal gyrus (SWM) and the first parasagittal gyrus (IGWM1) and second parasagittal gyrus (IGWM2). Representative MBP whole section images for C sham control (n = 8), F ischemia-normothermia (n = 8) and I ischemia-hypothermia (n = 8). Representative images for D intact MBP in sham control, E extensive diffuse MBP loss in ischemia-normothermia, G small lesions in ischemia-normothermia, H large lesions in ischemia-normothermia, J intact MBP in ischemia-hypothermia and K localized diffuse MBP loss in ischemia-hypothermia. Arrows with tails indicate lesions. Arrow heads without tails indicate areas of localized diffuse MBP loss. *(p < 0.05) vs. sham control, ^(p < 0.05) vs. ischemia-normothermia, repeated measures ANOVA and LSD post hoc test. Scale bar for I = 5 mm, scale bar for K = 500 µm
Fig. 4
Fig. 4
Numbers of microglia in the white matter regions, overall, and stratified by severity of myelin loss. A Graph showing number of Iba1-positive cells in the intragyral white matter of the sagittal gyrus (SWM) and the first parasagittal gyrus (IGWM1) and second parasagittal gyrus (IGWM2) in sham control (n = 8), ischemia-normothermia (n = 8) and ischemia-hypothermia (n = 8) groups. *(p < 0.05) vs. sham control, ^(p < 0.05) vs. ischemia-normothermia, repeated measures ANOVA and LSD post hoc test. B Graph showing number of Iba1-positive cells in the intact area in sham control (SC), intact area, lesion area and extensive diffuse area in ischemia-normothermia (IN) and intact and localized diffuse area in ischemia-hypothermia (IH). *(p < 0.05) vs. sham control intact, ^(p < 0.05) vs. ischemia-normothermia intact, Kruskal–Wallis one-way ANOVA. Representative images of Iba1 in C the intact area in sham control, D intact area in ischemia-normothermia, E lesion area in ischemia-normothermia and F extensive diffuse area in ischemia-normothermia and G intact area in ischemia-hypothermia and H localized diffuse area in ischemia-hypothermia. Scale bar = 100 µm
Fig. 5
Fig. 5
Gitter cells in white matter regions and stratified by severity of myelin loss. Representative images of A ramified microglia in sham control, B amoeboid microglia in ischemia-normothermia, C gitter cells in ischemia-normothermia, D ramified microglia in ischemia-hypothermia. E Graph showing the number of gitter cells in the sham control (SC) (n = 8), ischemia-normothermia (IN) (n = 8) and ischemia-hypothermia groups (IH) (n = 8) in the intragyral white matter of the first parasagittal gyrus. *(p < 0.05) vs. sham control, ^(p < 0.05) vs. ischemia-normothermia. F Graph showing the proportion of gitter cells to the overall number of Iba1-positive cells in the intact area in sham control, lesion area and extensive diffuse area in ischemia-normothermia (IN) and intact area in ischemia-hypothermia (IH). *(p < 0.05) vs. sham control intact, ^(p < 0.05) vs. ischemia-normothermia intact, +(p < 0.05) vs. ischemia-normothermia lesion, ~(p < 0.05) vs. ischemia-normothermia extensive diffuse, Kruskal–Wallis one-way ANOVA for E and F. G Maximum intensity Z-projection of z-stack for gitter cell and MBP labeling. H Z-stack slice and associated orthogonal view of gitter cell shown in G containing MBP fragments. Scale bar for D and G = 20 µm
Fig. 6
Fig. 6
Distribution of cortical microglia and microglial wrapping. A Graph showing the area fraction of NeuN, Iba1 and Hoechst in the cortex of the first parasagittal gyrus in sham control (n = 8), ischemia-normothermia (n = 8) and ischemia-hypothermia (n = 8) groups. *(p < 0.05) vs. sham control, ^(p < 0.05) vs. ischemia-normothermia, one-way ANOVA and LSD post hoc test. B Graph showing the correlation between NeuN area fraction and Iba1 area fraction in the cortex of the first parasagittal gyrus, linear regression. Representative images of Hoechst, Iba1 and NeuN triple-labeling for C sham control with many healthy neurons and few microglia, D ischemia-normothermia with few surviving neurons and an abundance of microglia and E ischemia-hypothermia with many healthy neurons and some microglia. Representative images of maximum intensity projections of z-stacks for Hoechst, Iba1 and NeuN triple labeling for F sham control microglial processes interacting with neurons, G ischemia-normothermia showing the abundance of microglia in close proximity to neurons and H ischemia-hypothermia showing microglial wrapping. Representative images of maximum intensity projections of z-stacks for Hoechst, Iba1, NeuN and TUNEL quadruple labeling for I sham control showing TUNEL negative healthy neurons and ramified microglia, J ischemia-normothermia showing TUNEL-positive neurons wrapped by microglia (arrow with tail) and K ischemia-hypothermia showing TUNEL negative neurons wrapped by microglia (arrow with no tail) and L ischemia-hypothermia showing TUNEL-positive neurons wrapped by microglia (arrow with tail). (1) Hoechst and NeuN, (2) Hoechst and Iba1, (3) Hoechst and TUNEL and (4) all 4 channels merged. Scale bar for H and L4 = 50 µm
Fig. 7
Fig. 7
Microglial phenotype marker expression in the cortex and white matter. Graphs showing area fraction of CD86 and CD206 RNA puncta in the A cortex (PSC) and B intragyral white matter of the first parasagittal gyrus (IGWM) in sham control (n = 7), ischemia-normothermia (n = 4) and ischemia-hypothermia (n = 7) groups. C Graph showing the ratio of CD86 puncta to CD206 puncta in the PSC and IGWM. Representative images of Hoechst, Iba1 and CD86 for sham control D in the PSC and F in the IGWM and representative images of Hoechst, Iba1 and CD206 in E in the PSC and G in the IGWM showing low expression of both markers. *(p < 0.05) vs. sham control, ^(p < 0.05) vs. ischemia-normothermia, one-way ANOVA and LSD post hoc test. Representative images of Hoechst, Iba1 and CD86 for ischemia-normothermia H in the PSC and J in the IGWM and representative images of Hoechst, Iba1 and CD206 in I in the PSC and K in the IGWM showing the upregulation of both markers compared with sham control. Representative images of Hoechst, Iba1 and CD86 for ischemia-hypothermia L in the PSC and N in the IGWM and representative images of Hoechst, Iba1 and CD206 in M in the PSC and O in the IGWM showing the upregulation of both markers compared with sham control but the suppression of CD86 in the PSC only compared with ischemia-normothermia. Arrows indicate the cell shown in each respective inset. Scale bar for O and inset = 50 µm
Fig. 8
Fig. 8
Astrocyte number in the white matter and stratified by severity of myelin loss. A Graph showing number of GFAP-positive cells in the in the intragyral white matter of the sagittal (SWM) first parasagittal (IGWM1) and second parasagittal gyri (IGWM2) in sham control (n = 8), ischemia-normothermia (n = 8) and ischemia-hypothermia (n = 8) groups, repeated measures ANOVA. B Graph showing number of GFAP-positive cells in the intact area in sham control (SC), intact area, lesion area and extensive diffuse area in ischemia-normothermia (IN) and intact and localized diffuse area in ischemia-hypothermia (IH), Kruskal–Wallis one-way ANOVA. *(p < 0.05) vs. sham control intact, ^(p < 0.05) vs. ischemia-normothermia intact, +(p < 0.05) vs. ischemia-normothermia lesion, ~(p < 0.05) vs. ischemia-normothermia extensive diffuse. Representative images of GFAP in C the intact area in sham control, D intact area in ischemia-normothermia, E lesion area in ischemia-normothermia and F extensive diffuse area in ischemia-normothermia and G intact area in ischemia-hypothermia and H localized diffuse area in ischemia-hypothermia. Scale bar = 100 µm
Fig. 9
Fig. 9
Astrocyte area fraction in the cortex and white matter. A Graph showing GFAP area fraction for the cortex of the sagittal (SC), first parasagittal (PSC1) and second parasagittal cortex gyri (PSC2) in sham control (n = 8), ischemia-normothermia (n = 8) and ischemia-hypothermia (n = 8) groups. B Graph showing GFAP area fraction in the intragyral white matter of the sagittal (SWM), first parasagittal (IGWM1) and second parasagittal gyri (IGWM2). C Graph showing number of GFAP-positive cells in the cortex and intragyral white matter of the first parasagittal gyrus. *(p < 0.05) vs. sham control, ^(p < 0.05) vs. ischemia-normothermia. Repeated measures ANOVA and LSD post hoc test for A and B, one-way ANOVA and LSD post hoc test for C. Representative GFAP whole section images for D sham control with higher GFAP expression in the white matter, E ischemia-normothermia with increased GFAP expression in the cortex and reduced in the white matter and F ischemia-hypothermia with normalization of GFAP expression distribution. Scale bar for F = 5 mm. Representative GFAP images for sham control in the G cortex and H white matter, ischemia-normothermia in the I cortex and J white matter and ischemia-hypothermia in the K cortex and L white matter. Scale bar for L = 200 µm. M Graph showing area fraction for NeuN, GFAP and Hoechst, one-way ANOVA and LSD post hoc test. N Graph showing no significant correlation between NeuN area fraction and GFAP area fraction, by linear regression. Representative images of Hoechst, GFAP and NeuN triple-labeling for O sham control, P ischemia-normothermia and Q ischemia-hypothermia. Scale bar for Q = 100 µm
Fig. 10
Fig. 10
Correlation of neurons, microglia and astrocytes with final EEG power at day 7. Graphs showing correlations of ischemia-normothermia (n = 8) and ischemia-hypothermia (n = 8) groups between final delta EEG power and A NeuN area fraction in the cortex of the first parasagittal gyrus (PSC1), B Iba1 area fraction in the cortex of the first parasagittal gyrus, C Iba1 cell number in the intragyral white matter of the first parasagittal gyrus (IGWM1), D GFAP cell number in the cortex of the first parasagittal gyrus and E GFAP cell number in the intragyral white matter of the first parasagittal gyrus. Linear regression was used for all correlations

Similar articles

Cited by

References

    1. Rutherford MA, Azzopardi D, Whitelaw A, Cowan F, Renowden S, Edwards AD, Thoresen M. Mild hypothermia and the distribution of cerebral lesions in neonates with hypoxic-ischemic encephalopathy. Pediatrics. 2005;116:1001–1006. doi: 10.1542/peds.2005-0328. - DOI - PubMed
    1. Shankaran S, Barnes PD, Hintz SR, Laptook AR, Zaterka-Baxter KM, McDonald SA, Ehrenkranz RA, Walsh MC, Tyson JE, Donovan EF, et al. Brain injury following trial of hypothermia for neonatal hypoxic-ischaemic encephalopathy. Arch Dis Child Fetal Neonatal Ed. 2012;97:F398–404. - PMC - PubMed
    1. Azzopardi D, Strohm B, Marlow N, Brocklehurst P, Deierl A, Eddama O, Goodwin J, Halliday HL, Juszczak E, Kapellou O, et al. Effects of hypothermia for perinatal asphyxia on childhood outcomes. N Engl J Med. 2014;371:140–149. doi: 10.1056/NEJMoa1315788. - DOI - PubMed
    1. Jacobs S, Hunt R, Tarnow-Mordi W, Inder T, Davis P. Cooling for newborns with hypoxic ischaemic encephalopathy. Cochrane Database Syst Rev. 2003:CD003311. - PubMed
    1. Natarajan G, Pappas A, Shankaran S. Outcomes in childhood following therapeutic hypothermia for neonatal hypoxic-ischemic encephalopathy (HIE) Semin Perinatol. 2016;40:549–555. doi: 10.1053/j.semperi.2016.09.007. - DOI - PMC - PubMed

Publication types