. 2022 Jun 11;20(1):270.
doi: 10.1186/s12951-022-01486-7.

Reciprocal regulation of NRF2 by autophagy and ubiquitin-proteasome modulates vascular endothelial injury induced by copper oxide nanoparticles

Affiliations

Reciprocal regulation of NRF2 by autophagy and ubiquitin-proteasome modulates vascular endothelial injury induced by copper oxide nanoparticles

Na Li et al. J Nanobiotechnology. .

Abstract

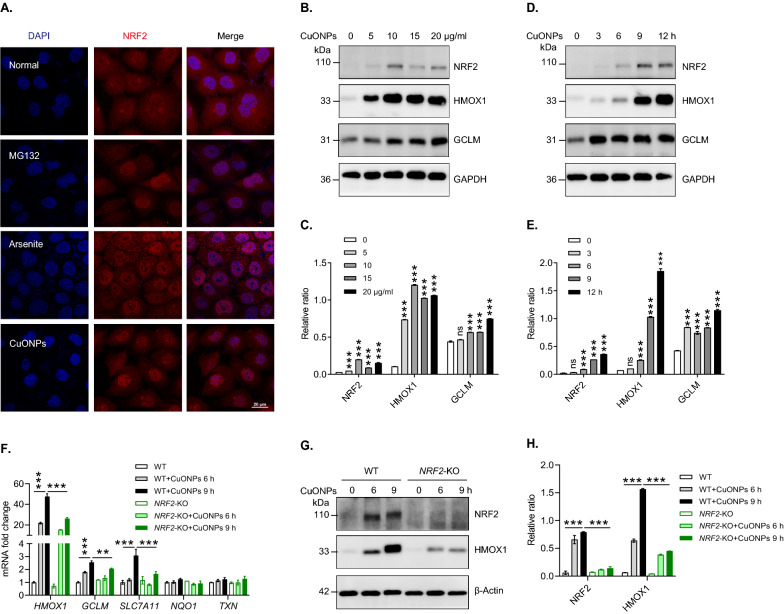
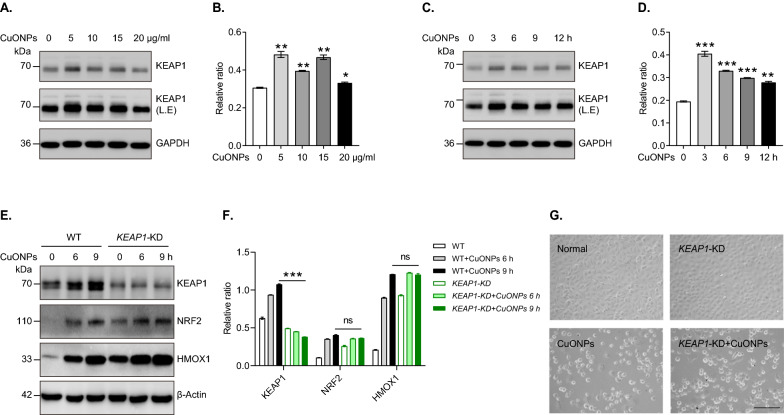
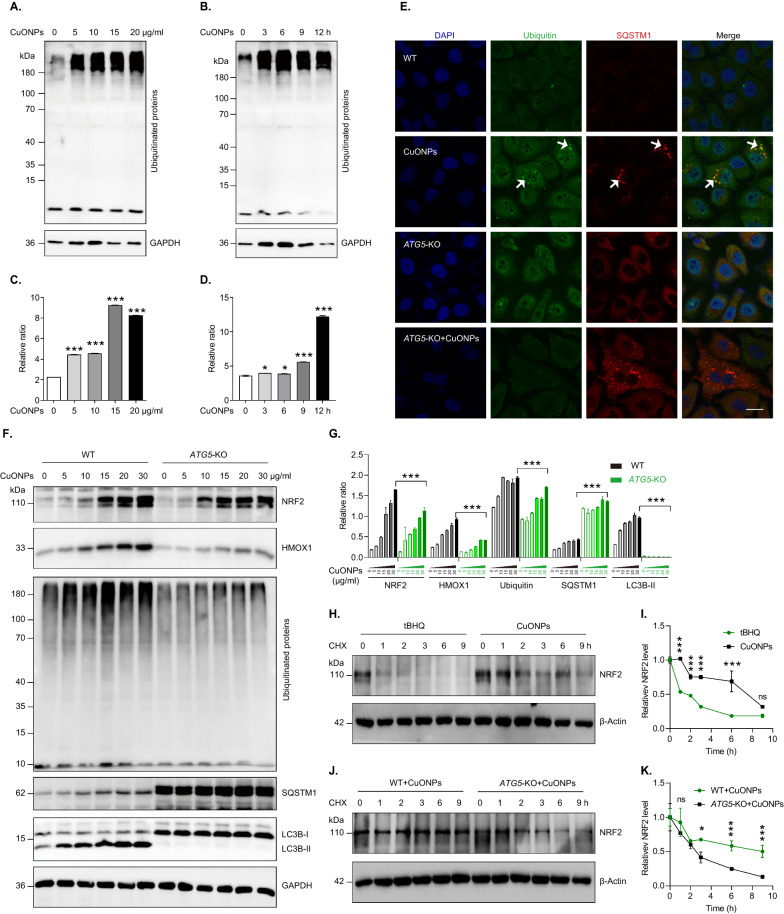
NRF2 is the key antioxidant molecule to maintain redox homeostasis, however the intrinsic mechanisms of NRF2 activation in the context of nanoparticles (NPs) exposure remain unclear. In this study, we revealed that copper oxide NPs (CuONPs) exposure activated NRF2 pathway in vascular endothelial cells. NRF2 knockout remarkably aggravated oxidative stress, which were remarkably mitigated by ROS scavenger. We also demonstrated that KEAP1 (the negative regulator of NRF2) was not primarily involved in NRF2 activation in that KEAP1 knockdown did not significantly affect CuONPs-induced NRF2 activation. Notably, we demonstrated that autophagy promoted NRF2 activation as evidenced by that ATG5 knockout or autophagy inhibitors significantly blocked NRF2 pathway. Mechanically, CuONPs disturbed ubiquitin-proteasome pathway and consequently inhibited the proteasome-dependent degradation of NRF2. However, autophagy deficiency reciprocally promoted proteasome activity, leading to the acceleration of degradation of NRF2 via ubiquitin-proteasome pathway. In addition, the notion that the reciprocal regulation of NRF2 by autophagy and ubiquitin-proteasome was further proven in a CuONPs pulmonary exposure mice model. Together, this study uncovers a novel regulatory mechanism of NRF2 activation by protein degradation machineries in response to CuONPs exposure, which opens a novel intriguing scenario to uncover therapeutic strategies against NPs-induced vascular injury and disease.

Keywords: Autophagy; CuONPs; NRF2; Ubiquitin–proteasome system; Vascular injury.


Conflict of interest statement

The authors declare no conflict of interest.

Figures

Fig. 1
Fig. 1
The activation of NRF2 in CuONPs-treated HUVECs. A Representative confocal images of NRF2 in HUVECs cells treated with CuONPs (20 μg/mL) for 12 h. Scale bar, 20 μm. Nuclei were stained with DAPI. MG132 or arsenite were used as positive controls. B, C Immunoblotting analysis and quantification of protein levels of NRF2 and its downstream HMOX1 and GCLM in HUVECs cells treated with 0, 5, 10, 15 and 20 μg/mL CuONPs for 12 h, respectively. GAPDH served as the internal control. D, E Immunoblotting analysis and quantification of protein levels of NRF2, HMOX1 and GCLM in HUVECs cells treated with 20 μg/mL CuONPs for 0, 3, 6, 9 and 12 h, respectively. GAPDH served as the internal control. F qPCR analysis of the mRNA levels of HMOX1, GCLM, SLC7A11, NQO1 and TXN in wild-type (WT) or NRF2 knockout (NRF2-KO) cells treated with 20 μg/mL CuONPs for 0, 6 and 9 h, respectively. G, H Immunoblotting analysis and quantification of NRF2 and HMOX1 protein levels in WT or NRF2-KO cells treated with 20 μg/mL CuONPs for 0, 6 and 9 h, respectively. β-Actin was used as loading control. All data are representative of three independent experiments. In C and E, Student’s t-test was used for statistical analysis. In F and H, one-way ANOVA followed by a Tukey multiple comparison test was used for statistical analysis. The values are expressed in mean ± S.D. ns not significance; **”, P ≤ 0.01; “***”, “P ≤ 0.001”
Fig. 2
Fig. 2
Oxidative stress induces NRF2 activation in CuONPs-treated HUVECs. A Representative FACS results of HUVECs cells stained with DHE. HUVECs cells were pretreated with NAC (10 mM) for 1 h and then treated with 20 μg/ml CuONPs for 12 h. Unstained, non-labeled cells. Control, normal culture media. MFI, mean fluorescence intensity. B Quantification analysis of DHE intensity in A. C Representative confocal images of HUVECs cells treated with NAC (10 mM) for 1 h, followed by treatment with 20 μg/mL CuONPs for 12 h. Scale bar, 20 μm. Nuclei, DAPI. D, E Immunoblotting analysis and quantification of protein levels of HMOX1, GCLM, SLC7A11 and β-Actin (loading control) in HUVECs cells treated with NAC (10 mM) for 1 h and then CuONPs (20 μg/mL) for 6 h or 9 h. F, G 7-AAD fluorescence intensity analysis of HUVECs cells treated with NAC and CuONPs for 12 h. All data are representative of three independent experiments. Statistical significance was evaluated using one-way ANOVA followed by a Tukey multiple comparison test. The values are expressed in mean ± S.D. “***”, “P ≤ 0.001”
Fig. 3
Fig. 3
NRF2 protects against CuONPs-triggered oxidative stress and cell death in HUVECs. A Representative images of cell morphology of WT and NRF2-KO cells treated with 20 μg/ml CuONPs for 12 h. Scale bar, 100 μm. B, C Immunoblotting analysis and quantification of protein levels of NRF2, HMOX1, γH2AX and β-Actin (loading control) in WT and NRF2-KO cells treated with 20 μg/mL CuONPs for 0, 6 and 9 h, respectively. D, E FACS analysis and quantification of DHE intensity in WT, HMOX1 knockout (HMOX1-KO) or NRF2-KO cells treated with CuONPs (20 μg/ml) for 12 h, respectively. Unstained, non-labeled cells. MFI, mean fluorescence intensity. E, F FACS analysis and quantification of 7-AAD intensity in WT, HMOX1-KO and NRF2-KO cells treated with CuONPs (20 μg/ml) for 12 h, respectively. H, I FACS analysis and quantification of DHE intensity in WT and NRF2-KO cells treated with NAC (10 mM) for 1 h before treatment with CuONPs (20 μg/ml) for 12 h, respectively. J, K FACS analysis and quantification of 7-AAD intensity in WT and NRF2-KO cells treated with NAC and CuONPs. All data are representative of three independent experiments. Statistical significance was evaluated using one-way ANOVA followed by a Tukey multiple comparison test. The values are expressed in mean ± S.D. ns not significance; “***”, “P ≤ 0.001”
Fig. 4
Fig. 4
The roles of KEAP1 in CuONPs-induced NRF2 activation. A, B Immunoblotting analysis and quantification of KEAP1 protein levels in HUVECs cells treated with 0, 5, 10, 15, 20 μg/mL CuONPs for 12 h, respectively. L.E, longer exposure time. GAPDH served as an internal control. C, D Immunoblotting analysis and quantification of KEAP1 protein levels in HUVECs cells treated with 20 μg/mL CuONPs for 0, 3, 6, 9 and 12 h, respectively. E, F Immunoblotting analysis and quantification protein levels of KEAP1, NRF2, HMOX1 and β-Actin (loading control) in WT and KEAP1 knockdown (KEAP1-KD) cells treated with 20 μg/mL CuONPs for 0, 6 and 9 h, respectively. ns, not significance. G Representative images of cell morphology of WT and KEAP1-KD cells treated with 20 μg/ml CuONPs for 12 h. Scale bar, 100 μm. In B and D, Student’s t-test was used for statistical significance. In F, statistical significance was evaluated using one-way ANOVA followed by a Tukey multiple comparison test. All data are representative of three independent experiments. The values are expressed in mean ± S.D. ns not significance; “*”, P ≤ 0.05; **”, P ≤ 0.01; “***”, “P ≤ 0.001”
Fig. 5
Fig. 5
Autophagy is involved in CuONPs-induced NRF2 activation. A Representative confocal images of NRF2 subcellular location in WT and ATG5 knockout (ATG5-KO) cells treated with CuONPs (20 μg/mL) or MG132 (20 μM) for 12 h, respectively. Scale bar, 20 μm. Nuclei, DAPI. B, C Immunoblotting analysis and quantification of protein levels of NRF2, HMOX1, ATG5, SQSTM1, LC3B and GAPDH (loading control) in WT and ATG5-KO cells treated with 20 μg/mL CuONPs for 0, 6 and 9 h. D qPCR analysis of HMOX1 mRNA levels in WT or ATG5-KO cells treated with 20 μg/mL CuONPs for 0, 6 and 9 h. E qPCR analysis of HMOX1 mRNA levels in HUVECs cells treated with CuONPs (20 μg/mL) with or without 3-MA (5 mM), CQ (10 μM) and Wort (2.5 μM), respectively. F, G Immunoblotting analysis and quantification of HMOX1 protein levels in HUVECs cells pretreated with 3-MA (5 mM) for 1 h and treated with CuONPs (20 μg/mL) for 12 h. β-Actin was used as internal control. H, I Immunoblotting analysis and quantification of HMOX1 protein levels in HUVECs cells pretreated with CQ (10 μM) for 1 h and treated with CuONPs (20 μg/mL) for 12 h. GAPDH was used as internal control. All data were analyzed using one-way ANOVA followed by a Tukey multiple comparison test. All data are representative of three independent experiments. The values are expressed in mean ± S.D. **”, P ≤ 0.01; “***”, “P ≤ 0.001”
Fig. 6
Fig. 6
Autophagy inhibition activates ubiquitin–proteasome pathway in CuONPs-treated cells. A and C Immunoblotting analysis and quantification of ubiquitinated proteins levels in HUVECs treated with 0, 5, 10, 15 and 20 μg/ml CuONPs for 12 h. GAPDH was used as loading control. B and D Immunoblotting analysis and quantification of ubiquitinated proteins levels in HUVECs treated with CuONPs (20 μg/ml) for 0, 3, 6, 9 and 12 h, respectively. GAPDH was used as loading control. E Representative confocal images of WT and ATG5-KO cells treated with CuONPs (20 μg/ml), respectively. The cells were immunofluorescently stained and analyzed with ubiquitin and SQSTM1 antibody. F and G Immunoblotting analysis and quantification of the levels of NRF2, HMOX1, ubiquitinated proteins, SQSTM1, LC3B and GAPDH (loading control) in WT and ATG5-KO cells treated with 0, 5, 10, 15, 20 and 30 μg/ml CuONPs for 12 h, respectively. H and I Immunoblotting analysis and quantification of NRF2 half-life in CuONPs-treated HUVECs. Cells were treated with tBHQ (10 μM) and CuONPs (20 μg/ml) for 9 h, and then treated with CHX (50 μg/ml) for 0, 1, 2, 3, 6, 9 h, respectively. β-Actin served as loading control. H Immunoblotting analysis and quantification of NRF2 half-life in CuONPs-treated WT or ATG5-KO HUVECs cells. Cells were treated with tBHQ (10 μM) and CuONPs (20 μg/ml) for 9 h, and then treated with CHX (50 μg/ml) for 0, 1, 2, 3, 6, 9 h, respectively. β-Actin served as loading control. In C and D, Student’s t-test was used for statistical significance. In G, I and K, statistical significance was evaluated using one-way ANOVA followed by a Tukey multiple comparison test. All data are representative of three independent experiments. The values are expressed in mean ± S.D. ns not significance; “*”, P ≤ 0.05; “***”, “P ≤ 0.001”
Fig. 7
Fig. 7
Autophagy inhibitor accelerates proteasome-dependent degradation of Nrf2 in mice. A Schematics of the in vivo experimental workflow. C57BL/6 J mice were treated with vehicle (PBS) or PBS diluted 3-MA (15 mg/kg) for 2 h via intraperitoneal injection (i.p.), and then exposed to CuONPs via intratracheal instillation (i.t.) for 3 days. B, C Mice were instilled intratracheally with CuONPs for 3 days. Immunoblotting analysis and quantification of protein levels of Sqstm1, LC3b and β-actin (loading control) in mice aorta tissues. D, E Mice were pretreated intraperitoneally with or without 3-MA and then instilled intratracheally with CuONPs for 3 days. Immunoblotting analysis and quantification of protein levels of Ubiquitin, Nrf2, Hmox1, Sqstm1 and β-actin (loading control) in mice aorta tissues. F Representative images of immunohistochemistry using antibodies against MMP-2 in the intima and media region of abdominal aorta. Black arrows indicate high expression regions of MMP-2. Scale bar, 50 μm. G The mRNA expression levels of Il6, Edn1 and Selplg in mouse aorta. In C, Student’s t-test was used for statistical significance. In E and G, one-way ANOVA followed by a Tukey multiple comparison test was used for statistical significance. All data are representative of three independent experiments. The values are expressed in mean ± S.D. “*”, P ≤ 0.05; “***”, “P ≤ 0.001”

Similar articles

Cited by

References

    1. Holm A, Goodman ED, Stenlid JH, Aitbekova A, Zelaya R, Diroll BT, Johnston-Peck AC, Kao KC, Frank CW, Pettersson LGM, Cargnello M. Nanoscale spatial distribution of supported nanoparticles controls activity and stability in powder catalysts for CO oxidation and photocatalytic H2 evolution. J Am Chem Soc. 2020;142:14481–14494. doi: 10.1021/jacs.0c03842. - DOI - PMC - PubMed
    1. Linklater DP, Baulin VA, Juodkazis S, Crawford RJ, Stoodley P, Ivanova EP. Mechano-bactericidal actions of nanostructured surfaces. Nat Rev Microbiol. 2021;19:8–22. doi: 10.1038/s41579-020-0414-z. - DOI - PubMed
    1. Peter A, Mihaly-Cozmuta L, Mihaly-Cozmuta A, Nicula C, Ziemkowska W, Basiak D, Danciu V, Vulpoi A, Baia L, Falup A, Craciun G, Ciric A, Begea M, Kiss C, Vatuiu D. Changes in the microbiological and chemical characteristics of white bread during storage in paper packages modified with Ag/TiO2-SiO2, Ag/N-TiO2 or Au/TiO2. Food Chem. 2016;197:790–798. doi: 10.1016/j.foodchem.2015.11.048. - DOI - PubMed
    1. Wang X, Yang L, Chen ZG, Shin DM. Application of nanotechnology in cancer therapy and imaging. CA Cancer J Clin. 2008;58:97–110. doi: 10.3322/CA.2007.0003. - DOI - PubMed
    1. Yang W, Wang L, Mettenbrink EM, DeAngelis PL, Wilhelm S. Nanoparticle toxicology. Annu Rev Pharmacol Toxicol. 2021;61:269–289. doi: 10.1146/annurev-pharmtox-032320-110338. - DOI - PubMed