

Respiratory viruses dynamics and interactions: ten years of surveillance in central Europe
- PMID: 35690802
- PMCID: PMC9187845
- DOI: 10.1186/s12889-022-13555-5
Respiratory viruses dynamics and interactions: ten years of surveillance in central Europe
Abstract
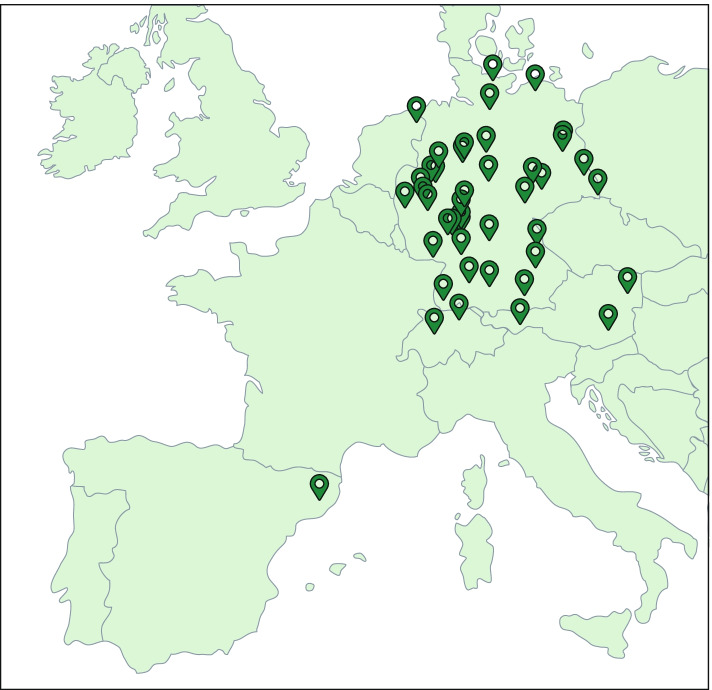
Background: Lower respiratory tract infections are among the main causes of death. Although there are many respiratory viruses, diagnostic efforts are focused mainly on influenza. The Respiratory Viruses Network (RespVir) collects infection data, primarily from German university hospitals, for a high diversity of infections by respiratory pathogens. In this study, we computationally analysed a subset of the RespVir database, covering 217,150 samples tested for 17 different viral pathogens in the time span from 2010 to 2019.
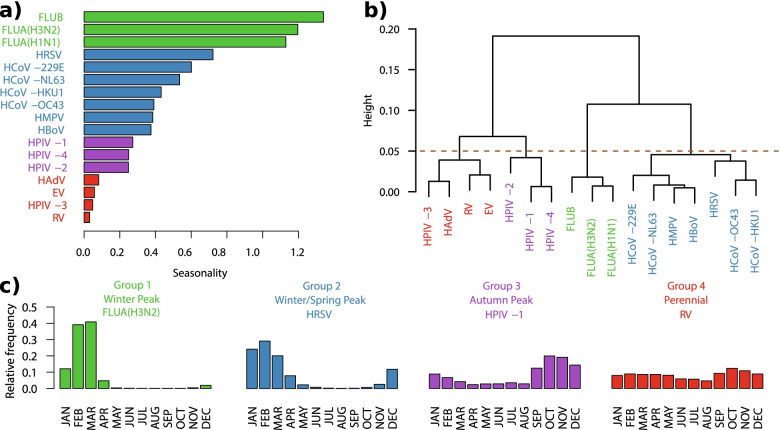
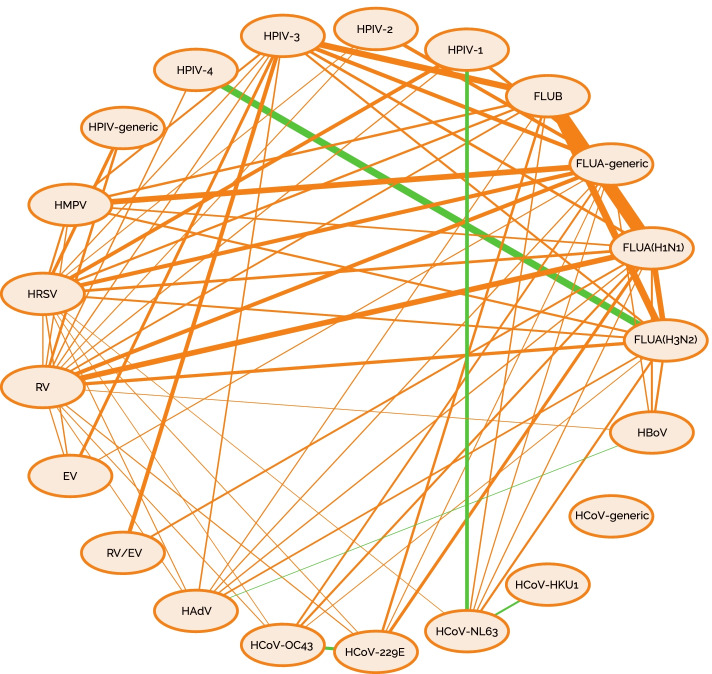
Methods: We calculated the prevalence of 17 respiratory viruses, analysed their seasonality patterns using information-theoretic measures and agglomerative clustering, and analysed their propensity for dual infection using a new metric dubbed average coinfection exclusion score (ACES).
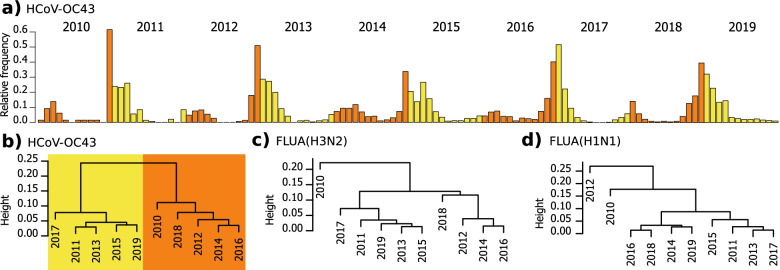
Results: After initial data pre-processing, we retained 206,814 samples, corresponding to 1,408,657 performed tests. We found that Influenza viruses were reported for almost the half of all infections and that they exhibited the highest degree of seasonality. Coinfections of viruses are frequent; the most prevalent coinfection was rhinovirus/bocavirus and most of the virus pairs had a positive ACES indicating a tendency to exclude each other regarding infection.
Conclusions: The analysis of respiratory viruses dynamics in monoinfection and coinfection contributes to the prevention, diagnostic, treatment, and development of new therapeutics. Data obtained from multiplex testing is fundamental for this analysis and should be prioritized over single pathogen testing.
Keywords: Coinfection; Respiratory viruses; Seasonality; Surveillance; Viral exclusion.
© 2022. The Author(s).
Conflict of interest statement
The authors declare that they have no competing interests.
Figures
References
-
- World Health Organization. The top 10 causes of death. 2014. https://www.who.int/news-room/fact-sheets/detail/the-top-10-causes-of-death. Accessed 30 Aug 2020.
-
- Nielsen J, Vestergaard LS, Richter L, Schmid D, Bustos N, Asikainen T, et al. European all-cause excess and influenza-attributable mortality in the 2017/18 season: should the burden of influenza B be reconsidered? Clin Microbiol Infect. 2019;25:1266–1276. doi: 10.1016/j.cmi.2019.02.011. - DOI - PubMed
-
- Paget J, Spreeuwenberg P, Charu V, Taylor RJ, Iuliano AD, Bresee J, Simonsen L, Viboud C. Global Seasonal Influenza-associated Mortality Collaborator Network and GLaMOR Collaborating Teams*. Global mortality associated with seasonal influenza epidemics: New burden estimates and predictors from the GLaMOR Project. J Glob Health. 2019;9(2):020421. 10.7189/jogh.09.020421. - PMC - PubMed
-
- Silke Buda, Viktoria Streib, Ute Preuß, Ralf Dürrwald, Barbara Biere JS, Udo Buchholz, Matthias an der Heiden WH, Aufgeführt. K 6 bis 9: DA einzelner B sind im jeweiligen A bzw. K. Bericht zur Epidemiologie der Influenza in Deutschland Saison 2018/19, Kap. 1 bis 5, 10. 2019. 10.25646/6232. - DOI
-
- Home - Clinical Virology. https://clinical-virology.net/en. Accessed 30 Aug 2020.
Publication types
MeSH terms
LinkOut - more resources
Full Text Sources
Medical
