. 2022 Jun 11;17(1):41.
doi: 10.1186/s13024-022-00547-7.

Novel App knock-in mouse model shows key features of amyloid pathology and reveals profound metabolic dysregulation of microglia

Affiliations

Novel App knock-in mouse model shows key features of amyloid pathology and reveals profound metabolic dysregulation of microglia

Dan Xia et al. Mol Neurodegener. .

Abstract

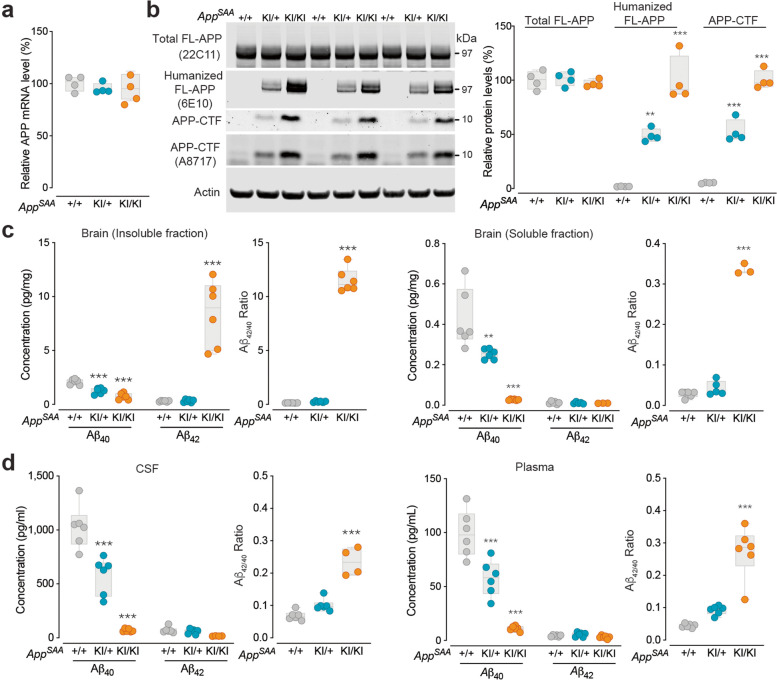
Background: Genetic mutations underlying familial Alzheimer's disease (AD) were identified decades ago, but the field is still in search of transformative therapies for patients. While mouse models based on overexpression of mutated transgenes have yielded key insights in mechanisms of disease, those models are subject to artifacts, including random genetic integration of the transgene, ectopic expression and non-physiological protein levels. The genetic engineering of novel mouse models using knock-in approaches addresses some of those limitations. With mounting evidence of the role played by microglia in AD, high-dimensional approaches to phenotype microglia in those models are critical to refine our understanding of the immune response in the brain.

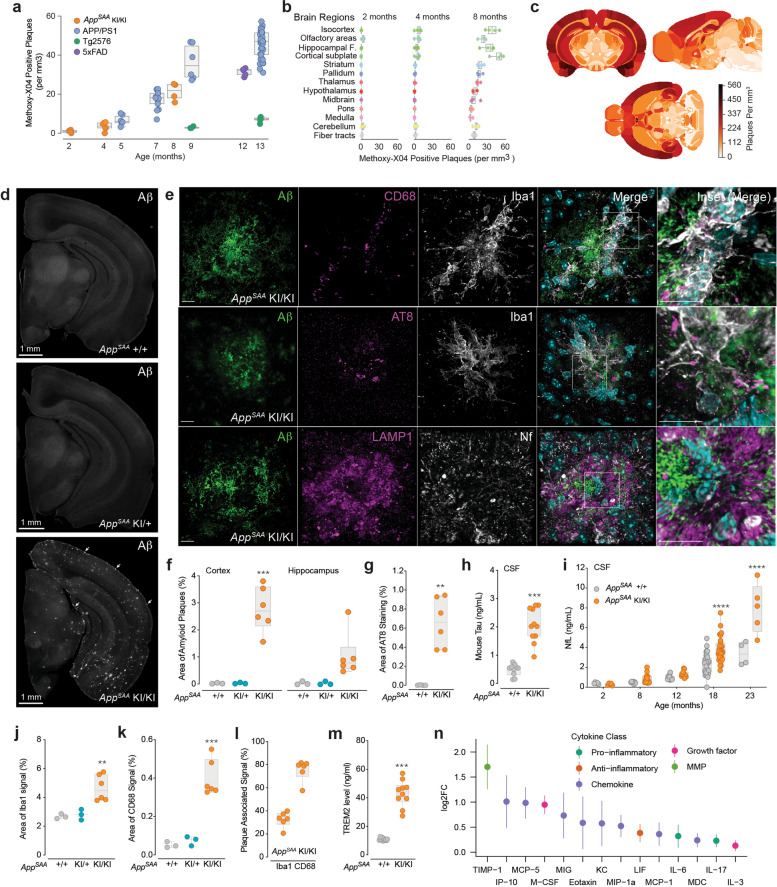
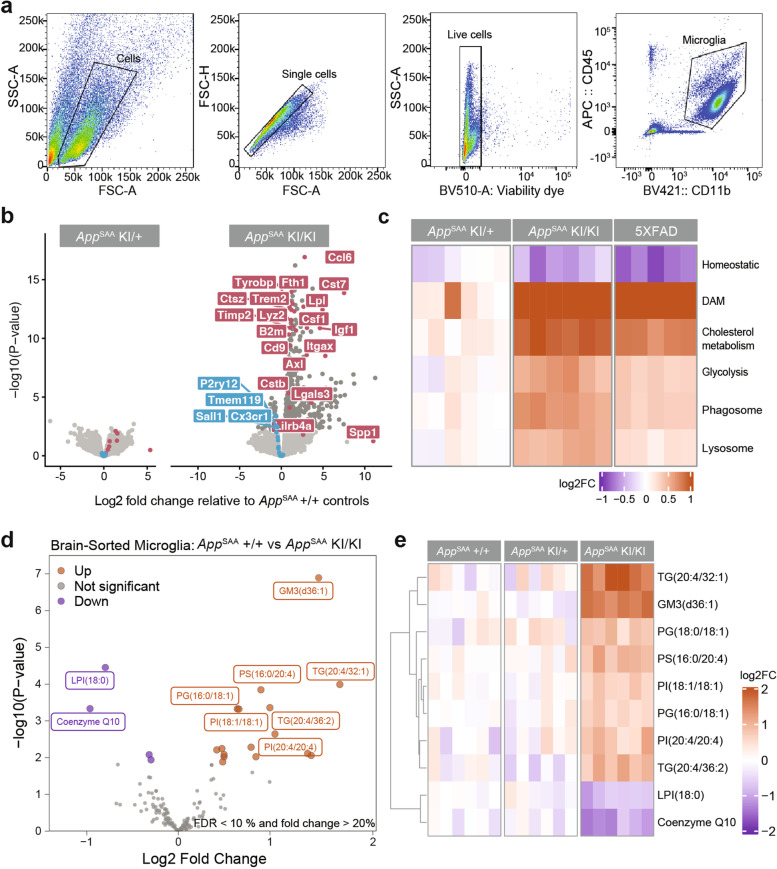
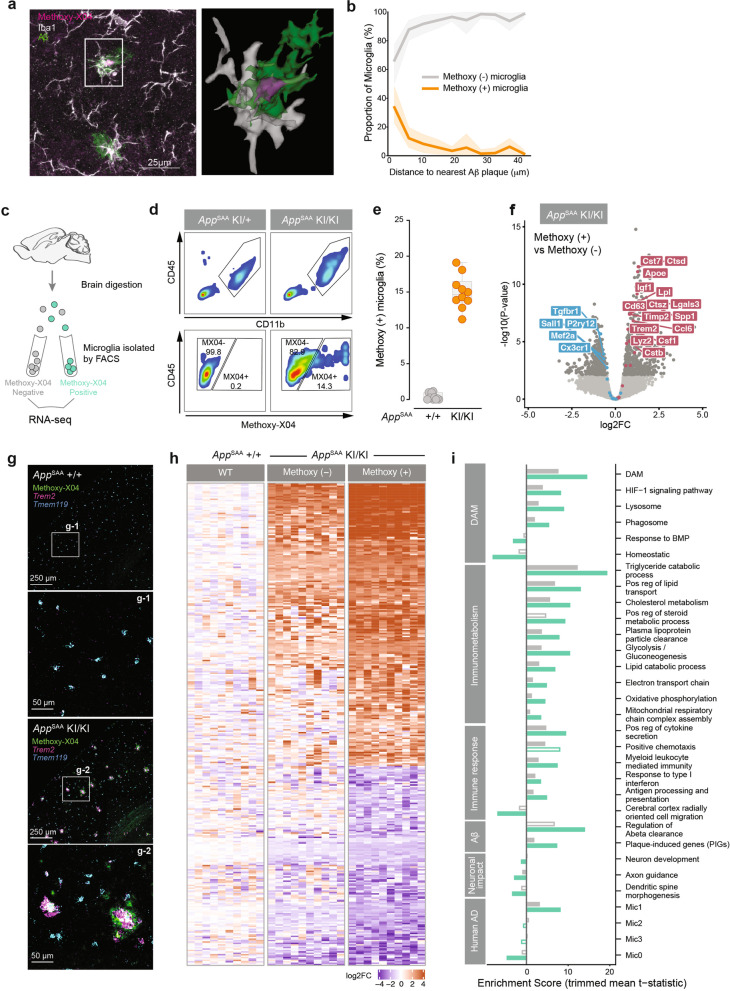
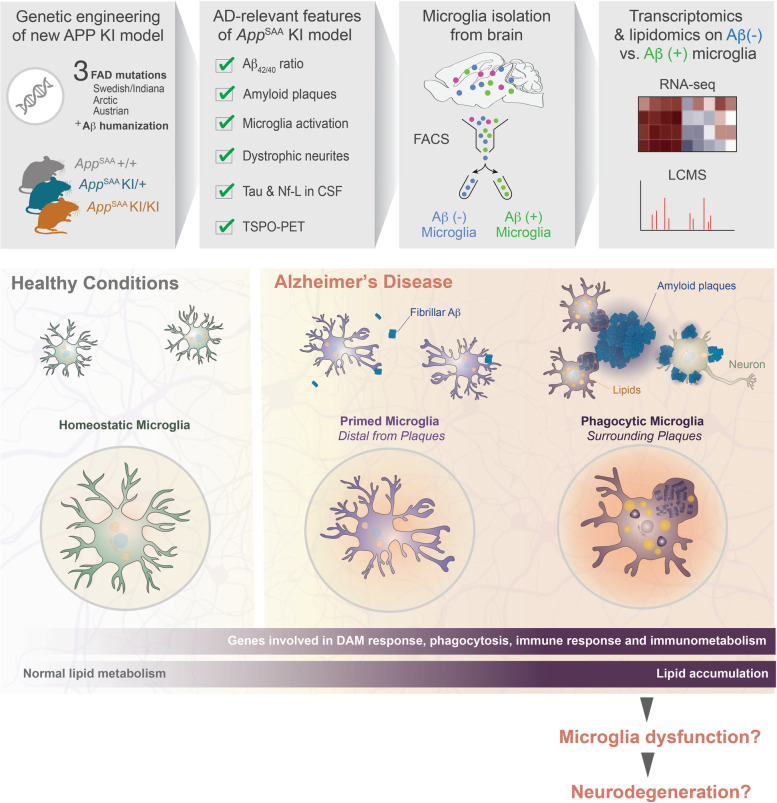
Methods: We engineered a novel App knock-in mouse model (AppSAA) using homologous recombination to introduce three disease-causing coding mutations (Swedish, Arctic and Austrian) to the mouse App gene. Amyloid-β pathology, neurodegeneration, glial responses, brain metabolism and behavioral phenotypes were characterized in heterozygous and homozygous AppSAA mice at different ages in brain and/ or biofluids. Wild type littermate mice were used as experimental controls. We used in situ imaging technologies to define the whole-brain distribution of amyloid plaques and compare it to other AD mouse models and human brain pathology. To further explore the microglial response to AD relevant pathology, we isolated microglia with fibrillar Aβ content from the brain and performed transcriptomics and metabolomics analyses and in vivo brain imaging to measure energy metabolism and microglial response. Finally, we also characterized the mice in various behavioral assays.

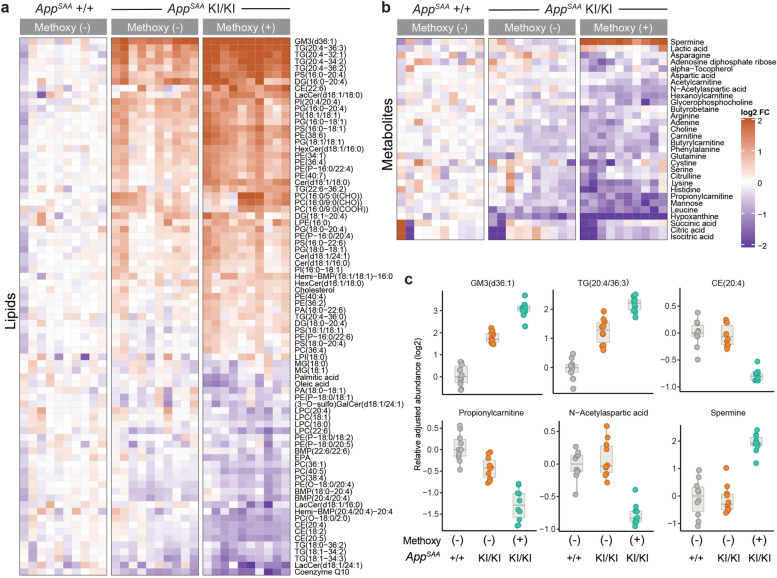
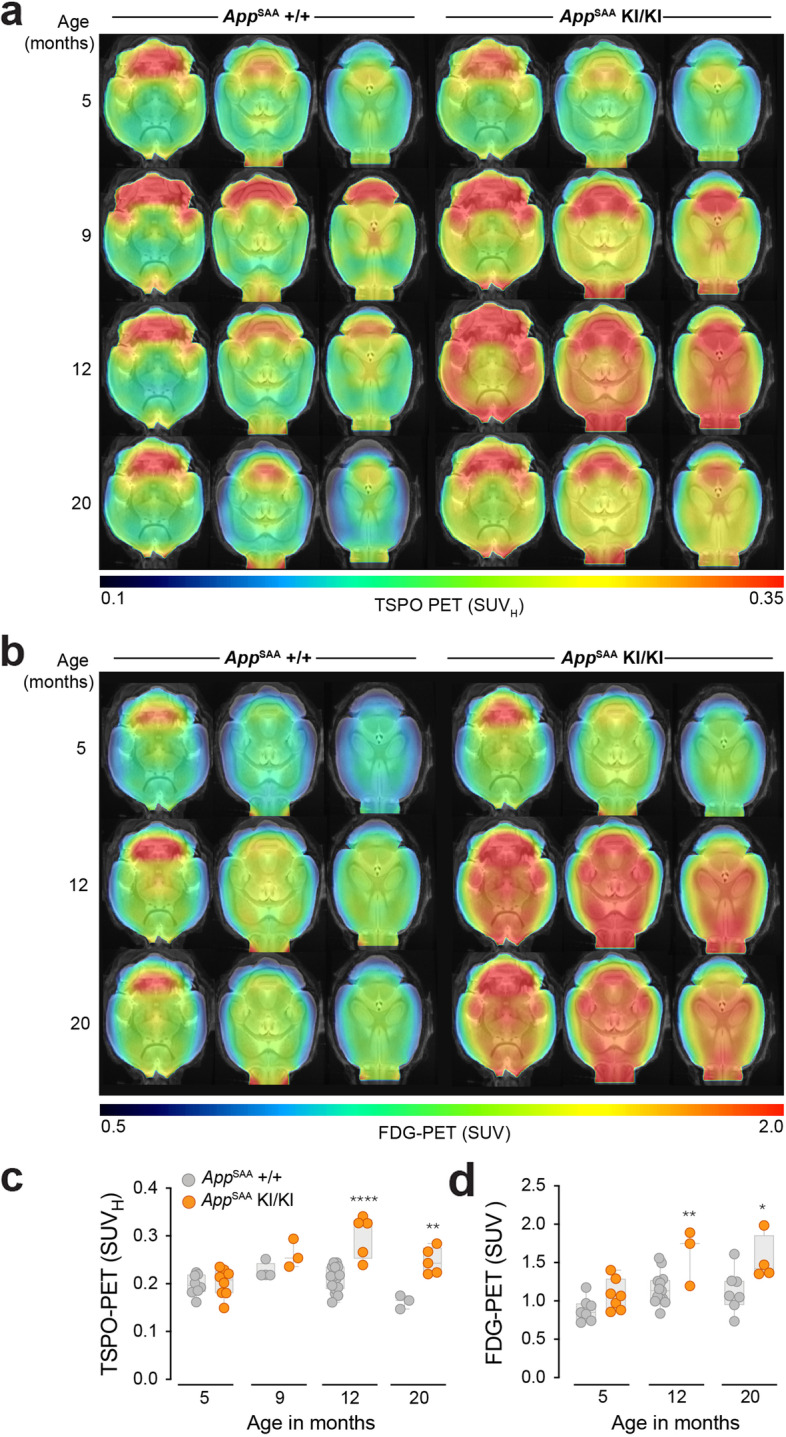
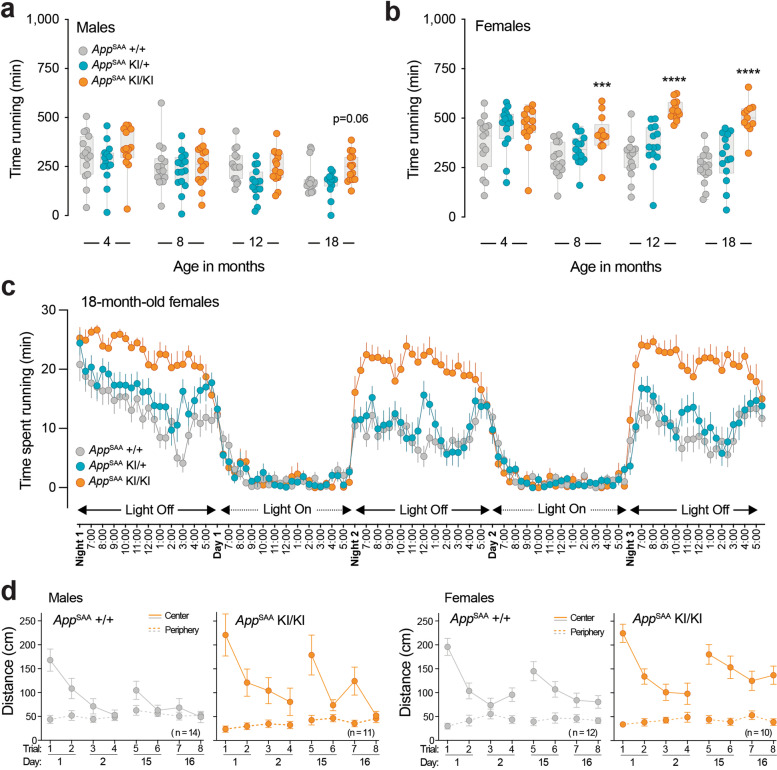
Results: Leveraging multi-omics approaches, we discovered profound alteration of diverse lipids and metabolites as well as an exacerbated disease-associated transcriptomic response in microglia with high intracellular Aβ content. The AppSAA knock-in mouse model recapitulates key pathological features of AD such as a progressive accumulation of parenchymal amyloid plaques and vascular amyloid deposits, altered astroglial and microglial responses and elevation of CSF markers of neurodegeneration. Those observations were associated with increased TSPO and FDG-PET brain signals and a hyperactivity phenotype as the animals aged.

Discussion: Our findings demonstrate that fibrillar Aβ in microglia is associated with lipid dyshomeostasis consistent with lysosomal dysfunction and foam cell phenotypes as well as profound immuno-metabolic perturbations, opening new avenues to further investigate metabolic pathways at play in microglia responding to AD-relevant pathogenesis. The in-depth characterization of pathological hallmarks of AD in this novel and open-access mouse model should serve as a resource for the scientific community to investigate disease-relevant biology.

Keywords: Astrogliosis; Lipid dyshomeostasis; Neuritic plaques; Neurodegeneration; Phagocytic microglia; Vascular amyloid.


Conflict of interest statement

D.X., S.L., T.S., M.C., J.S., E.T., J.D., M.P., N.E.K, J.Y.Z., S.L.D., T.K.E., C.C.L., S.D., C.H., H.H., R.C., E.Y., H.S., S.T.M., R.L., K.L., R.G.T., K.S.L., J.W.L., G.D.P. and P.E.S are paid employees and shareholders of Denali Therapeutic Inc. J.D.W. and J.A.H are currently employed by Cajal Neuroscience.

Figures

Fig. 1
Fig. 1
Alterations of APP cleavage and Aβ levels in AppSAA knock-in mice. a RT-qPCR analysis of brain RNA shows normal App mRNA level in the AppSAA homozygous mice (KI/KI), heterozygous mice (KI/+) and wild-type mice (+/+) at 2-month-old. b Western blotting analysis of brain lysates at 2-month-old shows normal expression of full-length APP proteins in all three genotypes and KI gene dosage-dependent increase of human full-length APP proteins and APP-CTF in KI/KI and KI/+ mice. β-Actin was used as internal loading control. c Measurement of Aβ40 and Aβ42 in brain insoluble and soluble fractions extracted from animals at 4 months of age. Level of insoluble Aβ42 is increased in KI/KI homogenates and level of insoluble Aβ40 is reduced in KI/KI and KI/+ homogenates relative to wild-type control. The insoluble Aβ42/Aβ40 ratio is significantly enhanced in KI/KI brains. Level of soluble Aβ42 is unchanged in KI/KI homogenates and level of soluble Aβ40 is reduced in KI/KI and KI/+ homogenates relative to wild-type control. The soluble Aβ42/Aβ40 ratio is significantly increased in KI/KI brains. d Measurement of Aβ40 and Aβ42 in CSF and plasma collected from mice at 4 months of age. Level of Aβ42 is unchanged in KI/KI CSF while level of Aβ40 is reduced in KI/KI and KI/+ CSF relative to wild-type control. The CSF Aβ42/Aβ40 ratio is significantly increased in KI/KI CSF. Level of Aβ42 is unchanged in KI/KI plasma while level of Aβ40 is reduced in KI/KI and KI/+ plasma relative to wild-type control. The plasma Aβ42/Aβ40 ratio is significantly increased in KI/KI. Graphs are box and whisker plots and P values: one-way ANOVA with Dunnett’s multiple comparison test, each group compared to the AppSAA +/+ control group; **P < 0.01, and ***P < 0.001. Sample size: 3-6 per genotype.
Fig. 2
Fig. 2
Amyloid plaque pathology, biomarkers of neurodegeneration and neuroinflammation. a Amyloid plaques were measured by segmentation and registration to the CCFv3 atlas post-methoxy-X04 labeling. N = 4-30 mice/ group. b Methoxy-X04 positive plaque density across brain regions in the AppSAA KI/KI. Hippocampal F. = formation. N = 4-6 mice/ group. c 3D heatmaps show brain distribution of methoxy-X04 positive plaques in AppSAA KI/KI at 8-month-old. Except panel i, all panels from d-n show data from 8-month-old mice. d Representative images of brain sections show Aβ plaque immunoreactivity in AppSAA KI/KI but not in KI/+ mice. Leptomeningeal cerebral amyloid angiopathy is indicated by arrows. e Confocal images from AppSAA KI/KI stained for plaques, microglia markers (Iba1, CD68), dystrophic neurites (AT8), neurofilament (Nf) and lysosomal marker (LAMP1). Far right column provides a magnified view of the inset in merged images. Scale bars = 10 μm. f-g Quantification of brain areas covered by Aβ plaques (f) and AT8 area (g). N = 3-6 mice/ genotype. h Total tau levels in CSF. N = 6-11 mice/ genotype. i Higher level of CSF Nf-L in aged AppSAA KI/KI relative to +/+ mice. N = 4-33 mice/ group. Age: F (4, 111) = 61.74, P < 0.0001. Genotype: F (1, 111) = 33.46, P < 0.0001. j-l Quantification of Iba1 (j), CD68 (k), percentage of the Iba1 and CD68 signals overlapping with plaques (l). N = 3-6 mice/ genotype. m TREM2 levels measured in brain homogenates. N = 10 mice/ genotype. n Differential abundance (log2) of cytokines measured in brain lysates. N = 10 mice/ genotype. Bars represent 95% confidence intervals of fold change. Graphs from f-m are box and whisker plots. P values: (f, j, k) one-way ANOVA with Dunnett’s multiple comparison test, (g, h, m) t-test. Each genotype compared to AppSAA +/+; **P < 0.01, ***P < 0.001 and ****P < 0.0001
Fig. 3
Fig. 3
Multi-omics analysis of microglia from AppSAA KI/KI and control mice at 8 months of age. a FACS gating strategy for isolating microglia from whole brains of AppSAA homozygous mice (KI/KI), heterozygous mice (KI/+) and wild-type mice (+/+) at 8 months of age for transcriptomics, lipidomics, and metabolomics analysis. b Volcano plots showing log2 fold change of gene expression between AppSAA heterozygous (left) and homozygous (right) knock-in compared to WT; dark grey, fuchsia, and blue indicate DEGs (FDR <= 10%; see methods), DAM, and homeostatic genes, respectively. N = 6 mice per genotype. c Single sample activity scores for curated gene sets in AppSAA heterozygous, AppSAA homozygous, and 5xFAD. Intensities indicate log2 fold change of aggregated gene set score (row) per mouse (column) with respect to mean gene set score from matched WT mice. N = 5-6 mice per genotype. d Volcano plot showing log2 fold change of lipids between AppSAA homozygous mice compared to WT. FDR <= 10%; absolute fold change > 20%. N = 6 mice per genotype. e Heatmap of top 10 lipids significantly altered by genotype in isolated microglia; columns represent individual mice. Intensities indicate log2 fold change of lipids with respect to mean abundance in WT mice. N = 6 mice per genotype
Fig. 4
Fig. 4
Methoxy-X04 (+) microglia from AppSAA KI/KI mice exhibit exacerbated gene expression and metabolic profiles. a (Left) Confocal images of cortex from 8-month-old AppSAA homozygous mice (KI/KI) stained for amyloid plaques and microglia markers (Iba1) post methoxy-X04 injection. Scale bars = 25 μm. (Right) a magnified view of the inset. b Quantification of methoxy-X04 (+) microglia proximal to plaques n=6. c-d Schematic of FACS experiment and gating strategy used to isolate pure populations of microglia that are negative (-) or positive (+) for methoxy-X04. e Fraction of methoxy-X04 (+) microglia purified from WT and AppSAA KI/KI mouse brains at 8 months of age. N = 10. f Volcano plot showing log2 fold change of gene expression between methoxy-X04 (+) and methoxy-X04 (-) samples. Genes expressed higher in methoxy (+) microglia have log2 fold changes > 0; colors same as in Fig. 3b. g Images of brain sections showing methoxy-X04 labeling and detection of Trem2 and Tmem119 transcripts by in situ hybridization. h Gene expression profiles from a representative subset of differentially expressed genes in methoxy-X04 (-) and (+) AppSAA KI/KI microglia when compared to WT. Intensities correspond to the log2 fold- change for each gene (row) per sample (column) as compared to the mean expression of the gene in the methoxy-X04 (-) WT group. i Gene set enrichment analysis from methoxy-X04 (-) (grey) or methoxy-X04 (+) (light green) AppSAA KI/KI vs methoxy-X04 (-) WT mice. Enrichment scores are calculated as the mean t-statistic of genes in the leading edge of the gene set. Filled bars indicate gene set enrichment results with FDR <= 10%
Fig. 5
Fig. 5
Methoxy-X04 (+) microglia isolated from AppSAA knock-in mice show alterations of lipids and metabolites levels. a-b Heatmap of (a) lipids and (b) metabolites significantly altered by genotype and/or presence of methoxy-X04 dye in microglia isolated from AppSAA KI/KI and AppSAA +/+ mouse brain. n=10, columns represent individual mice. c Representative plots showing genotype and methoxy-X04 effects on key lipids and metabolites from FACS-isolated microglia. n=10. Statistical analysis was performed by fitting linear models using limma; FDR was calculated according to Benjamini’s and Hochberg’s method. All panels from a-c are showing data from 8-month-old mice
Fig. 6
Fig. 6
Elevated TSPO- and FDG-PET cortical signals in AppSAA mice. a-b Axial slices upon an MRI template show TSPO-PET and FDG-PET uptake patterns of WT and AppSAA mice at different age groups. c AppSAA KI/KI mice had a significantly higher TSPO-PET signal at 12 months and 20 months of age when compared to AppSAA +/+ control mice. d AppSAA KI/KI mice had a significantly higher glucose uptake at 12 and 20 months of age when compared to AppSAA +/+ control mice. P values: t-test; *P < 0.05, **P < 0.01, and ****P < 0.0001.
Fig. 7
Fig. 7
Hyperactivity phenotype in AppSAA KI/KI mice. a-c Spontaneous activity was monitored in home-cage using running wheels. The average time running is represented for males (a) and females (b) at 4, 8, 12 and 18 months of age for the three genotypes (AppSAA +/+, KI/+ and KI/KI). Graphs are box and whisker plots. P values: one-way ANOVA with Dunnett’s multiple comparison test. AppSAA KI/KI compared to the AppSAA +/+ control group; ***P < 0.001 and ****P < 0.0001. c Illustration of time spent running averaged per genotype in female mice at 18 months of age. Data are represented as mean ± SEM. d 16–17-month-old male and female AppSAA mice (KI/KI) and wildtype littermate controls (+/+) were tested in the open field for 5 min twice a day for two days (Day 1–2; Trials 1–4) and retested two weeks later (Day 15–16; Trials 5–8). Top: Distance travelled (cm) in the center and periphery of a circular arena. Bottom: P values for the repeated three-way ANOVA with genotype (KI/KI vs +/+), sex (male vs female), and location (center vs periphery) as fixed factors and their interactions. Bars represent mean ± SEM. Number of mice indicated in parentheses
Fig. 8
Fig. 8
Summary of disease-relevant biology in the AppSAA mouse model

References

    1. Scearce-Levie K, Sanchez PE, Lewcock JW. Leveraging preclinical models for the development of Alzheimer disease therapeutics. Nat Rev Drug Discov. 2020;19(7):447–462. - PubMed
    1. Jankowsky JL, Zheng H. Practical considerations for choosing a mouse model of Alzheimer's disease. Mol Neurodegener. 2017;12(1):89. - PMC - PubMed
    1. Gotz J, Bodea LG, Goedert M. Rodent models for Alzheimer disease. Nat Rev Neurosci. 2018;19(10):583–598. - PubMed
    1. Myers A, McGonigle P. Overview of Transgenic Mouse Models for Alzheimer's Disease. Curr Protoc Neurosci. 2019;89(1):e81. - PubMed
    1. Sasaguri H, Nilsson P, Hashimoto S, Nagata K, Saito T, De Strooper B, Hardy J, Vassar R, Winblad B, Saido TC. APP mouse models for Alzheimer's disease preclinical studies. EMBO J. 2017;36(17):2473–2487. - PMC - PubMed

Publication types