. 2022 Oct:213:113604.
doi: 10.1016/j.envres.2022.113604. Epub 2022 Jun 9.

The impact of crowd gatherings on the spread of COVID-19

Affiliations

The impact of crowd gatherings on the spread of COVID-19

Chuwei Liu et al. Environ Res. 2022 Oct.

Abstract

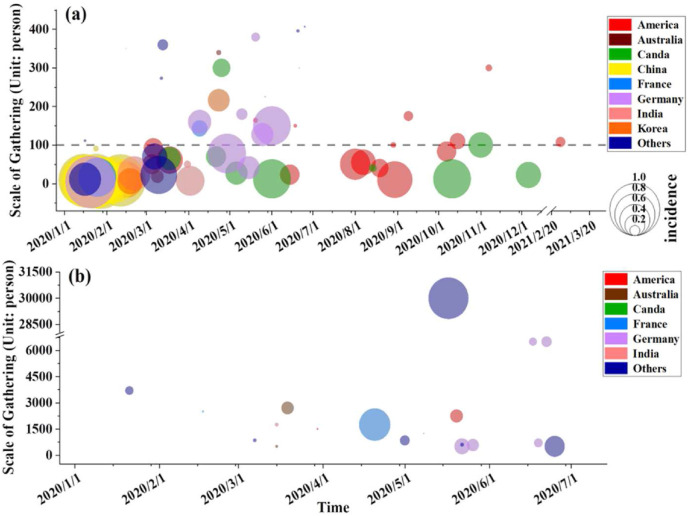
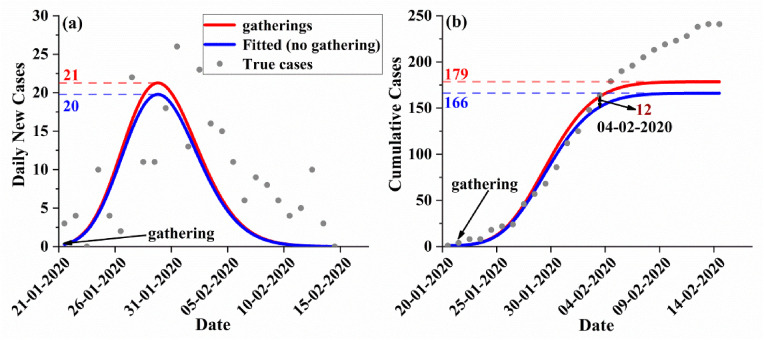
Crowd gatherings are an important cause of COVID-19 outbreaks. However, how the scale, scene and other factors of gatherings affect the spread of the epidemic remains unclear. A total of 184 gathering events worldwide were collected to construct a database, and 99 of them with a clear gathering scale were used for statistical analysis of the impact of these factors on the disease incidence among the crowd in the study. The results showed that the impact of small-scale (less than 100 people) gathering events on the spread of COVID-19 in the city is also not to be underestimated due to their characteristics of more frequent occurrence and less detection and control. In our dataset, 22.22% of small-scale events have an incidence of more than 0.8. In contrast, the incidence of most large-scale events is less than 0.4. Gathering scenes such as "Meal" and "Family" occur in densely populated private or small public places have the highest incidence. We further designed a model of epidemic transmission triggered by crowd gathering events and simulated the impact of crowd gathering events on the overall epidemic situation in the city. The simulation results showed that the number of patients will be drastically reduced if the scale and the density of crowds gathering are halved. It indicated that crowd gatherings should be strictly controlled on a small scale. In addition, it showed that the model well reproduce the epidemic spread after crowd gathering events better than does the original SIER model and could be applied to epidemic prediction after sudden gathering events.

Keywords: COVID-19 pandemic; Epidemic model; Epidemic prediction; Gathering events; Simulation.


Conflict of interest statement

The authors declare that they have no known competing financial interests or personal relationships that could have appeared to influence the work reported in this paper.

Figures

Fig. 1
Fig. 1
The effect of crowd gatherings on the development of the epidemic. a, propagation process. Blue indicates uninfected, and red indicates infected and potentially infected. The circle represents the area in which the infection occurs (the large circle represents the entire city, regardless of external transportation; the small circle on the left represents gatherings that occur at the same time, and the infection occurs inside). The large circle on the left is the situation at the time of the gatherings, and the large circle on the right is the situation after the mass gatherings. b, model setting. When the gathering event has not occurred or has ended, the model is shown in the block diagram above. During a gathering event, the inside of the gathering place shows the same propagation pattern as the outside world (shown in the box below), and there are susceptible cases (SG), protected cases (PG), exposed cases (EG), infective cases (IG), quarantined cases (QG), recovered cases (RG) and dead cases (DG) in the gathering events. The infection rate is βG. When the gathering activity starts, the parameters (α, γ, δ, λ, κ) describing the spread of the epidemic in the city are used in the prediction process of the gathering event, but during the gathering process, there is another infection rate (βG). After the gathering, the variation of people in various categories generated by the gathering process are added to the population of the city, and changed the number of various groups of people in the city, and the spread of the epidemic in the overall population of the city continues. (For interpretation of the references to color in this figure legend, the reader is referred to the Web version of this article.)
Fig. 2
Fig. 2
Bubble chart of gathering scale, time of occurrence and incidence (different colors of bubbles indicate different countries, the size of the bubble indicates the incidence, and the horizontal and vertical coordinates are the gathering time and scale, respectively) a, The scale less than 500 people; b, The scale more than 500 people. (For interpretation of the references to color in this figure legend, the reader is referred to the Web version of this article.)
Fig. 3
Fig. 3
The impact of scale and scenario on incidence. a, The proportion of the incidence of gathering events with different scales; b, Incidence and number for each scene of gathering event. (Yellow, pink, red, brown, and brown-black represent incidence of 0–0.2, 0.2–0.4, 0.4–0.6, 0.6–0.8 and 0.8–1.0, respectively). (For interpretation of the references to color in this figure legend, the reader is referred to the Web version of this article.)
Fig. 4
Fig. 4
The simulation of COVID-19 transmission in Dalian with gathering events in the canteen in Zhuanghe University town. (The red line and blue line represent the number of cases with and without the gathering event, respectively. Grey dots indicate true cases); a, daily new cases; b, cumulative cases. (For interpretation of the references to color in this figure legend, the reader is referred to the Web version of this article.)
Fig. 5
Fig. 5
Same as Fig. 4, but for Changsha with gathering events in two buses.
Fig. 6
Fig. 6
Simulation of cases when multiple small-scale crowd gatherings (such as the COVID-19 transmission event on bus A in Changsha) occur at the same time. (The blue line, the red line, and the black line represent the number of cases without a gathering event, the number of patients after 50 gatherings of the same scale and the number of patients after the scale was halved, respectively.) (a, daily new cases; b, confirmed cases). (For interpretation of the references to color in this figure legend, the reader is referred to the Web version of this article.)

References

    1. Ahlawat A., Wiedensohler A., Mishra S.K. An overview on the role of relative humidity in airborne transmission of SARS-CoV-2 in indoor environments. Aerosol Air Qual. Res. 2020;20:1856–1861.
    1. Ahmadzadeh M., Farokhi E., Shams M. Investigating the effect of air conditioning on the distribution and transmission of COVID-19 virus particles. J. Clean. Prod. 2021;316 - PMC - PubMed
    1. Asadi S., Cappa C.D., Barreda S., et al. Efficacy of masks and face coverings in controlling outward aerosol particle emission from expiratory activities. Sci. Rep. 2020;10 - PMC - PubMed
    1. Askitas N., Tatsiramos K., Verheyden B. Estimating worldwide effects of non-pharmaceutical interventions on COVID-19 incidence and population mobility patterns using a multiple-event study. Sci. Rep. 2021;11:1972. - PMC - PubMed
    1. Bashir M.F., Ma B.J., Bilal Correlation between environmental pollution indicators and COVID-19 pandemic: a brief study in Californian context. Environ. Res. 2020;187 - PMC - PubMed

Publication types