. 2022 Jun:41:100357.
doi: 10.1016/j.sste.2020.100357. Epub 2020 Jul 4.

Improving disaggregation models of malaria incidence by ensembling non-linear models of prevalence

Affiliations

Improving disaggregation models of malaria incidence by ensembling non-linear models of prevalence

Tim C D Lucas et al. Spat Spatiotemporal Epidemiol. 2022 Jun.

Abstract

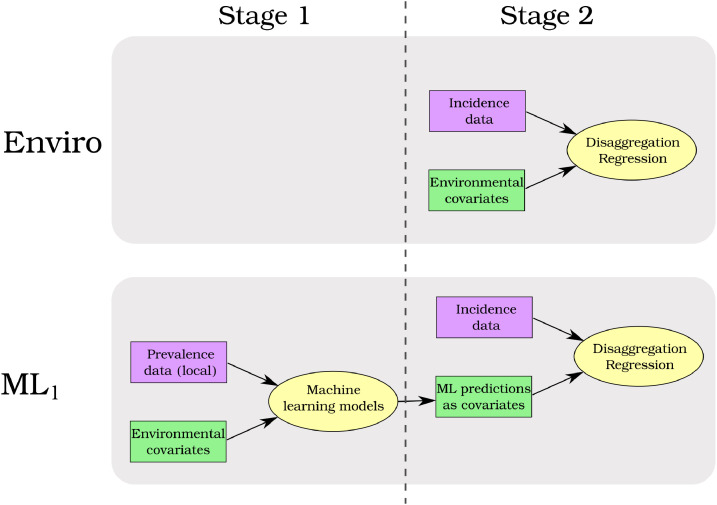
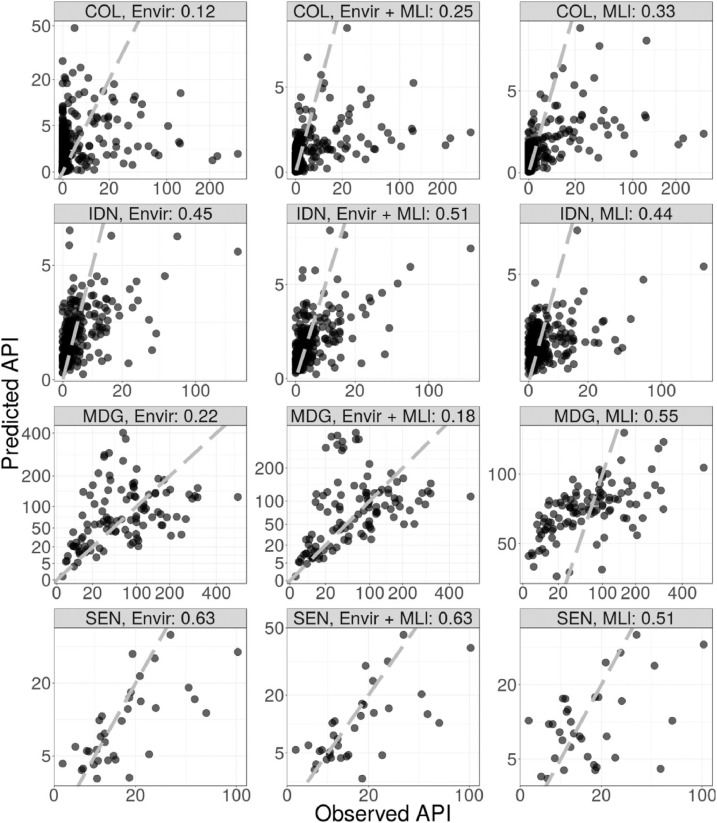
Maps of disease burden are a core tool needed for the control and elimination of malaria. Reliable routine surveillance data of malaria incidence, typically aggregated to administrative units, is becoming more widely available. Disaggregation regression is an important model framework for estimating high resolution risk maps from aggregated data. However, the aggregation of incidence over large, heterogeneous areas means that these data are underpowered for estimating complex, non-linear models. In contrast, prevalence point-surveys are directly linked to local environmental conditions but are not common in many areas of the world. Here, we train multiple non-linear, machine learning models on Plasmodium falciparum prevalence point-surveys. We then ensemble the predictions from these machine learning models with a disaggregation regression model that uses aggregated malaria incidences as response data. We find that using a disaggregation regression model to combine predictions from machine learning models improves model accuracy relative to a baseline model.

Keywords: Disaggregation regression; Spatial statistics; Stacking; Surveillance data.


Figures

Fig. 1
Fig. 1
Schematic of the baseline disaggregation regression model (Enviro) and the two stage method (MLl). Models are shown in yellow ovals, malaria data is shown in purple rectangles and covariates are shown in green rectangles. The baseline model (Enviro) uses aggregated incidence data and raw environmental covarates in a disaggregation regression model. In the two stage method (MLl), new covariates are created in stage 1 by training machine learning models on prevalence data. Predictions from these machine learning models are used as covariates in the stage 2 disaggregation regression. Only one of the two stage models (MLl) is shown for simplicity. If MLg was included as well for example, it would look the same as MLl except that the prevalence data (pink box in stage 1) would have the global database of prevalence surveys. (For interpretation of the references to colour in this figure legend, the reader is referred to the web version of this article.)
Fig. 2
Fig. 2
Observed data against predictions for random cross-validation hold-out samples on a square root transformed scale. There are 12 cases composed of 4 countries (COL:, Colombia, IDN: Indonesia, MDG: Madagascar, SEN: Senegal) and three sets of covariates (Envir: raw environmental covariates only, Enviro + MLl: raw environmental covariates and machine learning covariates trained on local prevalence data combined, MLl: Machine learning models trained on local prevalence data only.
Fig. 3
Fig. 3
Observed data against predictions for spatial cross-validation hold-out samples on a square root transformed scale. There are 12 cases composed of 4 countries (COL:, Colombia, IDN: Indonesia, MDG: Madagascar, SEN: Senegal) and three sets of covariates (Envir: raw environmental covariates only, Enviro + MLl: raw environmental covariates and machine learning covariates trained on local prevalence data combined, MLl: Machine learning models trained on local prevalence data only.
Fig. 4
Fig. 4
A) Observed data for Colombia (grey for zero incidence). B) Out-of-sample predictions for the spatial cross-validation, environmental covariates only model. C) Out-of-sample predictions for the spatial cross-validation, local machine learning only model. For each cross-validation fold, predictions are made for the held out data which are then combined to make a single surface.

References

    1. Battle K.E., Bisanzio D., Gibson H.S., Bhatt S., Cameron E., Weiss D.J., Mappin B., Dalrymple U., Howes R.E., Hay S.I., et al. Treatment-seeking rates in malaria endemic countries. Malar. J. 2016;15(1):20. - PMC - PubMed
    1. Battle K.E., Lucas T.C.D., Nguyen M., Howes R.E., Nandi A.K., Twohig K.A., Pfeffer D.A., Cameron E., Rao P.C., Casey D., et al. Mapping the global endemicity and clinical burden of Plasmodium vivax, 2000–17: a spatial and temporal modelling study. Lancet. 2019;394 - PMC - PubMed
    1. Bhatt S., Cameron E., Flaxman S.R., Weiss D.J., Smith D.L., Gething P.W. Improved prediction accuracy for disease risk mapping using Gaussian process stacked generalization. J. R. Soc. Interface. 2017;14(134):20170520. - PMC - PubMed
    1. Bhatt S., Weiss D., Cameron E., Bisanzio D., Mappin B., Dalrymple U., Battle K., Moyes C., Henry A., Eckhoff P., et al. The effect of malaria control on Plasmodium falciparum in Africa between 2000 and 2015. Nature. 2015;526(7572):207. - PMC - PubMed
    1. Breiman L. Bagging predictors. Mach. Learn. 1996;24(2):123–140.

Publication types