. 2022;98(6):227-282.
doi: 10.2183/pjab.98.015.

On the origin and evolution of the asteroid Ryugu: A comprehensive geochemical perspective

Eizo Nakamura  1 Katsura Kobayashi  1 Ryoji Tanaka  1 Tak Kunihiro  1 Hiroshi Kitagawa  1 Christian Potiszil  1 Tsutomu Ota  1 Chie Sakaguchi  1 Masahiro Yamanaka  1 Dilan M Ratnayake  1 Havishk Tripathi  1 Rahul Kumar  1 Maya-Liliana Avramescu  1 Hidehisa Tsuchida  1 Yusuke Yachi  1 Hitoshi Miura  2 Masanao Abe  3   4 Ryota Fukai  3 Shizuho Furuya  3   5 Kentaro Hatakeda  3 Tasuku Hayashi  3 Yuya Hitomi  3   6 Kazuya Kumagai  3   6 Akiko Miyazaki  3 Aiko Nakato  3 Masahiro Nishimura  3 Tatsuaki Okada  3   5 Hiromichi Soejima  3   6 Seiji Sugita  5   7 Ayako Suzuki  3   6 Tomohiro Usui  3 Toru Yada  3 Daiki Yamamoto  3 Kasumi Yogata  3 Miwa Yoshitake  3 Masahiko Arakawa  8 Atsushi Fujii  3 Masahiko Hayakawa  3 Naoyuki Hirata  8 Naru Hirata  9 Rie Honda  10 Chikatoshi Honda  9 Satoshi Hosoda  3 Yu-Ichi Iijima  3 Hitoshi Ikeda  11 Masateru Ishiguro  12 Yoshiaki Ishihara  3 Takahiro Iwata  3   4 Kosuke Kawahara  3 Shota Kikuchi  3   7 Kohei Kitazato  9 Koji Matsumoto  13 Moe Matsuoka  3   14 Tatsuhiro Michikami  15 Yuya Mimasu  3 Akira Miura  3 Tomokatsu Morota  16 Satoru Nakazawa  3 Noriyuki Namiki  13 Hirotomo Noda  13 Rina Noguchi  3   17 Naoko Ogawa  3   18 Kazunori Ogawa  3 Chisato Okamoto  8 Go Ono  11 Masanobu Ozaki  3 Takanao Saiki  3 Naoya Sakatani  19 Hirotaka Sawada  3 Hiroki Senshu  7 Yuri Shimaki  3 Kei Shirai  3   8 Yuto Takei  3 Hiroshi Takeuchi  3 Satoshi Tanaka  3   4   20 Eri Tatsumi  5   21 Fuyuto Terui  3   22 Ryudo Tsukizaki  3 Koji Wada  7 Manabu Yamada  7 Tetsuya Yamada  3 Yukio Yamamoto  3 Hajime Yano  3 Yasuhiro Yokota  3 Keisuke Yoshihara  3 Makoto Yoshikawa  3   4 Kent Yoshikawa  11 Masaki Fujimoto  3 Sei-Ichiro Watanabe  16 Yuichi Tsuda  3   5
Affiliations

On the origin and evolution of the asteroid Ryugu: A comprehensive geochemical perspective

Eizo Nakamura et al. Proc Jpn Acad Ser B Phys Biol Sci. 2022.

Abstract

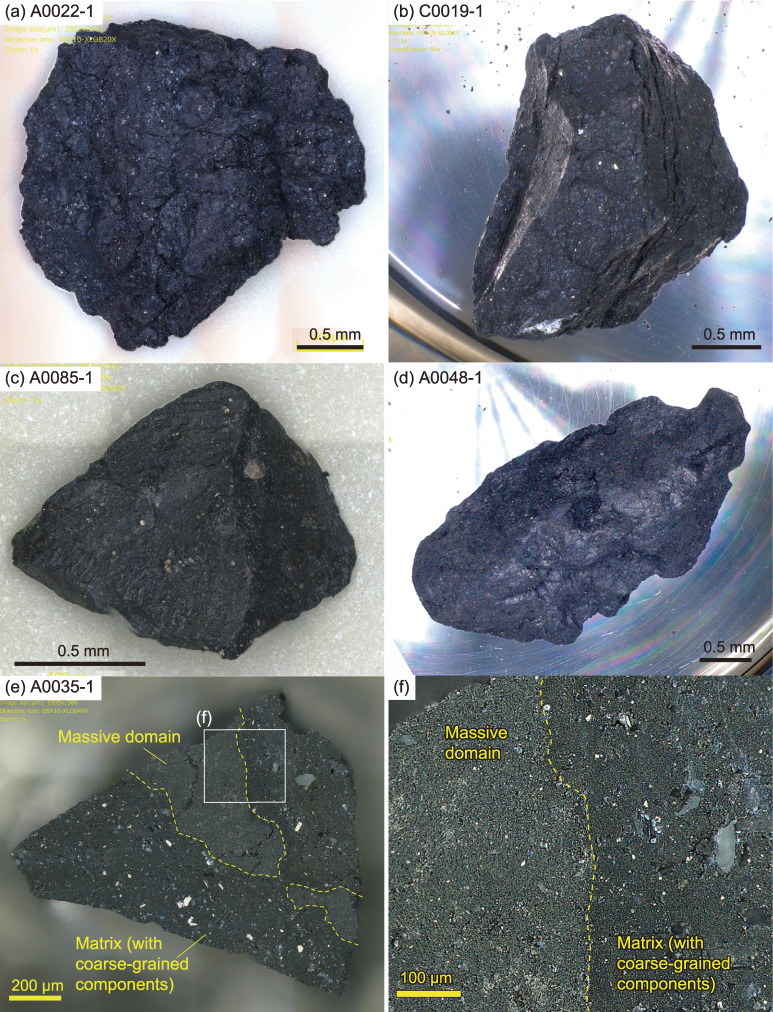
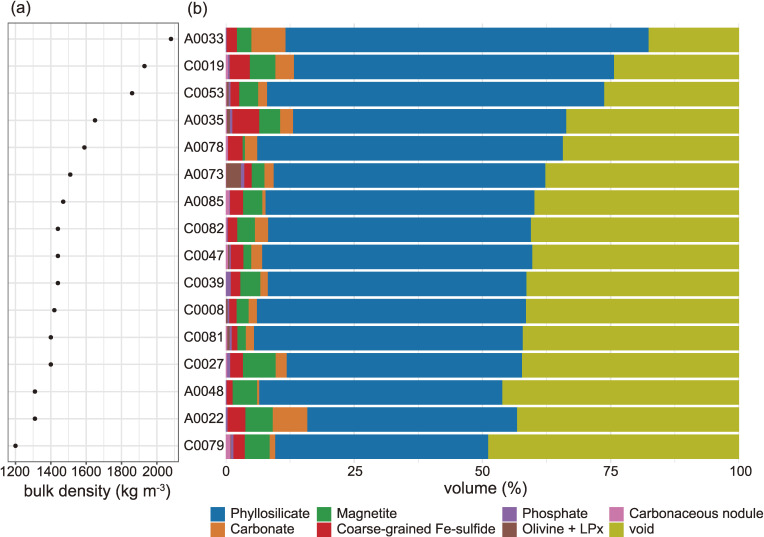
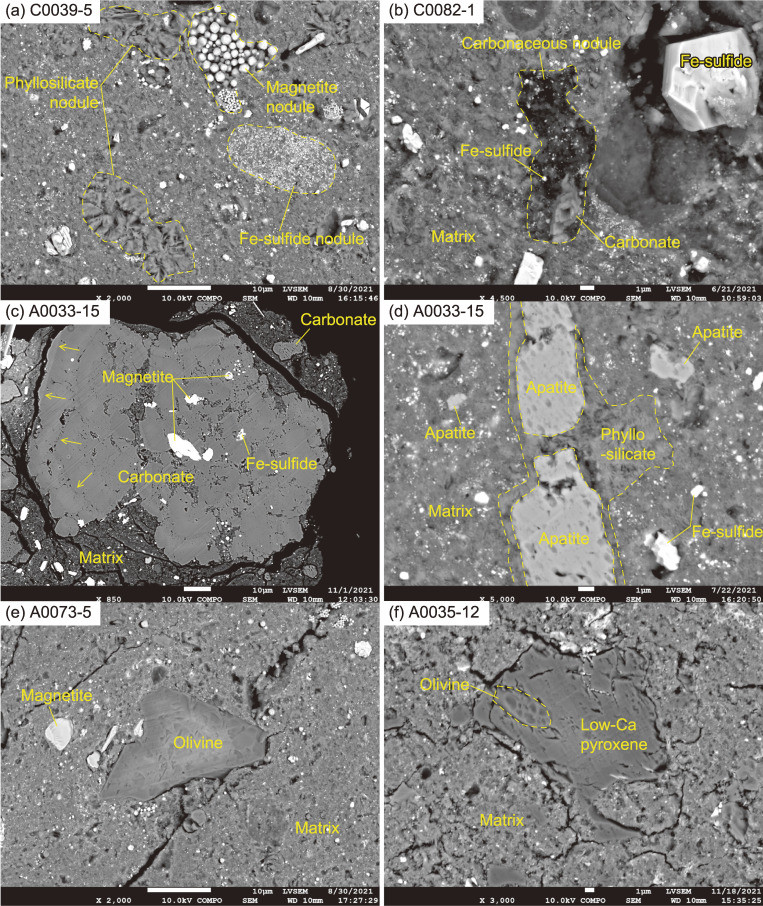
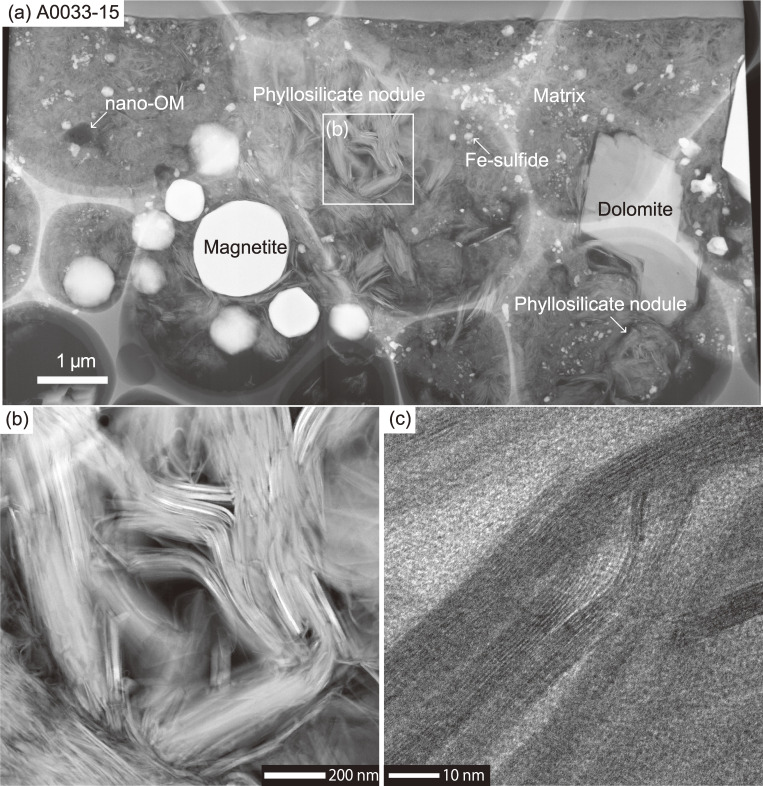
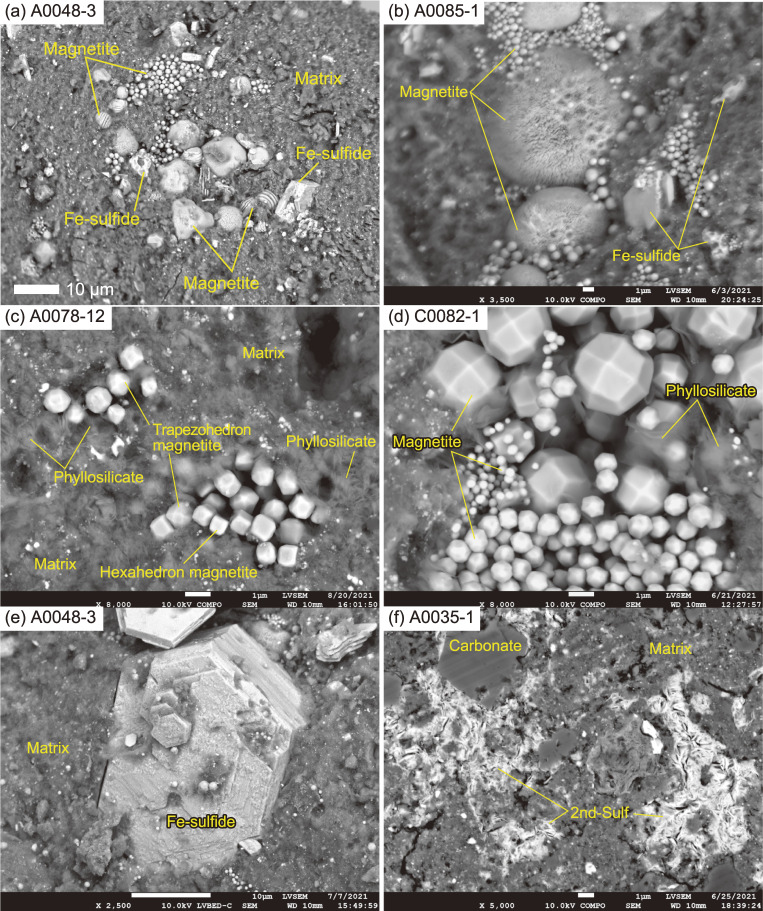
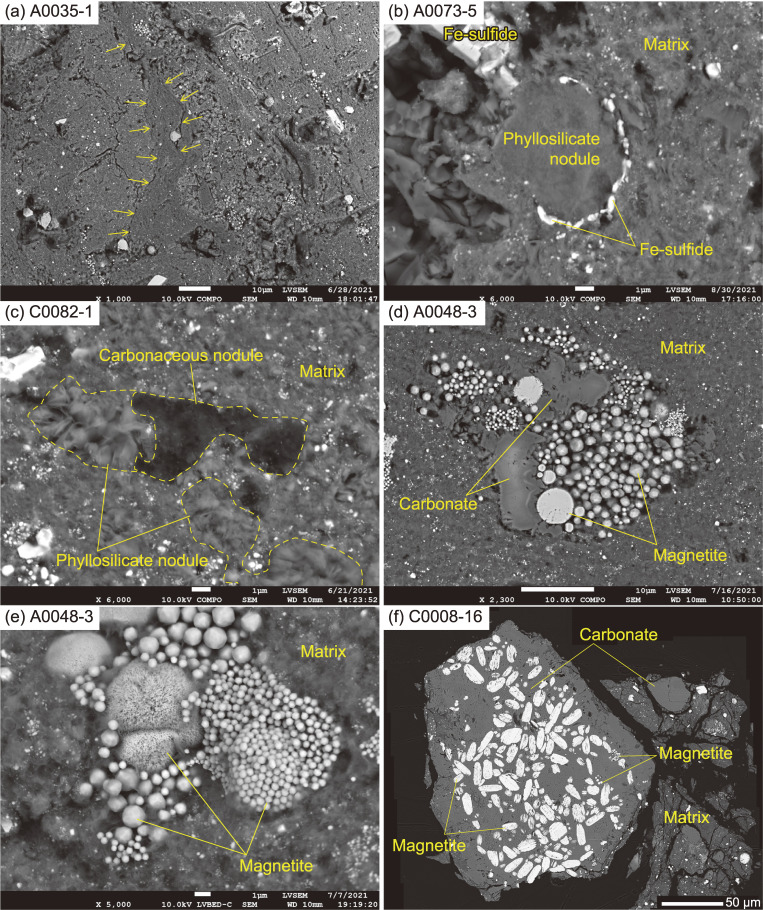
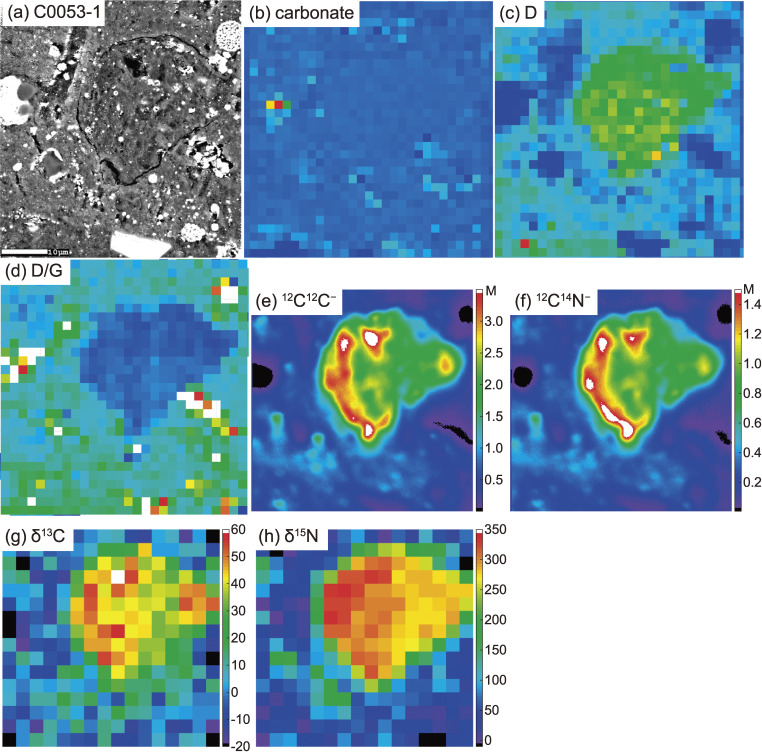
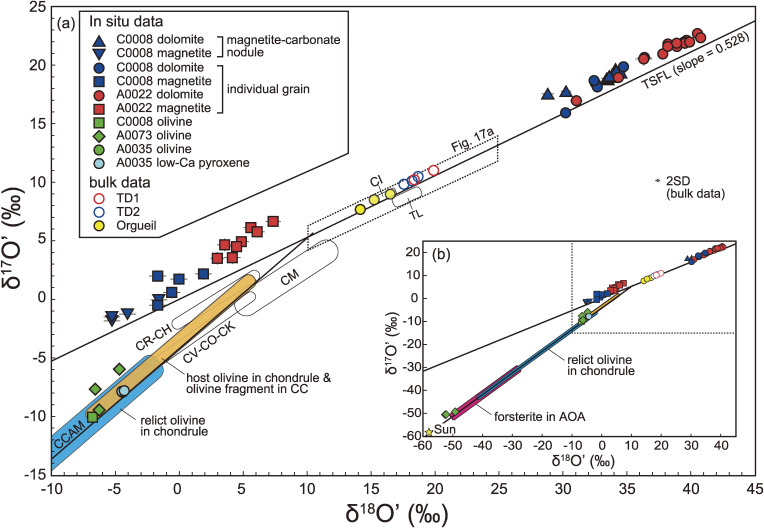
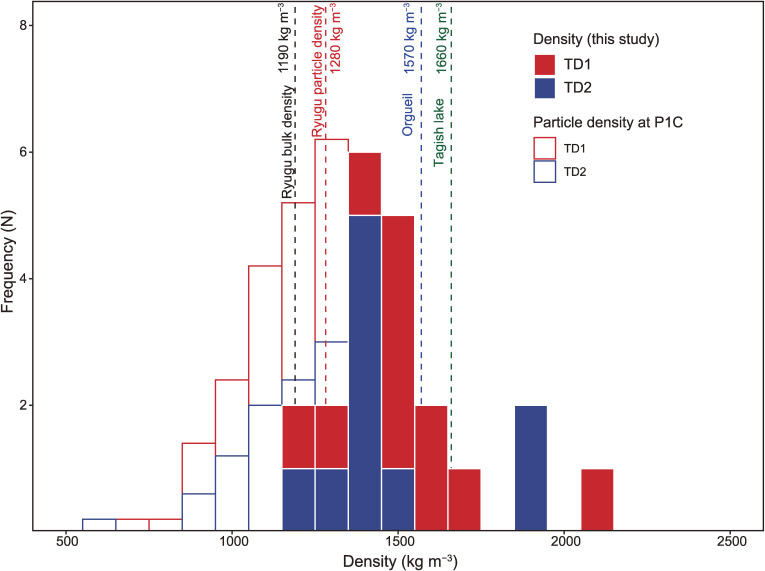
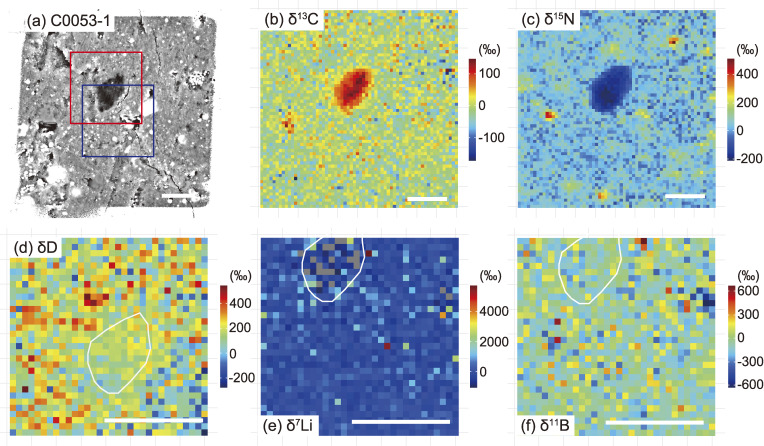
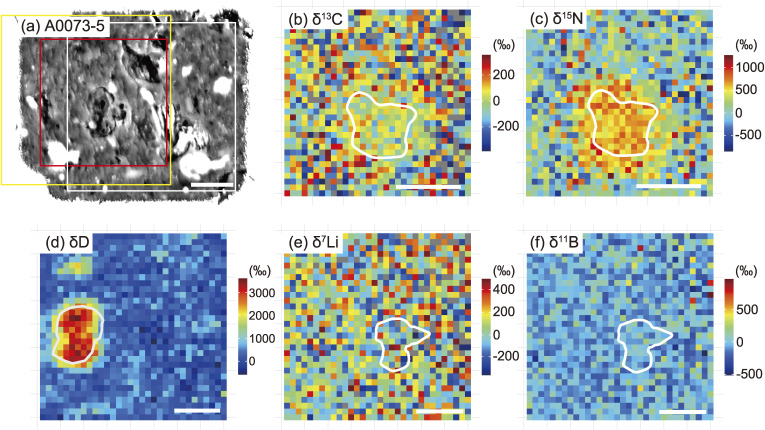
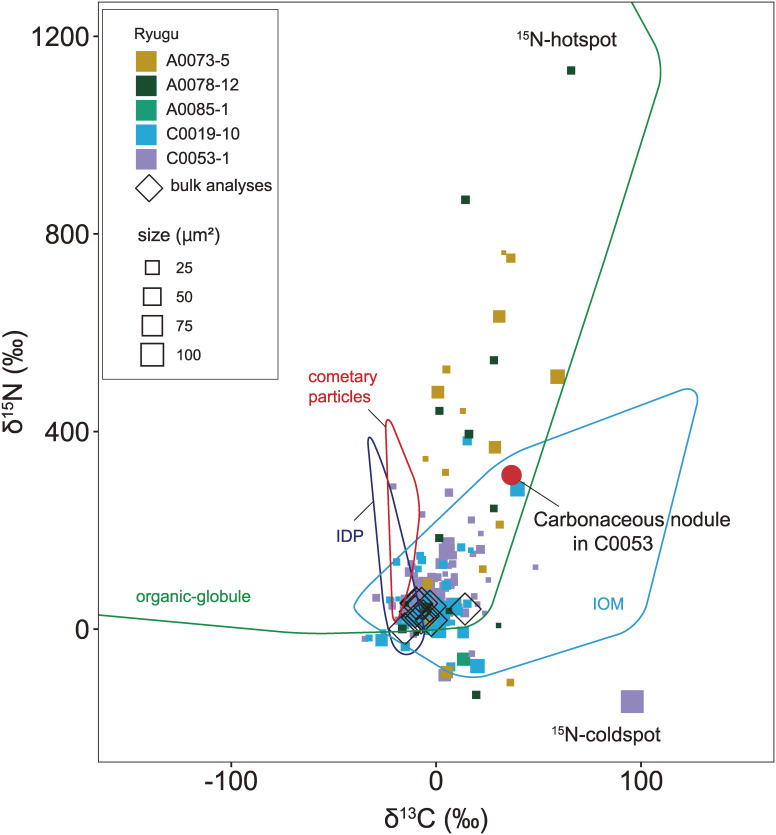
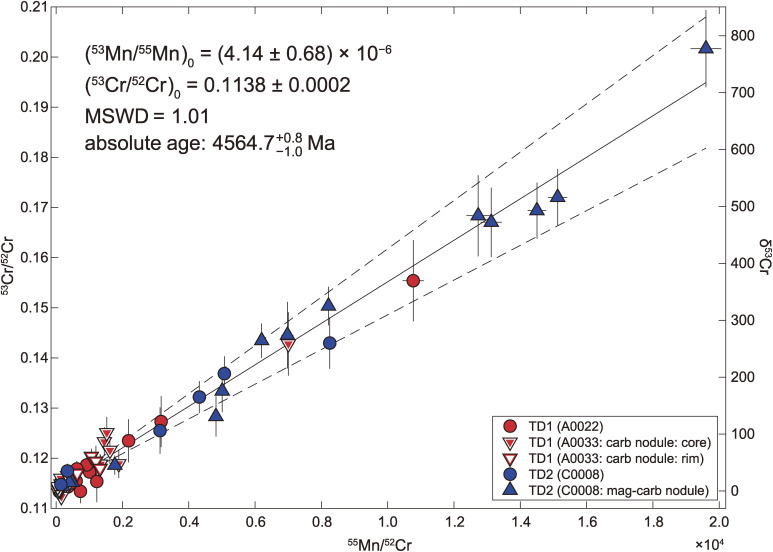
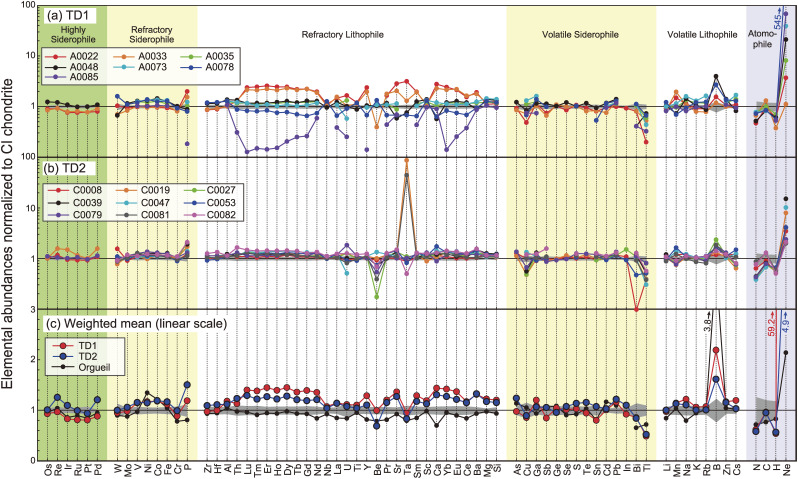
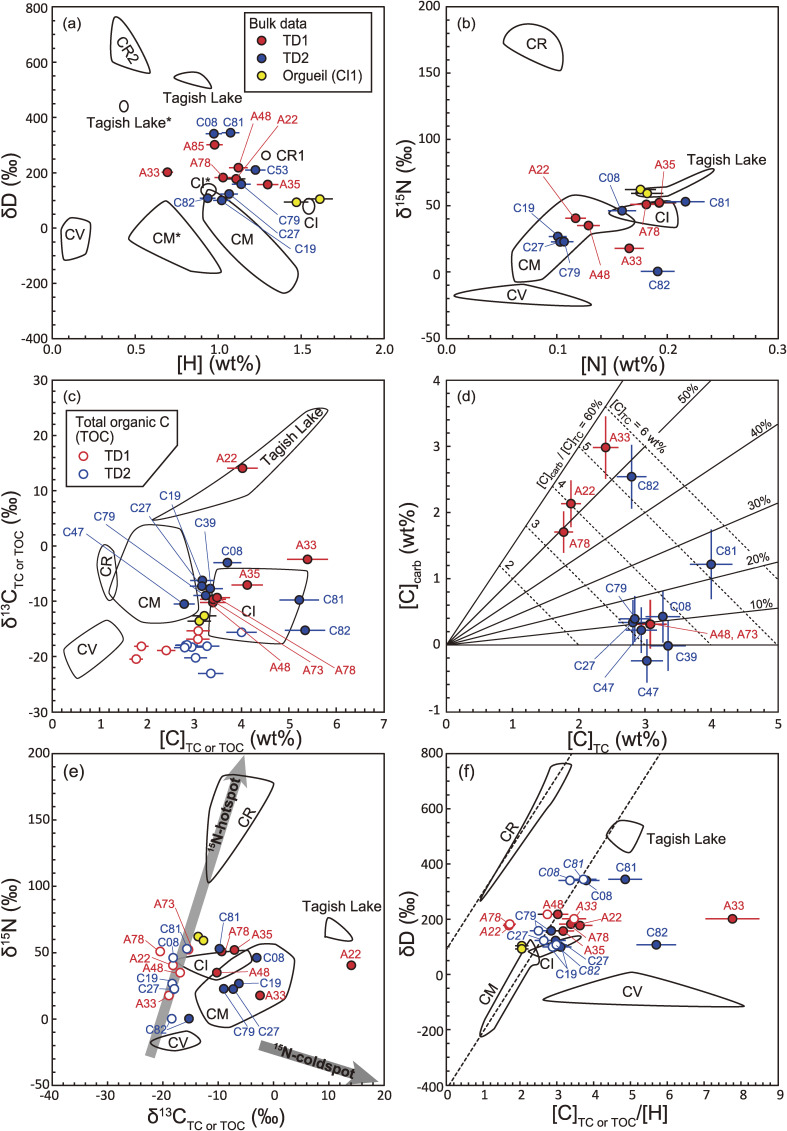
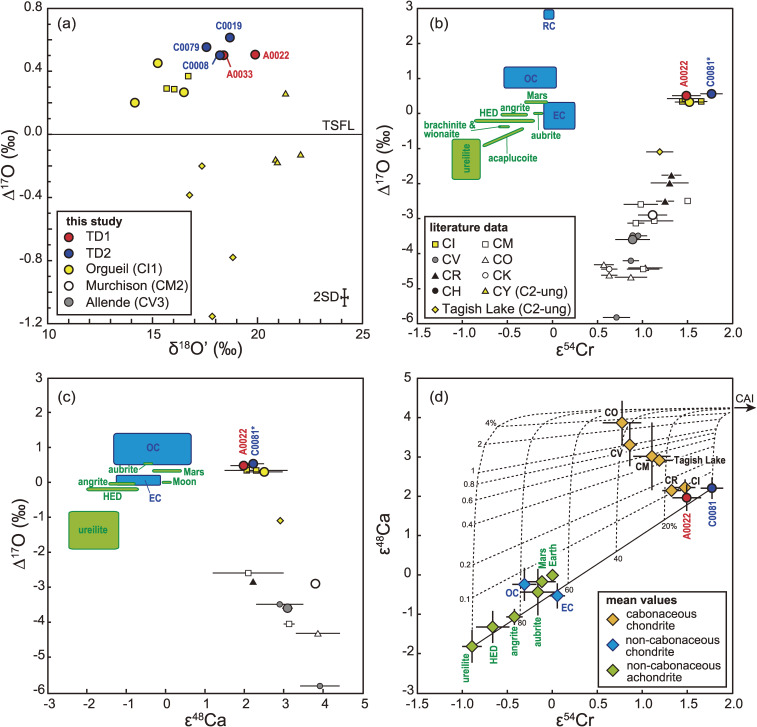
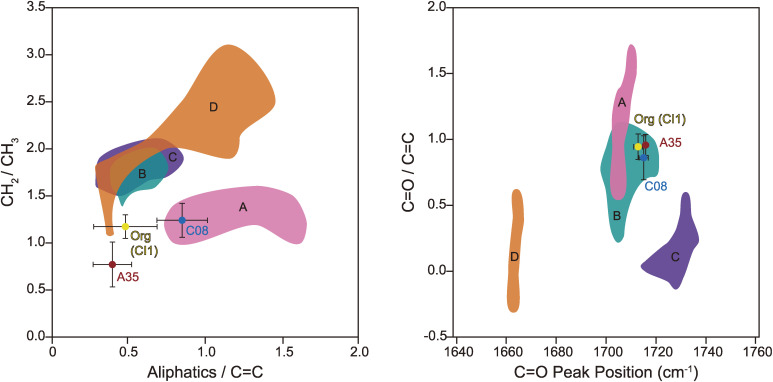
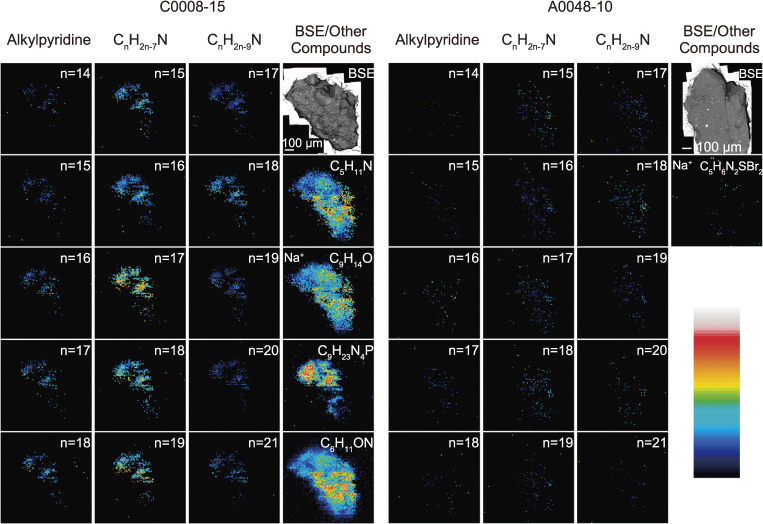
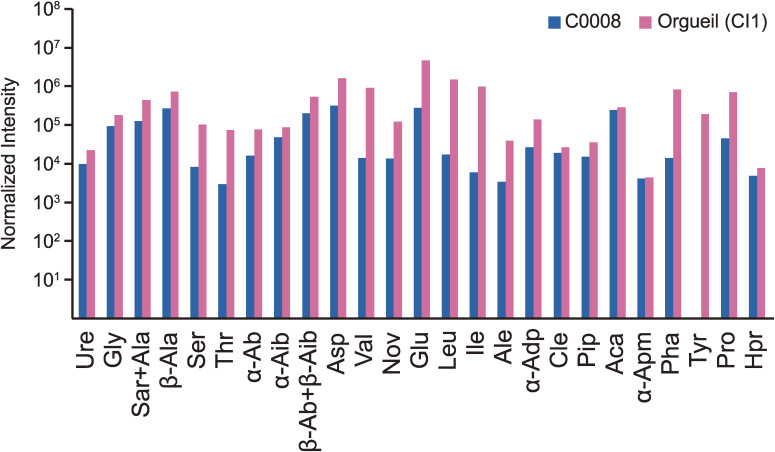
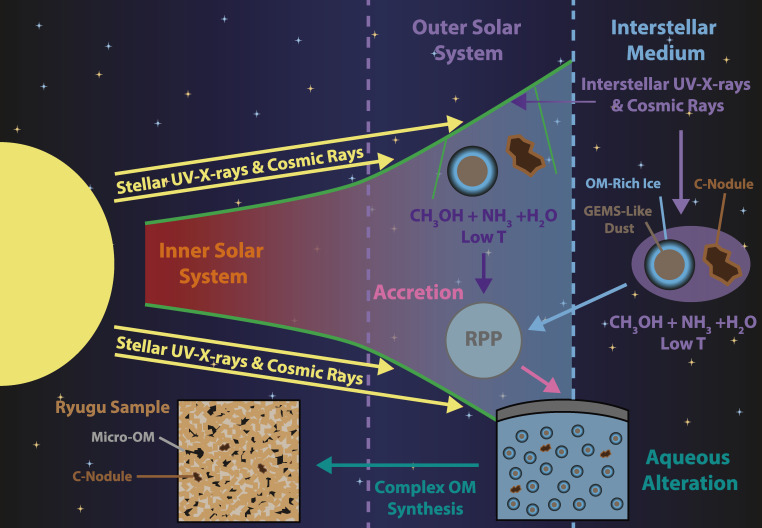
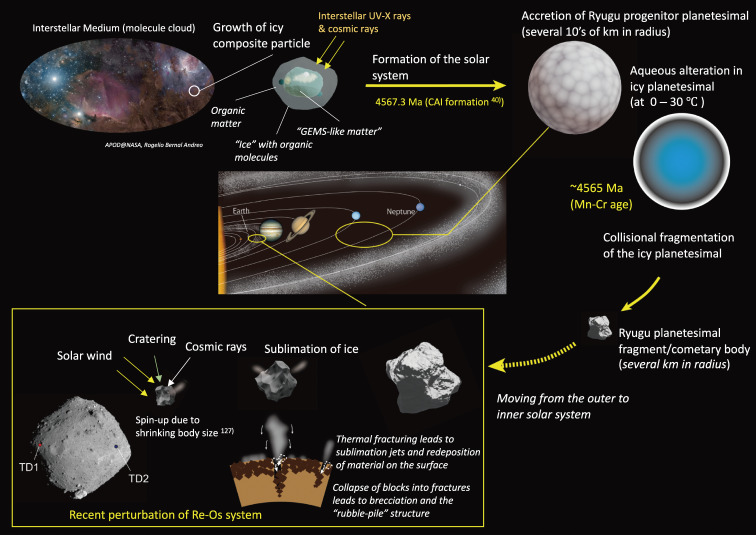
Presented here are the observations and interpretations from a comprehensive analysis of 16 representative particles returned from the C-type asteroid Ryugu by the Hayabusa2 mission. On average Ryugu particles consist of 50% phyllosilicate matrix, 41% porosity and 9% minor phases, including organic matter. The abundances of 70 elements from the particles are in close agreement with those of CI chondrites. Bulk Ryugu particles show higher δ18O, Δ17O, and ε54Cr values than CI chondrites. As such, Ryugu sampled the most primitive and least-thermally processed protosolar nebula reservoirs. Such a finding is consistent with multi-scale H-C-N isotopic compositions that are compatible with an origin for Ryugu organic matter within both the protosolar nebula and the interstellar medium. The analytical data obtained here, suggests that complex soluble organic matter formed during aqueous alteration on the Ryugu progenitor planetesimal (several 10's of km), <2.6 Myr after CAI formation. Subsequently, the Ryugu progenitor planetesimal was fragmented and evolved into the current asteroid Ryugu through sublimation.

Keywords: Hayabusa2; Ryugu; comprehensive analysis; interstellar medium; protosolar nebula; sample return.


Figures

Figure 1.
Figure 1.
Optical microscope images showing the surface and interior features. (a) A grain with a rugged and finely-cracked surface morphology. (b) A comparatively solid grain with planar fractures. (c) A solid grain with a smooth surface morphology. (d) A solid grain with a curved and smooth surface morphology. (e) The internal texture on the flat surface of A0035-1 prepared by ultra-microtome. The particle is characterized by components up to several 10’s of µm in size, which are encapsulated in a fine-grained ‘matrix’ that is dominated by phyllosilicates. A unique distinctive domain is present within A0035 (surrounded by dashed lines). The domain is massive in nature with more fine-grained components than the surrounding areas and includes abundant Fe-sulfide and no coarse-grained components. As such, this domain is termed the ‘massive domain’. (f) An enlarged view of the rectangle in (e). The massive domain is separated by a curved boundary (dashed lines) from the surrounding matrix.
Figure 2.
Figure 2.
The (a) bulk densities and (b) modal abundances of major components including void space. Major components include phyllosilicate, carbonate, magnetite, coarse-grained Fe-sulfide, phosphate, olivine + low-Ca pyroxene (LPx), and carbonaceous nodule.
Figure 3.
Figure 3.
The modes of occurrences of coarse-grained components. (a) Phyllosilicate nodules, a framboidal magnetite nodule, and a Fe-sulfide nodule. (b) A carbonaceous nodule, associated with a carbonate crystal and Fe-sulfides. (c) A coarse-grained carbonate nodule, with magnetite- and Fe-sulfide-inclusions at the core, and concentric chemical zonation (shown by arrows) at the rim. (d) Apatite crystals wrapped in a phyllosilicate film. (e) An angular fragment of olivine, where the surface is slightly altered by the ultra-microtome operation, causing the occurrence of fish-scale-like chips. Note that the olivine appears to be bright at the core due to charging. The chemical composition differs little between the core and the margin of the grain. (f) A composite grain of low-Ca pyroxene and olivine.
Figure 4.
Figure 4.
Scanning TEM images of a film of matrix from A0033-15, prepared by a focused ion beam. (a) A whole view of the film. Besides the µm-sized magnetite and dolomite and phyllosilicate nodules, a nano-OM and Fe-sulfides are widespread in the matrix, which is composed mainly of fine-grained phyllosilicates. The phyllosilicate nodule sometimes forms µm to sub-µm-sized yarn ball-like spheres (shown at the lower right of the image). (b) An enlarged view of a µm-sized phyllosilicate nodule. (c) A high-resolution view of the phyllosilicate. The width of the interlayers is ∼0.75 nm, corresponding to that of a Fe-bearing serpentine-group mineral.
Figure 5.
Figure 5.
The modes of occurrences of the coarse-grained components in Ryugu particles. (a) A cluster of magnetite showing various forms. (b) An enlarged view of a spherical magnetite. A spherulic magnetite represents a radial aggregate of nm-sized needle-like magnetite grains. On the surface of the magnetite there are µm-sized circular pits, which correspond to the shape of adjoining framboidal magnetite. (c) Framboidal magnetite grains, accompanied by phyllosilicate. The hexahedron magnetite grains (cube-shaped) occur as relatively small grains, with larger trapezohedron magnetite grains (high number of facets) occurring within several-µm, as shown toward the lower right of the image. (d) Clusters of framboidal magnetite grains. Irrespective of their size, the trapezohedron crystal faces are well developed. (e) A Fe-sulfide grain exhibiting well-developed crystal faces. (f) Secondary Fe-sulfides (2nd-Sulf), surrounding a carbonate grain and infilling micro-cracks in a matrix.
Figure 6.
Figure 6.
The different textures recorded by the matrix and the modes of occurrences of the coarse-grained components. (a) The phyllosilicate-dominated matrix. Note that there are locally-foliated domains (shown by arrows) in the matrix surrounding the massive domain. (b) A phyllosilicate nodule, surrounded by Fe-sulfide, in a phyllosilicate-dominated matrix. (c) A composite of a carbonaceous nodule and a phyllosilicate nodule. (d) A magnetite nodule with various forms of magnetite. (e) A magnetite nodule with spherical and framboidal magnetite grains. Note that framboidal magnetite grains which vary in size coexist in a single nodule. (f) A magnetite carbonate nodule, which includes platy and framboidal magnetite grains.
Figure 7.
Figure 7.
A carbonaceous nodule in the matrix of C0053-1. (a) BSE image, (b) Raman carbonate band (1098 cm−1) map, (c) Raman D-band map, and (d) Raman D/G map, (e) 12C12C map, (f) 12C14N map, (g) δ13C map, and (h) δ15N map from SIMS. The presence of micro-OM inside of the nodule is suggested by an intense 12C12C signal.
Figure 8.
Figure 8.
The O isotopic compositions of magnetite, dolomite, olivine and low-Ca pyroxene grains and the bulk values for Ryugu particles. δ17O' = ln(δ17O* + 1) where δ17O* = δ17O + 0.033 × 10⁻³, and δ18O' = ln(δ18O + 1). Compiled data for carbonaceous chondrites (CC) are from the literature.–194) Data for host olivines in chondrules and olivine fragments in CC are from previous studies,–196) data for relict olivine in CC chondrules are from the literature,197,198) and data for AOA are from a previous study.199) The error bar for bulk analysis values is 2SD. CCAM and TSFL denote carbonaceous chondrite anhydrous mineral line200) and terrestrial silicate fractionation line.201) TL is Tagish Lake (C2 ungrouped).
Figure 9.
Figure 9.
Density distributions of 16 particles. The density histogram measured at the P1C7) is also shown. The frequency (N) of the P1C7) was rescaled by a factor of 0.2 to match the apparent scale. The average density of the 16 particles is 1528 ± 242 (1SD) kg m−3. The density difference between TD1 and TD2 particles is −32 to 143 kg m−3 (50% of Bayesian credible interval), suggesting that there is no significant difference between the densities of TD1 and TD2 particles. As references, Ryugu bulk density,9) and bulk densities of Orgueil (CI1)30) and Tagish Lake (C2 ungrouped)31) meteorites are also shown in the figure.
Figure 10.
Figure 10.
C, N, H, Li, and B isotope maps of micro-OM in C0053-1. (a) BSE image. A 10 µm-sized dark object located in the center is the largest micro-OM in the area. The squares correspond to the regions where H (red) and Li and B (blue) isotope maps were obtained. (b) C isotope map. The δ13C value of the largest micro-OM is 96 ± 6‰ (1SE). (c) N isotope map. The δ15N value of the largest micro-OM is −147 ± 10‰ (1SE). Micrometer-sized 15N-rich objects are also micro-OM, some of which exceed δ15N ≈ 400‰. (d) H isotope map. The δD value of the largest micro-OM is 158 ± 30‰ (1SE). (e) Li isotope map. The δ7Li value of the largest micro-OM is 139 ± 404‰ (1SE). (f) B isotope map. The δ11B value of the largest micro-OM is −33 ± 80‰ (1SE). The area corresponding to the largest micro-OM is outlined in (d), (e), and (f). The scale bar in each figure corresponds to 10 µm.
Figure 11.
Figure 11.
C, N, H, Li, and B isotope maps of micro-OM in A0073-5. (a) BSE image. A 10 µm-sized dark object located in the center is the largest micro-OM in the area. The squares correspond to the regions where C and N (white), H (red), and Li and B (yellow) isotope maps were obtained. (b) C isotope map. The δ13C value of the largest micro-OM is 27 ± 69‰ (1SE). (c) N isotope map. The δ15N value of the largest micro-OM is 610 ± 78‰ (1SE). (d) H isotope map. The δD value of the largest micro-OM is 2983 ± 84‰ (1SE). (e) Li isotope map. The δ7Li value of the largest micro-OM is 29 ± 568‰ (1SE). (f) B isotope map. The δ11B value of the largest micro-OM is 0 ± 314‰ (1SE). The area corresponding to the largest micro-OM is outlined in (d), (e), and (f). The scale bar in each figure corresponds to 10 µm. Note that the shape of the largest micro-OM changed slightly because of spattering during analysis.
Figure 12.
Figure 12.
C and N isotopic compositions (δ13C vs. δ15N) of micro-OM and a carbonaceous nodule. The size of the symbols is proportional to that of the object analyzed. The δ13C and δ15N values from bulk analyses (this study) and the ranges for IOM,33) IDP,106,202) cometary particles,203) and organic-globules107) are also shown.
Figure 13.
Figure 13.
Mn-Cr isochron diagram for dolomite grains. By assuming a homogeneous distribution of the (53Mn/55Mn)0 in the early solar system, the 53Mn-53Cr age of dolomites, was calculated by the (53Mn/55Mn)0 = 4.14 × 10⁻⁶ relative to the D’Orbigny angrite with (53Mn/55Mn)0D’Orbigny = (3.24 ± 0.04) × 10−6 36) and the decay constant of 53Mn.37) The absolute age of dolomite grains was estimated to be 4564.71.0+0.8 Ma by referring to the Pb-Pb age of the D’Orbigny angrite with tD’Orbigny = 4563.37 ± 0.25 Ma.38,39)
Figure 14.
Figure 14.
(a) Elemental abundances of TD1 particles, (b) elemental abundances of TD2 particles, and (c) the weighted mean of the elemental abundances of TD1 and TD2 particles (Table S14). In (c), the elemental abundances of Orgueil (CI1) analyzed by this study are shown for comparison. The elemental abundances of all particles are normalized to the weighted mean value of CI chondrites.43) The 2 sigma range of CI chondrites43) is shown in gray. Note that the scales in (a) and (b) are logarithmic, and that in (c) is linear. The elements are ordered in terms of their volatility, which is defined by the 50% condensation temperature of each element in each element group.44) The particles A0022, C0019 and C0039 were contaminated by the Ta bullet, and the [Ta] of these particles were not included for the calculation of the weighted mean for the TD1 and TD2 particles.
Figure 15.
Figure 15.
(a) [Be] vs. [B] and (b) [Mo] vs. [Bi]. The broken lines represent the regression line for TD2 particles in (a) and (b). The yellow square represents the mean values of Orgueil (CI1) determined in this study. Cross is the Si-normalized solar abundance with a 1SD range are from Lodders.43) Note that the particle names have the first two zeros removed.
Figure 16.
Figure 16.
(a) [H] vs. δD, (b) [N] vs. δ15N, (c) [C] vs. δ13C, and (d) [C]TOC vs. [C]carb (TOC and carb denote total organic C and carbonate C), (e) δ13C vs. δ15N and (f) [C]/[H] vs. δD. Error bars are 2SD. In (c), (e), and (f), values of both total C (TC) and TOC are presented. Data for carbonaceous chondrites are from refs. , , –. The regions of CI, CM, and Tagish Lake (C2 ungrouped) indicated with * are from ref. (see the main text for more details). Solid and dashed lines in (d) are the mass fraction of calculated carbonate C in TOC and that of TC, respectively. The gray thick arrows in (e) indicate trajectories toward the 15N-hotspots and 15N-coldspots shown in Fig. 12. The dashed lines in (f) represent the fitting lines for CR and CM chondrites.49) Note that the particle names have the first two zeros removed.
Figure 17.
Figure 17.
(a) δ18O' vs. Δ17O, corresponding to the dashed rectangle in Fig. 8, (b) ε54Cr vs. Δ17O, (c) ε48Ca vs. Δ17O, and (d) ε54Cr vs. ε48Ca, with the values of terrestrial and extraterrestrial materials also included.–,,,,,,–230) *: Since the oxygen isotopic composition of C0081 was not determined, the average Δ17O of Ryugu was used for C0081. The error bars for data in this study and compiled data for carbonaceous chondrites from the literature are 2SE. The ranges of data for non-carbonaceous chondrites (OC, EC and RC) and achondrites are shown as blue and green areas in (b) and (c), where OC, EC, and RC denote ordinary, enstatite, and R chondrites, respectively. For other classes, error bars are either 2SE of an analysis (when only one analysis is available for a class), a range of two analyses (when only two analyses are available), or 1SD of the analyses (when more than three analyses are available). The solid line in (d) represents a mixing line between a highly thermally-processed disk reservoir (ureilite) and a disk reservoir that has experienced low thermal processing (C0081). Dashed lines in (d) represent mixing curves between CAI and the disk reservoirs, and the numbers represent the proportion of mixed CAI in percent. The Ca/Cr, ε54Cr, and ε48Ca values of CAI are 291, 6.2, and 4.3,–235) respectively. The ε54Cr, and ε48Ca values of ureilite are −0.9 and −1.8, respectively. The Ca/Cr value of the ureilite-Ryugu mixture is fixed as 1.1 (the solar value) because the Ca/Cr of ureilite does not represent that of the parent body.236)
Figure 18.
Figure 18.
(a) 1/[Ne] vs. 20Ne/22Ne, (b) 1/[Ne] vs. 21Ne/22Ne, and (c) 21Ne/22Ne vs. 20Ne/22Ne. (d) An enlarged view of the dashed rectangle in (c). The data for Orgueil (CI1) and Allende (CV3) obtained in this study are also shown. The bars labelled GCR and SCR in (c) denote the ranges of 20Ne/22Ne and 21Ne/22Ne of cosmogenic Ne, which would have been produced through irradiation by galactic and solar cosmic rays of Ryugu particles and are calculated using the models of refs. and , respectively. For comparison, data obtained by previous studies include Itokawa “ref” 62), Allende (CV3) “ref” –242), Orgueil (CI1) “ref” –66), Tagish Lake (C2 ungrouped) “ref” 243), solar wind (SW),63) and fractionated SW (fSW, formerly referred as solar energetic particle),244) and air.245)
Figure 19.
Figure 19.
(a) [Lu] vs. [Ne] and (b) [Lu] vs. 20Ne/22Ne. Note that the particle names have the first two zeros removed. A35D (solid circle) and A35L (open circle) indicate the matrix and the massive domain of A0035, respectively. Note that the [Lu] data in A35D and A35L are the same, because [Lu] was obtained from a bulk measurement of A0035.
Figure 20.
Figure 20.
Plots of the Raman peak parameters from Raman spectroscopy of Ryugu particles and Orgueil (CI1), Murchison (CM2), and Murray (CM2). (a) Peak position (cm−1) vs. FWHM (full width at half maximum) of the G-band peak, and (b) Raman shift peak position (cm−1) of the G-band vs. the D/G peak area ratio. The error bars are 1SE. In both diagrams, maker sizes for TD1 and TD2 are proportional to the mean [Ne] from cosmogenic (cos) component (in 10−8 ccSTP g−1) in each particle.
Figure 21.
Figure 21.
FTIR vibrational modes for IOM from Ryugu particles and Orgueil (CI1) from this study, isolated via HCl/HF demineralization, and type 1, 2 and 3 carbonaceous chondrites from the literature.72) The groups A to D refer to: A). Type 1 and 2 carbonaceous chondrites that are most representative of their original organic precursors, B). Carbonaceous chondrites that have undergone either low-temperature oxidation or low-grade thermal metamorphism, C). Intense thermal metamorphism with low H2O activity and D). Intense thermal metamorphism with high H2O activity. Note that the particle names have the first two zeros removed and aliphatics refers to the sum of the CHx band intensities.
Figure 22.
Figure 22.
Representative ion intensity maps from Ryugu particles for the different homologue series and compounds identified, which were normalized to the total ion chromatogram (TIC). Note that the homologue general formula is indicated at the top of each column and the number of C present in each homologue member is represented in the top right corner of each image. For the non-homologue compounds, the chemical formula is indicated in the top right corner of each image and a Na+ is used to indicate those compounds that were detected as a sodium adduct. For a more detailed representation of the DESI-OT-MS responses of Ryugu particles, please see Fig. SA13 and for the blanks, see Fig. SA14. The color scale has been placed at the righthand side of the figure and it is a rainbow style scale ranging from black (lowest values) to white (highest values).
Figure 23.
Figure 23.
The amino acids and urea detected in Ryugu and Orgueil (CI1). The intensity of each amino acid was normalized to the sample weight. For the more information concerning the data acquired see Table S20.
Figure 24.
Figure 24.
The origin and evolution of OM within Ryugu particles. UV-X-rays from the protosun interact with the surface of the PSN. In the outer PSN temperatures are low enough for water, ammonia and simple organic molecules, such as methanol, to condense and form ices on dust grains. The ice mixtures are then irradiated by both stellar and interstellar UV-X-rays and also by galactic and solar cosmic rays, producing both SOM and IOM. A similar mechanism can also form OM in the ISM, but through only interstellar UV-X-rays and galactic cosmic rays. Carbonaceous nodules (C-nodule) could be formed through aggregation of dust and OM. All the aforementioned organic components and their dust grain hosts, as well as the ice mixtures, could then be accreted into the Ryugu progenitor planetesimal (RPP). Heating from the decay of 26Al would then melt the ice to yield water-rich fluids that in turn initiate aqueous alteration. During aqueous alteration a variety of organic syntheses, such as formose, condensation, Michael addition, hydrolysis and carbonisation reactions and Strecker and Chichiban synthesis, would yield complex SOM and IOM. In combination the above processes can explain the variation in the types of OM present within Ryugu, as well as their isotopic composition.
Figure 25.
Figure 25.
The evolutional history of the asteroid Ryugu. The Ryugu progenitor body is thought to have been an icy planetesimal (several 10’s of km in size) that may have formed in the trans-Neptunian region (TNR) through the accretion of icy particles. The accreted components record various origins, likely including both those in the ISM and PSN. The interior of the icy planetesimal melted due to the heat generated from radioactive decay of mainly 26Al. As a result, rocky materials that were accreted with the icy particles underwent aqueous alteration (∼4565 Ma). As the heat from radiative decay decreased, the icy planetesimal was again frozen. Although the timing is unknown, the icy planetesimal was fragmented, forming a cometary body, which represents the precursor of the asteroid Ryugu. Subsequently, as a result of solar system dynamics, the cometary body moved into the interior of the solar system. Due to the sublimation of ice caused by solar radiation, the cometary body gradually decreased in size. Thermal fracturing and sublimation jets, as well as the dynamics associated with the spin up of the body, led to the brecciation of rocky material and re-accumulation of dust at the surface of the body. The accumulated dust was then sintered in place, forming layers that would become the slab like material at the TD1 site. After the complete sublimation of ice from the surface of the body, the current day Ryugu was formed.

Similar articles

  • The Albedo of Ryugu: Evidence for a High Organic Abundance, as Inferred from the Hayabusa2 Touchdown Maneuver.
    Potiszil C, Tanaka R, Kobayashi K, Kunihiro T, Nakamura E. Potiszil C, et al. Astrobiology. 2020 Jul;20(7):916-921. doi: 10.1089/ast.2019.2198. Epub 2020 Jun 15. Astrobiology. 2020. PMID: 32543220 Free PMC article.
  • Abundant presolar grains and primordial organics preserved in carbon-rich exogenous clasts in asteroid Ryugu.
    Nguyen AN, Mane P, Keller LP, Piani L, Abe Y, Aléon J, Alexander CMO, Amari S, Amelin Y, Bajo KI, Bizzarro M, Bouvier A, Carlson RW, Chaussidon M, Choi BG, Dauphas N, Davis AM, Di Rocco T, Fujiya W, Fukai R, Gautam I, Haba MK, Hibiya Y, Hidaka H, Homma H, Hoppe P, Huss GR, Ichida K, Iizuka T, Ireland TR, Ishikawa A, Itoh S, Kawasaki N, Kita NT, Kitajima K, Kleine T, Komatani S, Krot AN, Liu MC, Masuda Y, McKeegan KD, Morita M, Motomura K, Moynier F, Nakai I, Nagashima K, Nesvorný D, Nittler L, Onose M, Pack A, Park C, Qin L, Russell SS, Sakamoto N, Schönbächler M, Tafla L, Tang H, Terada K, Terada Y, Usui T, Wada S, Wadhwa M, Walker RJ, Yamashita K, Yin QZ, Yokoyama T, Yoneda S, Young ED, Yui H, Zhang AC, Nakamura T, Naraoka H, Noguchi T, Okazaki R, Sakamoto K, Yabuta H, Abe M, Miyazaki A, Nakato A, Nishimura M, Okada T, Yada T, Yogata K, Nakazawa S, Saiki T, Tanaka S, Terui F, Tsuda Y, Watanabe SI, Yoshikawa M, Tachibana S, Yurimoto H. Nguyen AN, et al. Sci Adv. 2023 Jul 14;9(28):eadh1003. doi: 10.1126/sciadv.adh1003. Epub 2023 Jul 14. Sci Adv. 2023. PMID: 37450600 Free PMC article.
  • Organic Matter in the Asteroid Ryugu: What We Know So Far.
    Potiszil C, Yamanaka M, Sakaguchi C, Ota T, Kitagawa H, Kunihiro T, Tanaka R, Kobayashi K, Nakamura E. Potiszil C, et al. Life (Basel). 2023 Jun 26;13(7):1448. doi: 10.3390/life13071448. Life (Basel). 2023. PMID: 37511823 Free PMC article. Review.
  • The evolution of organic material on Asteroid 162173 Ryugu and its delivery to Earth.
    Changela HG, Kebukawa Y, Petera L, Ferus M, Chatzitheodoridis E, Nejdl L, Nebel R, Protiva V, Krepelka P, Moravcova J, Holbova R, Hlavenkova Z, Samoril T, Bridges JC, Yamashita S, Takahashi Y, Yada T, Nakato A, Sobotkova K, Tesarova H, Zapotok D. Changela HG, et al. Nat Commun. 2024 Jul 22;15(1):6165. doi: 10.1038/s41467-024-50004-w. Nat Commun. 2024. PMID: 39039074 Free PMC article.
  • Formation and processing of organics in the early solar system.
    Kerridge JF. Kerridge JF. Space Sci Rev. 1999;90(1-2):275-88. doi: 10.1007/978-94-011-4211-3_25. Space Sci Rev. 1999. PMID: 11543289 Review.

Cited by

References

    1. Kawaguchi J., Uesugi K., Fujiwara A. (2003) The MUSES-C mission for the sample and return—its technology development status and readiness. Acta Astronaut. 52, 117–123.
    1. Nakamura E., Makishima A., Moriguti T., Kobayashi K., Tanaka R., Kunihiro T., et al. (2012) Space environment of an asteroid preserved on micrograins returned by the Hayabusa spacecraft. Proc. Natl. Acad. Sci. U.S.A. 109, E624–E629. - PMC - PubMed
    1. Tsuda Y., Saiki T., Terui F., Nakazawa S., Yoshikawa M., Watanabe S., et al. (2020) Hayabusa2 mission status: Landing, roving and cratering on asteroid Ryugu. Acta Astronaut. 171, 42–54.
    1. Kitazato K., Milliken R.E., Iwata T., Abe M., Ohtake M., Matsuura S., et al. (2019) The surface composition of asteroid 162173 Ryugu from Hayabusa2 near-infrared spectroscopy. Science 364, eaav7432. - PubMed
    1. Sugita S., Honda R., Morota T., Kameda S., Sawada H., Tatsumi E., et al. (2019) The geomorphology, color, and thermal properties of Ryugu: Implications for parent-body processes. Science 364, eaaw0422. - PMC - PubMed